Blog / 阅读

highcharts详细参数实例非常详细的例子。

by admin on 2014-05-04 12:45:02 in ,


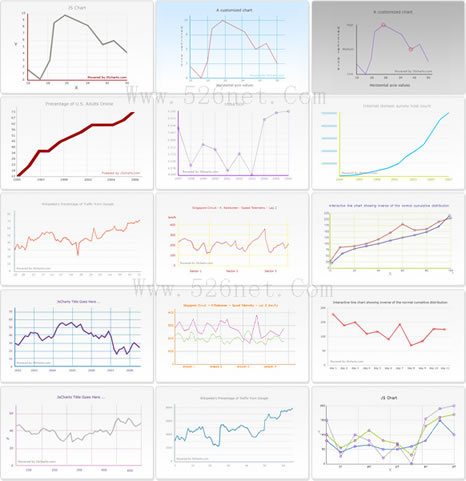
最近在做走势图,着个插件很好用。这里收集了一些highcharts详细参数实例非常详细的例子。供大家参考。

<html> 

<head>  
        <title>highcharts报表示例</title>  
        <meta http-equiv="Content-Type" content="text/html; charset=UTF-8"/>  
        <script type="text/javascript" src="./js/jquery.min.js"></script>  
        <script type="text/javascript">  
            $(function () {  
                var chart;  
                $(document).ready(function() {  
                    /**  
                     * highcharts数据图表  
                     *   
                     * @param {object} chart 图表的相关参数配置  
                     * @param {object} credits 图表版权信息参数配置  
                     * @param {object} lang 图表语言参数配置  
                     * @param {object} exporting 导出配置  
                     * @param {object} title 标题配置  
                     * @param {object} xAxis X轴配置  
                     * @param {object} yAxis Y轴配置  
                     * @param {object} plotOptions 各类型图表绘制配置  
                     * @param {object} labels 数据图表标签配置  
                     * @param {array} series 数据源配置  
                     */  
                    chart = new Highcharts.Chart({  
                        /**  
                         * 图表配置  
                         *   
                         * @param {string} renderTo 图表加载的位置  
                         * @param {int} width 图表的宽度  
                         * @param {int} hight 图表的高度  
                         * @param {string} type 图表的默认类型  
                         * @param {string} zoomType 图表的缩放选项,有:x, y, xy  
                         */  
                        chart: {  
                            // 图表加载的位置  
                            renderTo: 'container',  
                            // 图表宽度  
                            width: 600,  
                            // 图表高度  
                            hight: 500,  
                            // 默认图表类型  
                            type: 'line',  
                            // 缩放配置:x,y,xy  
                            zoomType: ''  
                        },  
  
                        /**  
                         * 版权信息配置,不用修改直接复制  
                         *   
                         * @param {boolean} enabled 是否显示版权信息  
                         * @param {string} href 版权信息所链接到的地址  
                         * @param {string} text 版权信息所显示的文字内容  
                         */  
                        credits:{  
                            enabled: false,  
                            href: "http://www.msnui.tk/Admin",  
                            text: '微源网络科技'  
                        },  
  
                        /**  
                         * 语言配置,不用修改直接复制  
                         *   
                         * @param {string} exportButtonTitle 导出按钮的标题文字  
                         * @param {string} printButtonTitle 打印按钮的标题文字  
                         */  
                        lang:{  
                            exportButtonTitle:'导出PDF',  
                            printButtonTitle:'打印报表'  
                        },  
  
                        /**  
                         * 导出配置,不用修改直接复制  
                         *   
                         * @param {boolean} enabled 是否允许导出  
                         * @param {object} buttons 关于与导出和打印按钮相关的配置对象  
                         * @param {string} filename 导出文件的文件名  
                         * @param {string} type 默认导出文件的格式  
                         */  
                        exporting:{  
                            // 是否允许导出  
                            enabled:true,  
                            // 按钮配置  
                            buttons:{  
                                // 导出按钮配置  
                                exportButton:{  
                                    menuItems: null,  
                                    onclick: function() {  
                                        this.exportChart();  
                                    }  
                                },  
                                // 打印按钮配置  
                                printButton:{  
                                    enabled:false  
                                }  
                            },  
                            // 文件名  
                            filename: '报表',  
                            // 导出文件默认类型  
                            type:'application/pdf'  
                        },  
  
                        /**  
                         * 图表的标题  
                         *   
                         * @param {string} text 图表的标题,如果不需要显示标题,直接设置为空字符串就行  
                         */  
                        title: {  
                            text: '联合图表实例'  
                        },  
  
                        /**  
                         * X轴配置  
                         *   
                         * @param {array} categories X轴坐标分类值  
                         * @param {object} labels 坐标标签配置对象  
                         * @param {int} tickInterval 坐标轴的步进值  
                         * @param {object} title 坐标轴标题  
                         */  
                        xAxis: {  
                            // X轴分类  
                            categories: ['苹果', '桔子', '梨子', '香蕉', '李子'],  
                            // 坐标轴的标签  
                            labels:{  
                                // 标签位置  
                                align: 'center',  
                                // 标签格式化  
                                formatter: function(){  
                                    return this.value;  
                                },  
                                // 标签旋转度数  
                                rotation: 20,  
                                // 标签交错显示的行数  
                                staggerLines: 1  
                            },  
                            // X轴的步进值,决定隔多少个显示一个  
                            tickInterval: 1,  
                            // 坐标轴标题  
                            title: {  
                                text: '水果分类'  
                            }  
                        },  
  
                        /**  
                         * y轴配置  
                         *   
                         * @param {object} labels 坐标标签配置对象  
                         * @param {int} tickInterval 坐标轴的步进值  
                         * @param {object} title 坐标轴标题  
                         */  
                        yAxis: {  
                            // 坐标轴的标签  
                            labels:{  
                                // 标签位置  
                                align: 'right',  
                                // 标签格式化  
                                formatter: function(){  
                                    return this.value + '个';  
                                }  
                            },  
                            // y轴的步进值,决定隔多少个显示一个  
                            tickInterval: 3,  
                            // 坐标轴标题  
                            title: {  
                                text: '水果个数'  
                            }  
                        },  
  
                        /**  
                         * 绘图的各选项、参数配置  
                         * @param {object} series 数列,可以配置各种不同类型图表的默认参数  
                         * @param {object} bar 横向柱状图配置参数  
                         * @param {object} column 纵向柱状图配置参数  
                         * @param {object} line 线性图  
                         * @param {object} spline 圆滑曲线图配置参数  
                         * @param {object} pie 饼状图  
                         */  
                        plotOptions:{  
                            /**  
                             * 数列,对于所有的图表都可以适用的配置参数,属于共用性质。  
                             */  
                            series: {  
                                // 鼠标样式  
                                cursor: 'pointer',  
                                events:{  
                                    // 数据标注不可点击  
                                    legendItemClick: false  
                                },  
                                // 当是柱状图时,柱状的宽度  
                                pointWidth: 15  
                            },  
  
                            /**  
                             * 横向柱状图  
                             */  
                            bar:{  
                                // 数据点的点击事件  
                                events:{  
                                    click: function(event){  
                                        //alert('The bar was clicked, and you can add any other functions.');  
                                    }  
                                },  
                                // 当值为0时,在图表中柱状体的长度设置  
                                minPointLength: 2,  
                                // 当具体的数据点被点击时的事件响应函数。如果不需要事件响应,可以删除。  
                                point:{  
                                    events:{  
                                        click: function(){  
                                            //alert('This point was clicked. You can and any other functions.');  
                                        }  
                                    }  
                                },  
                                // 是否在图注中显示。  
                                showInLegend: true,  
                                // 是否堆叠,默认:null,数值:normal,百分比:percent  
                                //stacking: 'normal',  
                                // 调整图像顺序关系  
                                zIndex: 1  
                            },  
  
                            /**  
                             * 纵向柱状图  
                             */  
                            column:{  
                                // 数据点的点击事件  
                                events:{  
                                    click: function(event){  
                                        //alert('The bar was clicked, and you can add any other functions.');  
                                    }  
                                },  
                                // 当值为0时,在图表中柱状体的长度设置  
                                minPointLength: 2,  
                                // 当具体的数据点被点击时的事件响应函数。如果不需要事件响应,可以删除。  
                                point:{  
                                    events:{  
                                        click: function(){  
                                            //alert('This point was clicked. You can and any other functions.');  
                                        }  
                                    }  
                                },  
                                // 是否在图注中显示。  
                                showInLegend: true,  
                                // 是否堆叠,默认:null,数值:normal,百分比:percent  
                                //stacking: null,  
                                // 调整图像顺序关系  
                                zIndex: 2  
                            },  
  
                            /**  
                             * 线性图,与spline的区别在于点与点之间的连线是直线还是圆滑曲线。  
                             */  
                            line:{  
                                // 允许线性图上的数据点进行点击  
                                allowPointSelect: true,  
                                // 数据点的点击事件  
                                events:{  
                                    click: function(event){  
                                        //alert('The bar was clicked, and you can add any other functions.');  
                                    }  
                                },  
                                // 当具体的数据点被点击时的事件响应函数。如果不需要事件响应,可以删除。  
                                point:{  
                                    events:{  
                                        click: function(){  
                                            //alert('This point on the line was clicked. You can and any other functions.');  
                                        }  
                                    }  
                                },  
                                // 是否在图注中显示。  
                                showInLegend: true,  
                                // 调整图像顺序关系  
                                zIndex: 3  
                            },  
  
                            /**  
                             * 曲线图,与spline的区别在于点与点之间的连线是直线还是圆滑曲线。  
                             */  
                            spline:{  
                                // 允许线性图上的数据点进行点击  
                                allowPointSelect: true,  
                                // 数据点的点击事件  
                                events:{  
                                    click: function(event){  
                                        //alert('The bar was clicked, and you can add any other functions.');  
                                    }  
                                },  
                                // 当具体的数据点被点击时的事件响应函数。如果不需要事件响应,可以删除。  
                                point:{  
                                    events:{  
                                        click: function(){  
                                            //alert('This point on the line was clicked. You can and any other functions.');  
                                        }  
                                    }  
                                },  
                                // 是否在图注中显示。  
                                showInLegend: true,  
                                // 调整图像顺序关系  
                                zIndex: 3  
                            },  
  
                            /**  
                             * 饼状图  
                             */  
                            pie:{  
                                // 是否允许扇区点击  
                                allowPointSelect: true,  
                                // 点击后,滑开的距离  
                                slicedOffset: 5,  
                                // 饼图的中心坐标  
                                center: [100, 80],  
                                // 饼图的大小  
                                size: 100,  
                                // 数据标签  
                                dataLabels: {  
                                    // 是否允许标签  
                                    enabled: true,  
                                    // 标签与图像元素之间的间距  
                                    distance: 10  
                                },  
                                // 数据点的点击事件  
                                events:{  
                                    click: function(event){  
                                        //alert('The bar was clicked, and you can add any other functions.');  
                                    }  
                                },  
                                // 是否忽略隐藏的项  
                                ignoreHiddenPoint: true,  
                                // 当具体的数据点被点击时的事件响应函数。如果不需要事件响应,可以删除。  
                                point:{  
                                    events:{  
                                        click: function(){  
                                            //alert('This point on the line was clicked. You can and any other functions.');  
                                        }  
                                    }  
                                },  
                                // 是否在图注中显示。  
                                showInLegend: false,  
                                // 调整图像顺序关系  
                                zIndex: 0  
                            }  
                        },  
  
                        /**  
                         * 数据图表标签配置  
                         *   
                         * @param {array} items 项目配置  
                         */  
                        labels: {  
                            items: [{  
                                    html: '水果总消耗量',  
                                    style: {  
                                        left: '65px',  
                                        top: '8px',  
                                        color: 'black'  
                                    }  
                                }]  
                        },  
  
                        /**  
                         * 数据源配置,本身是一个对象数组  
                         *   
                         * @param {string} type 图表的类型  
                         * @param {string} name 数据序列的名称  
                         * @param {array} data 数据序列,是一个对象数组  
                         */  
                        series: [{  
                                type: 'column',  
                                name: 'Jane',  
                                data: [3, 2, 1, 3, 4]  
                            }, {  
                                type: 'column',  
                                name: 'John',  
                                data: [2, 3, 5, 7, 6]  
                            }, {  
                                type: 'column',  
                                name: 'Joe',  
                                data: [4, 3, 3, 9, 0]  
                            }, {  
                                type: 'spline',  
                                name: '平均',  
                                data: [3, 2.67, 3, 6.33, 3.33]  
                            }, {  
                                type: 'pie',  
                                name: '水果总消耗量',  
                                data: [{  
                                        name: 'Jane',  
                                        y: 13,  
                                        color: '#4572A7' // Jane's color  
                                    }, {  
                                        name: 'John',  
                                        y: 23,  
                                        color: '#AA4643' // John's color  
                                    }, {  
                                        name: 'Joe',  
                                        y: 19,  
                                        color: '#89A54E' // Joe's color  
                                    }]  
                            }]  
                    });  
                });  
  
            });  
        </script>  
    </head>  
    <body>  
        <script src="./js/highcharts/highcharts.js"></script>  
        <script src="./js/highcharts/modules/exporting.js"></script>  
  
        <div id="container"></div>  
    </body>  
</html>  
---------------------------------------------------------------------------------
2. highstock实例代码,其中导出功能配置了本地化,用的是exporting中的导出接口。


<html>  
    <head>  
        <title>highstock报表示例</title>  
        <meta http-equiv="Content-Type" content="text/html; charset=UTF-8"/>  
        <script type="text/javascript" src="./js/jquery.min.js"></script>  
        <!-- 源数据 -->  
        <script type="text/javascript" src="./js/usdeur.js"></script>  
        <script type="text/javascript">  
            //图表  
            $(function() {  
  
                /**  
                 * highstock数据图表  
                 *   
                 * @param {object} chart 图表的相关参数配置  
                 * @param {object} credits 图表版权信息参数配置  
                 * @param {object} lang 图表语言参数配置  
                 * @param {object} exporting 导出配置  
                 * @param {object} title 标题配置  
                 * @param {object} xAxis X轴配置  
                 * @param {array} series 数据源配置  
                 */  
                var chart1 = new Highcharts.StockChart({  
  
                    /**  
                     * 图表配置  
                     *   
                     * @param {string} renderTo 图表加载的位置  
                     * @param {int} width 图表的宽度  
                     * @param {int} hight 图表的高度  
                     */  
                    chart: {  
                        renderTo: 'container',  
                        // 图表宽度  
                        width: 700,  
                        // 图表高度  
                        hight: 500  
                    },  
  
                    /**  
                     * 版权信息配置,不用修改直接复制  
                     *   
                     * @param {boolean} enabled 是否显示版权信息  
                     * @param {string} href 版权信息所链接到的地址  
                     * @param {string} text 版权信息所显示的文字内容  
                     */  
                    credits:{  
                        enabled: false,  
                        href: "http://www.msnui.tk/Admin",  
                        text: '微源网络科技'  
                    },  
  
                    /**  
                     * 语言配置,不用修改直接复制  
                     *   
                     * @param {array} months 配置月份语言  
                     * @param {array} shortMonths 配置短月份  
                     * @param {array} weekdays 配置星期  
                     * @param {string} exportButtonTitle 导出按钮的标题文字  
                     * @param {string} printButtonTitle 打印按钮的标题文字  
                     */  
                    lang:{  
                        months: ['一月', '二月', '三月', '四月', '五月', '六月', '七月', '八月', '九月', '十月', '十一月', '十二月'],  
                        shortMonths: ['一月', '二月', '三月', '四月', '五月', '六月', '七月', '八月', '九月', '十月', '十一', '十二'],  
                        weekdays: ['星期天', '星期一', '星期二', '星期三', '星期四', '星期五', '星期六'],  
                        exportButtonTitle:'导出PDF',  
                        printButtonTitle:'打印报表'  
                    },  
  
                    /**  
                     * 导出配置,不用修改直接复制  
                     *   
                     * @param {boolean} enabled 是否允许导出  
                     * @param {object} buttons 关于与导出和打印按钮相关的配置对象  
                     * @param {string} filename 导出文件的文件名  
                     * @param {string} type 默认导出文件的格式  
                     */  
                    exporting:{  
                        // 是否允许导出  
                        enabled:true,  
                        // 按钮配置  
                        buttons:{  
                            // 导出按钮配置  
                            exportButton:{  
                                menuItems: null,  
                                onclick: function() {  
                                    this.exportChart();  
                                }  
                            },  
                            // 打印按钮配置  
                            printButton:{  
                                enabled:false  
                            }  
                        },  
                        // 文件名  
                        filename: '报表',  
                        // 配置导出接口  
                        url: 'http://' + location.hostname + '/test/Highcharts-2.3.2/example/exporting/index.php',  
                        // 导出文件默认类型  
                        type:'application/pdf'  
                    },  
  
                    /**  
                     * 图表的标题  
                     *   
                     * @param {string} text 图表的标题,如果不需要显示标题,直接设置为空字符串就行  
                     */  
                    title: {  
                        text: '图表实例标题'  
                    },  
  
                    /**  
                     * 域选择配置  
                     *   
                     * @param {array} buttons 缩放选择按钮  
                     * @param {int} selected 默认选择缩放按钮中的第几个  
                     * @param {boolean} inputEnabled 是否允许input标签选框  
                     */  
                    rangeSelector: {  
                        // 缩放选择按钮,是一个数组。  
                        // 其中type可以是: 'millisecond', 'second', 'minute', 'day', 'week', 'month', 'ytd' (year to date), 'year' 和 'all'。  
                        // 其中count是指多少个单位type。  
                        // 其中text是配置显示在按钮上的文字  
                        buttons: [{  
                                type: 'month',  
                                count: 1,  
                                text: '1月'  
                            }, {  
                                type: 'month',  
                                count: 3,  
                                text: '3月'  
                            }, {  
                                type: 'month',  
                                count: 6,  
                                text: '6月'  
                            }, {  
                                type: 'year',  
                                count: 1,  
                                text: '1年'  
                            },{  
                                type: 'year',  
                                count: 3,  
                                text: '3年'  
                            }, {  
                                type: 'all',  
                                text: '所有'  
                            }],  
                        // 默认选择域:0(缩放按钮中的第一个)、1(缩放按钮中的第二个)……  
                        selected: 1,  
                        // 是否允许input标签选框  
                        inputEnabled: false  
                    },  
  
                    /**  
                     * 气泡示说明标签  
                     *   
                     * @param {string} xDateFormat 日期时间格式化  
                     */  
                    tooltip:{  
                        // 日期时间格式化  
                        xDateFormat: '%Y-%m-%d %A'  
                    },  
  
                    /**  
                     * X轴坐标配置  
                     *   
                     * @param {object} dateTimeLabelFormats x轴日期时间格式化,不用修改直接使用  
                     */  
                    xAxis:{  
                        // 如果X轴刻度是日期或时间,该配置是格式化日期及时间显示格式  
                        dateTimeLabelFormats: {  
                            second: '%Y-%m-%d<br/>%H:%M:%S',  
                            minute: '%Y-%m-%d<br/>%H:%M',  
                            hour: '%Y-%m-%d<br/>%H:%M',  
                            day: '%Y<br/>%m-%d',  
                            week: '%Y<br/>%m-%d',  
                            month: '%Y-%m',  
                            year: '%Y'  
                        }  
                    },  
  
                    /**  
                     * 数据源配置,本身是一个对象数组  
                     *   
                     * @param {string} name 数据序列的名称  
                     * @param {array} data 数据序列,是一个对象数组。data的结构:[[时间戳, 值], [时间戳, 值], [时间戳, 值], ……]  
                     */  
                    series: [{  
                            name: '数据名称',  
                            data: usdeur  
                        }]  
                });  
            });  
        </script>  
    </head>  
    <body>  
        <script src="./js/highstock/highstock.js"></script>  
        <script src="./js/highstock/modules/exporting.js"></script>  
  
        <div id="container"></div>  
    </body>  
</html>  


写评论

相关文章

上一篇:highcharts动态图表,X轴时间格式化

下一篇:jQuery源码 框架分析

评论

写评论

* 必填.

分享

栏目

赞助商


热门文章

Tag 云