? 任务背景
公司当前使用Prometheus的nginx_export监控status状态,NGINX有编译安装的,也有yum安装的。
Prometheus中并没有NGINX响应时间。leader想要获取NGINX服务响应时间,更利于发现业务流程中的瓶颈。
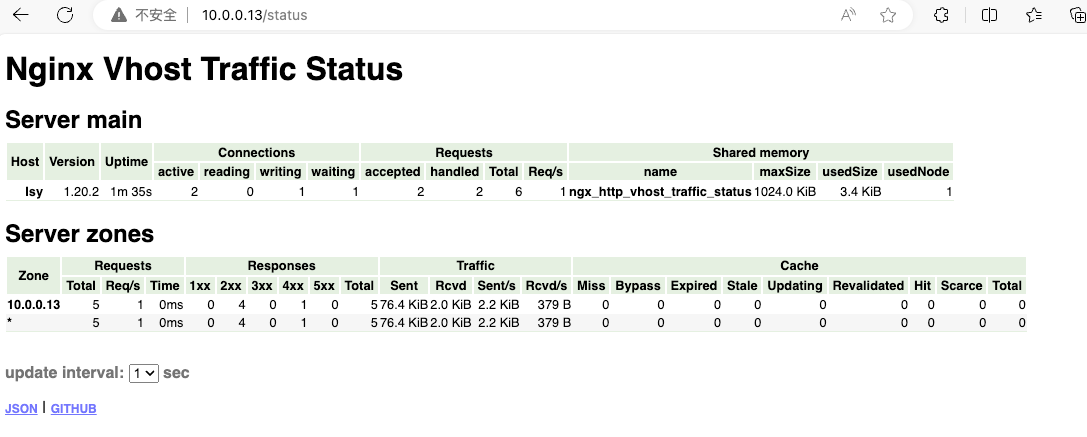
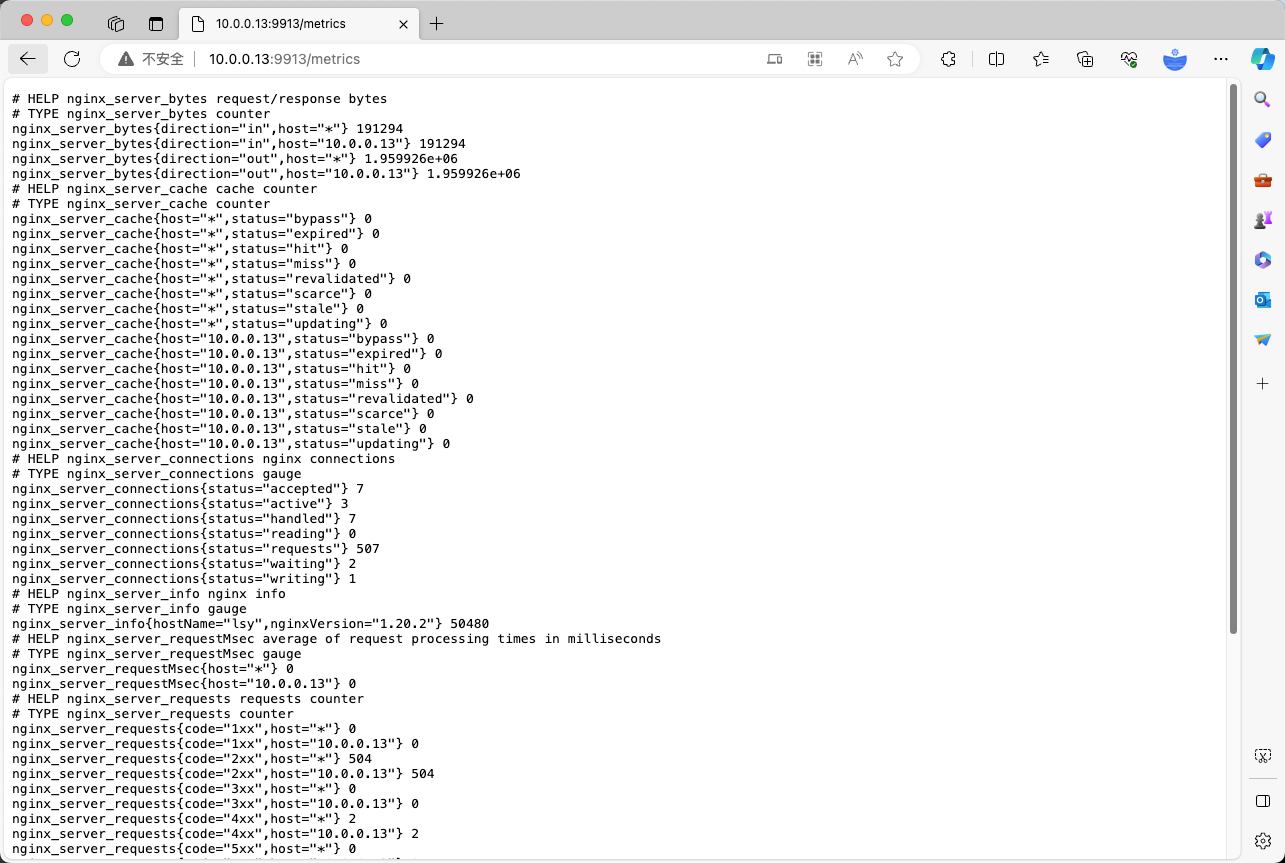
当前获取的监控数据如下

在操作之前需要明确:NGINX添加第三方模块重新编译时是否会覆盖当前配置以及编译命令是全部命令还是只需要当前添加的模块?
实验结论:
- 重新编译时不会覆盖配置文件,但为了
安心仍然建议备份配置文件 - 需要全部的编译命令
? 方案
利用NGINX的nginx-module-vts模块添加对NGINX服务的监控,并粗略认为:“请求处理时间”等于“响应速度”来实现 Prometheus监控NGINX的响应速度。
需要编译安装NGINX
参考资料
- github.com
- nginx 剖析 request_time和upstream_response_time的误区、区别-腾讯云开发者社区-腾讯云 (tencent.com)
- Dashboards | Grafana Labs
? 实验环境
IP地址:10.0.0.13
内存&CPU:2核2G
操作系统:Ubuntu 20.04.4 LTS
软件版本:nginx-1.20.2(编译安装)
?️ 实验步骤
? 环境配置
更换国内源
sudo cp /etc/apt/sources.list /etc/apt/sources.list_backup
sudo vim /etc/apt/sources.list
删除原有的内容,添加以下:
# 默认注释了源码仓库,如有需要可自行取消注释
deb https://mirrors.ustc.edu.cn/ubuntu-ports/ focal main restricted universe multiverse
# deb-src https://mirrors.ustc.edu.cn/ubuntu-ports/ focal main main restricted universe multiverse
deb https://mirrors.ustc.edu.cn/ubuntu-ports/ focal-updates main restricted universe multiverse
# deb-src https://mirrors.ustc.edu.cn/ubuntu-ports/ focal-updates main restricted universe multiverse
deb https://mirrors.ustc.edu.cn/ubuntu-ports/ focal-backports main restricted universe multiverse
# deb-src https://mirrors.ustc.edu.cn/ubuntu-ports/ focal-backports main restricted universe multiverse
deb https://mirrors.ustc.edu.cn/ubuntu-ports/ focal-security main restricted universe multiverse

sudo apt-get update
sudo apt-get upgrade
? NGINX
安装nginx
apt  install libpcre3 libpcre3-dev gcc zlib1g zlib1g-dev libssl-dev make -y
wget http://nginx.org/download/nginx-1.20.2.tar.gz
useradd nginx -M -s /sbin/nologin
tar zxvf nginx-1.20.2.tar.gz
cd nginx-1.20.2
./configure  --prefix=/etc/nginx/ --sbin-path=/usr/local/bin/ --user=nginx --group=nginx   --with-http_ssl_module --with-http_stub_status_module --with-stream --conf-path=/etc/nginx/nginx.conf  --error-log-path=/var/log/nginx/error.log --http-log-path=/var/log/nginx/access.log --pid-path=/var/run/nginx.pid
make && make install

cat >/etc/systemd/system/nginx.service<<EOF
[Unit]
Description=The NGINX HTTP and reverse proxy server
After=network.target remote-fs.target nss-lookup.target

[Service]
Type=forking
PIDFile=/var/run/nginx.pid
ExecStartPre=/usr/local/bin/nginx -t
ExecStart=/usr/local/bin/nginx
ExecReload=/usr/local/bin/nginx -s reload
ExecStop=/bin/kill -s QUIT $MAINPID
PrivateTmp=true

[Install]
WantedBy=multi-user.target
EOF
systemctl daemon-reload
systemctl restart nginx.service
systemctl enable nginx.service
修改配置文件,对比添加编译后配置文件是否会更改
vim /etc/nginx/nginx.conf
# 在http{}外增加
stream {
    upstream logstash {
        server 127.0.0.1:5044            max_fails=3 fail_timeout=30s;
    }

    server {
        listen 5045;
        proxy_connect_timeout 1s;
        proxy_timeout 3s;
        proxy_pass logstash;
    }
}
添加模块nginx-module-vts-master
我尝试了单独编译新增加的模块./configure --add-module=/usr/local/nginx-module-vts
它并不能生效,必须结合之前的编译参数进行重新编译。
# 下载模块
git clone https://gitee.com/ludeng/nginx-module-vts.git
# git clone https://github.com/vozlt/nginx-module-vts.git
mv nginx-module-vts /usr/local/
# 重新编译
./configure --prefix=/etc/nginx/ --sbin-path=/usr/local/bin/ --user=nginx --group=nginx   --with-http_ssl_module --with-http_stub_status_module --with-stream --conf-path=/etc/nginx/nginx.conf  --error-log-path=/var/log/nginx/error.log --http-log-path=/var/log/nginx/access.log --pid-path=/var/run/nginx.pid  --add-module=/usr/local/nginx-module-vts
make && make install
添加status
# vim /etc/nginx/nginx.conf
http {
		# 开启基础监控
    vhost_traffic_status_zone;
    # 开启此功能,会根据不同的server_name进行流量的统计,否则默认会把流量全部计算到第一个上。
    vhost_traffic_status_filter_by_host on;
    # 开启详细状态码统计
    vhost_traffic_status_filter on;
		vhost_traffic_status_filter_by_set_key $status $server_name;
		# 开启URL统计
		vhost_traffic_status_filter on;
		vhost_traffic_status_filter_by_set_key $uri uris::$server_name;
    ...
    server {
        ...
        location /status {
            vhost_traffic_status_display;
            vhost_traffic_status_display_format html;
        }
    }
}

systemctl restart nginx
如何获取之前的编译参数
root@lsy:~/nginx-1.20.2# nginx  -V
nginx version: nginx/1.20.2
built by gcc 9.4.0 (Ubuntu 9.4.0-1ubuntu1~20.04.2)
built with OpenSSL 1.1.1f  31 Mar 2020
TLS SNI support enabled
configure arguments: --prefix=/etc/nginx/ --sbin-path=/usr/local/bin/ --user=nginx --group=nginx --with-http_ssl_module --with-http_stub_status_module --with-stream --conf-path=/etc/nginx/nginx.conf --error-log-path=/var/log/nginx/error.log --http-log-path=/var/log/nginx/access.log --pid-path=/var/run/nginx.pid --add-module=/usr/local/nginx-module-vts
访问status
☢️ Prometheus
安装prometheus-server
wget https://github.com/prometheus/prometheus/releases/download/v2.45.0/prometheus-2.45.0.linux-arm64.tar.gz --no-check-certificate
tar -zvxf  prometheus-2.45.0.linux-arm64.tar.gz

cat > /etc/systemd/system/prometheus.service << EOF
[Unit]
Description=Prometheus
Documentation=https://prometheus.io/
After=network.target
[Service]
ExecStart=/root/prometheus-2.45.0.linux-arm64/prometheus --config.file=/root/prometheus-2.45.0.linux-arm64/prometheus.yml --storage.tsdb.path=/root/prometheus-2.45.0.linux-arm64/data --web.listen-address=0.0.0.0:9090
WorkingDirectory=/root/prometheus-2.45.0.linux-arm64/
Restart=on-failure
[Install]
WantedBy=multi-user.target
EOF

systemctl daemon-reload
systemctl start prometheus
systemctl enable prometheus
systemctl restart prometheus
systemctl status prometheus
安装nginx-vtx-exporter
vozlt/nginx-module-vts: Nginx 虚拟主机流量状态模块 (github.com)
wget https://github.com/hnlq715/nginx-vts-exporter/releases/download/v0.10.8/nginx-vtx-exporter_0.10.8_linux_arm64.tar.gz

tar -zxvf nginx-vtx-exporter_0.10.8_linux_arm64.tar.gz
mv nginx-vtx-exporter /usr/local/nginx-vts-exporter

cat > /usr/lib/systemd/system/nginx_vts_exporter.service << EOF
[Unit]
Description=prometheus_nginx_vts
After=network.target
[Service]
Type=simple
ExecStart=/usr/local/nginx-vts-exporter  -nginx.scrape_uri http://10.0.0.13/status/format/json
Restart=on-failure
[Install]
WantedBy=multi-user.target
EOF

systemctl daemon-reload
systemctl enable  nginx_vts_exporter
systemctl start  nginx_vts_exporter
systemctl status  nginx_vts_exporter
配置Prometheus
cat prometheus.yml
scrape_configs:
  - job_name: "nginx"
    static_configs:
      - targets: ["localhost:9913"]
 # 重启服务
systemctl restart prometheus
systemctl status prometheus
? Grafana
添加grafana面板
sudo apt-get install -y adduser libfontconfig1 musl
wget https://dl.grafana.com/enterprise/release/grafana-enterprise_10.2.0_arm64.deb
sudo dpkg -i grafana-enterprise_10.2.0_arm64.deb

sudo /bin/systemctl daemon-reload
sudo /bin/systemctl enable grafana-server
sudo /bin/systemctl start grafana-server
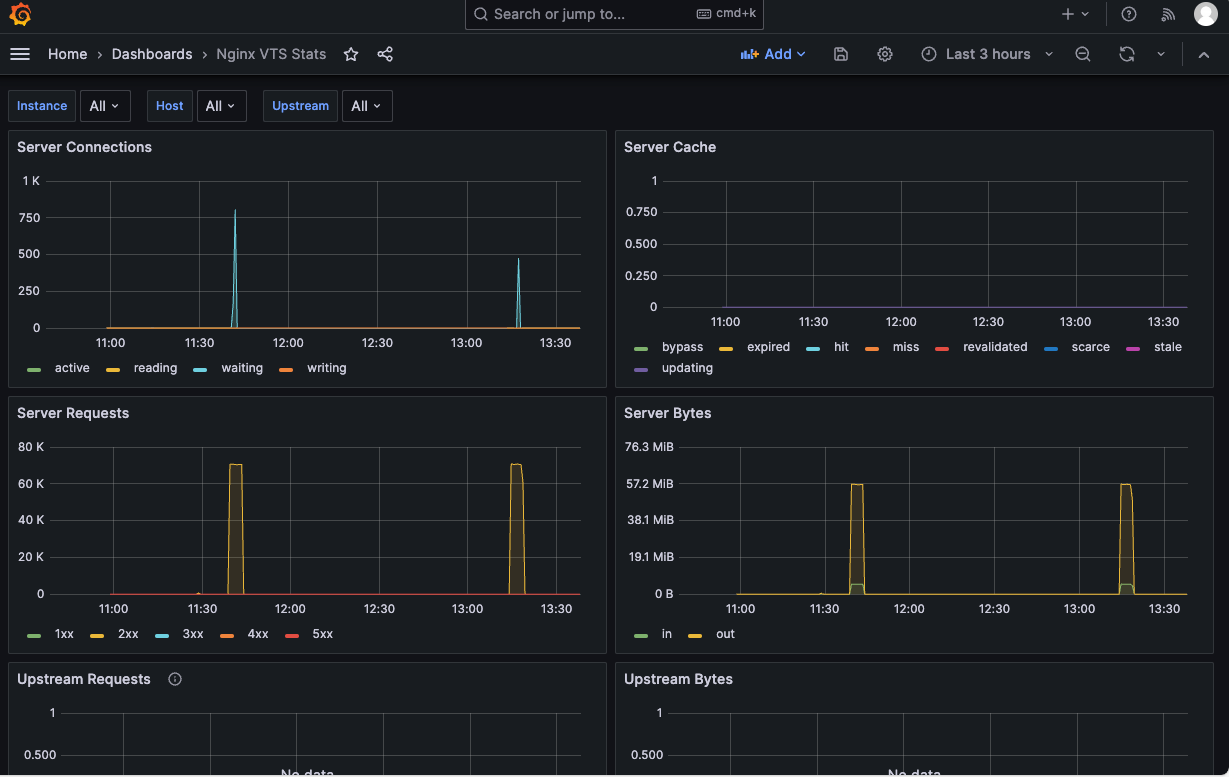
导入面板
2949
压测工具
apt install apache2-utils
ab -c 100 -n 1000 http://10.0.0.13/
整个流程我们已经设置完毕,但是导入的面板2949 中并没有看到NGINX的响应时间。
nginx_server_requestMsec{host="*"} 0
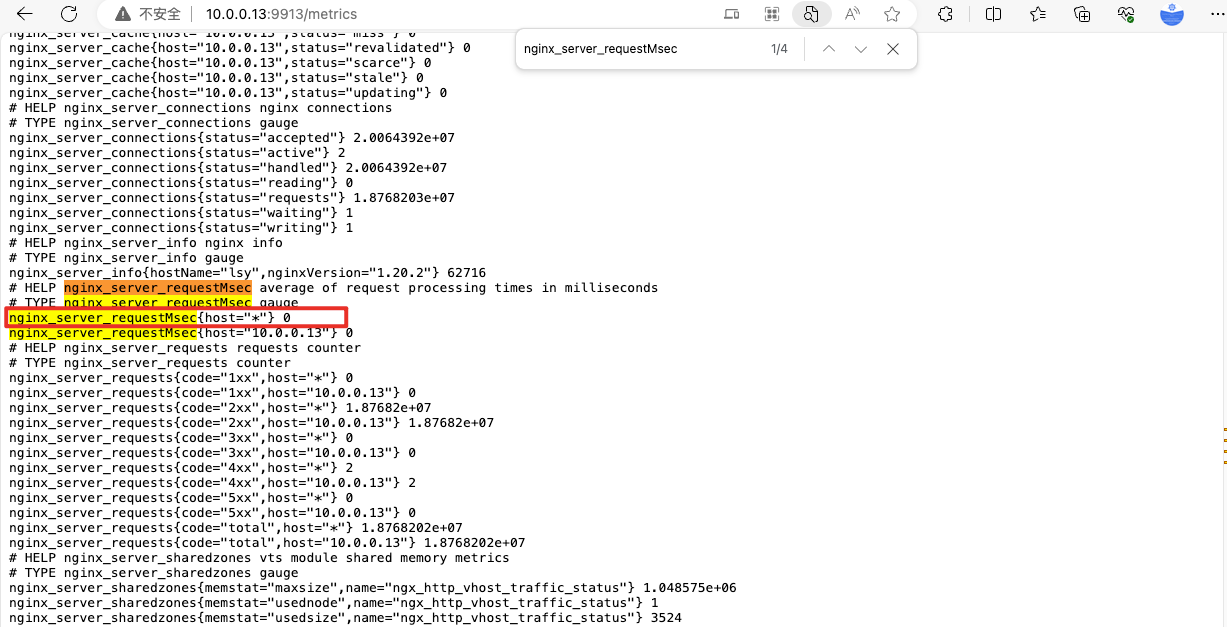
该指标正是我们需要的NGINX响应速度。vozlt/nginx-module-vts: Nginx 虚拟主机流量状态模块 (github.com)的解释是:请求处理时间的平均数
因为我们是使用NGINX作为代理,我的理解是可以将“请求处理时间”等于“响应速度”。
从面板2949中复制一个图形并修改成我们需要的请求处理时间,如下图
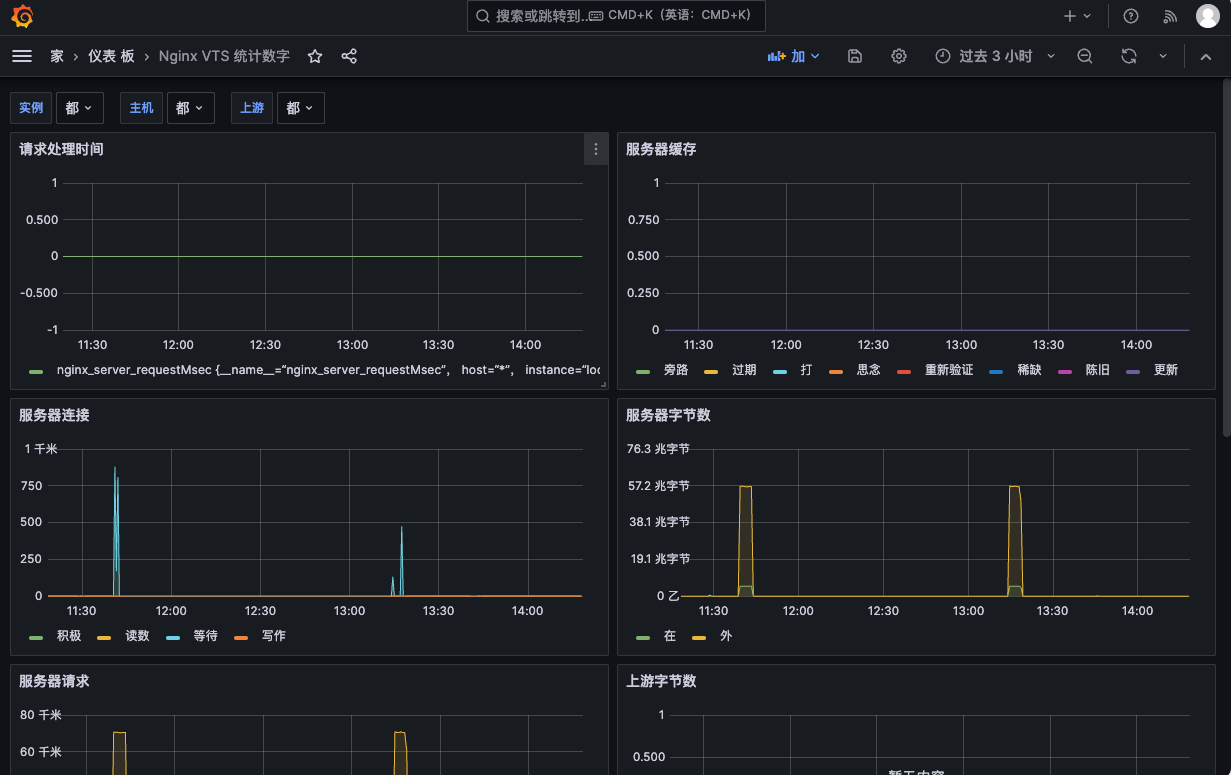
表达式:nginx_server_requestMsec{host="*"}
?️ 总结
回想一下,在学习Prometheus监控时看过很多文档,也从bilibili上看过相关教程。学习NGINX的时候也学习过status监控NGINX状态的指标,好像从没有关注过NGINX的响应速度?
关于nginx_server_requestMsec指标的含义我参考的是GitHub上nginx_server_requestMsec作者的解释,简单认为 “请求处理时间”等于“响应速度” 。关于这一点请参考:nginx 剖析 request_time和upstream_response_time的误区、区别-腾讯云开发者社区-腾讯云 (tencent.com)
我个人的理解:无论NGINX是作为代理转发使用,还是作为网站服务使用,当它在响应时获取不到后端的接口或前端要展示的js css文件时,它在页面上的效果是转圈,也就是响应速度变慢。
所以也就意味着 “请求处理时间”等于“响应速度”,并且 “请求处理时间”长 并一定是NGINX的问题。