Graph & Paper
Paper 是渲染我们提供的数据的,表示一个视图层。图形的逻辑在 Graph 中操作。
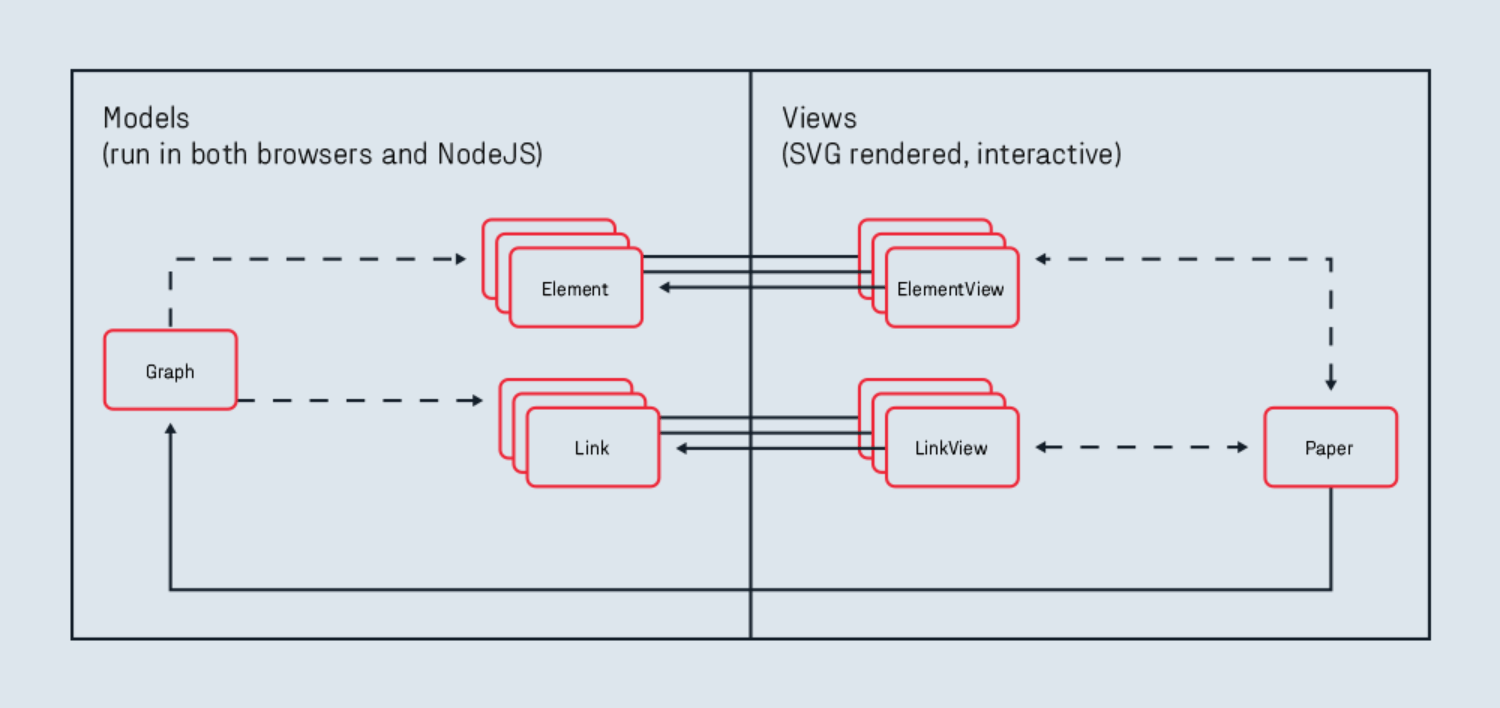
Element,以及 Link 就是一个图表中的基本形式,元素(图形)和线条(Link),JointJS 渲染的结果不是 Canvas,而是 SVG。
const graph = new joint.dia.Graph({}, { cellNamespace: joint.shapes });
const paper = new joint.dia.Paper({
  el: document.getElementById("myholder"),
  model: graph,
  width: window.innerWidth - 100,
  height: window.innerHeight - 100,
  cellViewNamespace: joint.shapes,
  gridSize: 10,
  drawGrid: true,
  background: {
    color: "rgba(0, 255, 0, 0.3)"
  }
});
以上就创建好了一个 Graph 和 Paper,Paper 就是实际的 HTML 中的一个容器,因此 el 指定一个 div 容器作为 Paper。
添加图形
const rect1 = new joint.shapes.standard.Rectangle();
rect1.position(100, 30);
rect1.resize(100, 40);
rect1.attr({
  body: {
    fill: "blue"
  },
  label: {
    text: "Hello",
    fill: "white"
  }
});
// rect.addTo(graph);

const rect2 = rect1.clone();
rect2.translate(300, 0);
rect2.attr("label/text", "World!");
// rect.addTo(graph);

const link = new joint.shapes.standard.Link();
link.source(rect1);
link.target(rect2);

graph.addCells(rect1, rect2, link);
- 通过
rect1.clone()可以克隆一个图形。 - 通过
graph.addCells添加这些图形到 Graph 中,也可以通过图形的addTo函数添加到 Graph 中。