3种方式自定义Matplotlib的属性和样式
1. 运行时通过rcParams字典动态设置
2. 使用样式表
3. 更改 matplotlibrc 文件
在运行时设置 rcParams 优先于样式表、样式 工作表优先于文件matplotlibrc即1>2>3
1. 运行时通过rcParams字典动态设置
通过字典matplotlib.rcParams,动态修改Matplotlib的默认值。
参考官网:matplotlib — Matplotlib 3.8.2 documentation
The list of rcParams is:
-
_internal.classic_mode
-
agg.path.chunksize
-
animation.bitrate
-
animation.codec
-
animation.convert_args
-
animation.convert_path
-
animation.embed_limit
-
animation.ffmpeg_args
-
animation.ffmpeg_path
-
animation.frame_format
-
animation.html
-
animation.writer
-
axes.autolimit_mode
-
axes.axisbelow
-
axes.edgecolor
-
axes.facecolor
-
axes.formatter.limits
-
axes.formatter.min_exponent
-
axes.formatter.offset_threshold
-
axes.formatter.use_locale
-
axes.formatter.use_mathtext
-
axes.formatter.useoffset
-
axes.grid
-
axes.grid.axis
-
axes.grid.which
-
axes.labelcolor
-
axes.labelpad
-
axes.labelsize
-
axes.labelweight
-
axes.linewidth
-
axes.prop_cycle
-
axes.spines.bottom
-
axes.spines.left
-
axes.spines.right
-
axes.spines.top
-
axes.titlecolor
-
axes.titlelocation
-
axes.titlepad
-
axes.titlesize
-
axes.titleweight
-
axes.titley
-
axes.unicode_minus
-
axes.xmargin
-
axes.ymargin
-
axes.zmargin
-
axes3d.grid
-
axes3d.xaxis.panecolor
-
axes3d.yaxis.panecolor
-
axes3d.zaxis.panecolor
-
backend
-
backend_fallback
-
boxplot.bootstrap
-
boxplot.boxprops.color
-
boxplot.boxprops.linestyle
-
boxplot.boxprops.linewidth
-
boxplot.capprops.color
-
boxplot.capprops.linestyle
-
boxplot.capprops.linewidth
-
boxplot.flierprops.color
-
boxplot.flierprops.linestyle
-
boxplot.flierprops.linewidth
-
boxplot.flierprops.marker
-
boxplot.flierprops.markeredgecolor
-
boxplot.flierprops.markeredgewidth
-
boxplot.flierprops.markerfacecolor
-
boxplot.flierprops.markersize
-
boxplot.meanline
-
boxplot.meanprops.color
-
boxplot.meanprops.linestyle
-
boxplot.meanprops.linewidth
-
boxplot.meanprops.marker
-
boxplot.meanprops.markeredgecolor
-
boxplot.meanprops.markerfacecolor
-
boxplot.meanprops.markersize
-
boxplot.medianprops.color
-
boxplot.medianprops.linestyle
-
boxplot.medianprops.linewidth
-
boxplot.notch
-
boxplot.patchartist
-
boxplot.showbox
-
boxplot.showcaps
-
boxplot.showfliers
-
boxplot.showmeans
-
boxplot.vertical
-
boxplot.whiskerprops.color
-
boxplot.whiskerprops.linestyle
-
boxplot.whiskerprops.linewidth
-
boxplot.whiskers
-
contour.algorithm
-
contour.corner_mask
-
contour.linewidth
-
contour.negative_linestyle
-
date.autoformatter.day
-
date.autoformatter.hour
-
date.autoformatter.microsecond
-
date.autoformatter.minute
-
date.autoformatter.month
-
date.autoformatter.second
-
date.autoformatter.year
-
date.converter
-
date.epoch
-
date.interval_multiples
-
docstring.hardcopy
-
errorbar.capsize
-
figure.autolayout
-
figure.constrained_layout.h_pad
-
figure.constrained_layout.hspace
-
figure.constrained_layout.use
-
figure.constrained_layout.w_pad
-
figure.constrained_layout.wspace
-
figure.dpi
-
figure.edgecolor
-
figure.facecolor
-
figure.figsize
-
figure.frameon
-
figure.hooks
-
figure.labelsize
-
figure.labelweight
-
figure.max_open_warning
-
figure.raise_window
-
figure.subplot.bottom
-
figure.subplot.hspace
-
figure.subplot.left
-
figure.subplot.right
-
figure.subplot.top
-
figure.subplot.wspace
-
figure.titlesize
-
figure.titleweight
-
font.cursive
-
font.family
-
font.fantasy
-
font.monospace
-
font.sans-serif
-
font.serif
-
font.size
-
font.stretch
-
font.style
-
font.variant
-
font.weight
-
grid.alpha
-
grid.color
-
grid.linestyle
-
grid.linewidth
-
hatch.color
-
hatch.linewidth
-
hist.bins
-
image.aspect
-
image.cmap
-
image.composite_image
-
image.interpolation
-
image.lut
-
image.origin
-
image.resample
-
interactive
-
keymap.back
-
keymap.copy
-
keymap.forward
-
keymap.fullscreen
-
keymap.grid
-
keymap.grid_minor
-
keymap.help
-
keymap.home
-
keymap.pan
-
keymap.quit
-
keymap.quit_all
-
keymap.save
-
keymap.xscale
-
keymap.yscale
-
keymap.zoom
-
legend.borderaxespad
-
legend.borderpad
-
legend.columnspacing
-
legend.edgecolor
-
legend.facecolor
-
legend.fancybox
-
legend.fontsize
-
legend.framealpha
-
legend.frameon
-
legend.handleheight
-
legend.handlelength
-
legend.handletextpad
-
legend.labelcolor
-
legend.labelspacing
-
legend.loc
-
legend.markerscale
-
legend.numpoints
-
legend.scatterpoints
-
legend.shadow
-
legend.title_fontsize
-
lines.antialiased
-
lines.color
-
lines.dash_capstyle
-
lines.dash_joinstyle
-
lines.dashdot_pattern
-
lines.dashed_pattern
-
lines.dotted_pattern
-
lines.linestyle
-
lines.linewidth
-
lines.marker
-
lines.markeredgecolor
-
lines.markeredgewidth
-
lines.markerfacecolor
-
lines.markersize
-
lines.scale_dashes
-
lines.solid_capstyle
-
lines.solid_joinstyle
-
macosx.window_mode
-
markers.fillstyle
-
mathtext.bf
-
mathtext.bfit
-
mathtext.cal
-
mathtext.default
-
mathtext.fallback
-
mathtext.fontset
-
mathtext.it
-
mathtext.rm
-
mathtext.sf
-
mathtext.tt
-
patch.antialiased
-
patch.edgecolor
-
patch.facecolor
-
patch.force_edgecolor
-
patch.linewidth
-
path.effects
-
path.simplify
-
path.simplify_threshold
-
path.sketch
-
path.snap
-
pcolor.shading
-
pcolormesh.snap
-
pdf.compression
-
pdf.fonttype
-
pdf.inheritcolor
-
pdf.use14corefonts
-
pgf.preamble
-
pgf.rcfonts
-
pgf.texsystem
-
polaraxes.grid
-
ps.distiller.res
-
ps.fonttype
-
ps.papersize
-
ps.useafm
-
ps.usedistiller
-
savefig.bbox
-
savefig.directory
-
savefig.dpi
-
savefig.edgecolor
-
savefig.facecolor
-
savefig.format
-
savefig.orientation
-
savefig.pad_inches
-
savefig.transparent
-
scatter.edgecolors
-
scatter.marker
-
svg.fonttype
-
svg.hashsalt
-
svg.image_inline
-
text.antialiased
-
text.color
-
text.hinting
-
text.hinting_factor
-
text.kerning_factor
-
text.latex.preamble
-
text.parse_math
-
text.usetex
-
timezone
-
tk.window_focus
-
toolbar
-
webagg.address
-
webagg.open_in_browser
-
webagg.port
-
webagg.port_retries
-
xaxis.labellocation
-
xtick.alignment
-
xtick.bottom
-
xtick.color
-
xtick.direction
-
xtick.labelbottom
-
xtick.labelcolor
-
xtick.labelsize
-
xtick.labeltop
-
xtick.major.bottom
-
xtick.major.pad
-
xtick.major.size
-
xtick.major.top
-
xtick.major.width
-
xtick.minor.bottom
-
xtick.minor.ndivs
-
xtick.minor.pad
-
xtick.minor.size
-
xtick.minor.top
-
xtick.minor.visible
-
xtick.minor.width
-
xtick.top
-
yaxis.labellocation
-
ytick.alignment
-
ytick.color
-
ytick.direction
-
ytick.labelcolor
-
ytick.labelleft
-
ytick.labelright
-
ytick.labelsize
-
ytick.left
-
ytick.major.left
-
ytick.major.pad
-
ytick.major.right
-
ytick.major.size
-
ytick.major.width
-
ytick.minor.left
-
ytick.minor.ndivs
-
ytick.minor.pad
-
ytick.minor.right
-
ytick.minor.size
-
ytick.minor.visible
-
ytick.minor.width
-
ytick.right
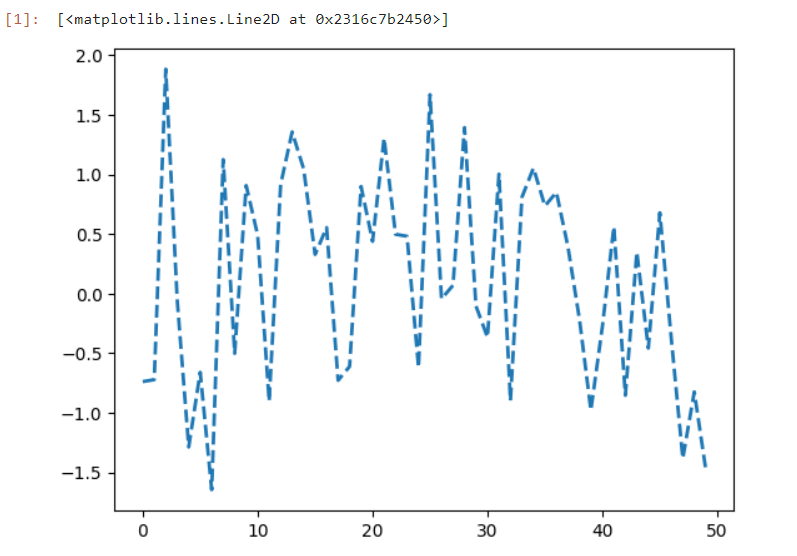
示例
from cycler import cycler

import matplotlib.pyplot as plt
import numpy as np

import matplotlib as mpl

mpl.rcParams['lines.linewidth'] = 2
mpl.rcParams['lines.linestyle'] = '--'
data = np.random.randn(50)
plt.plot(data)
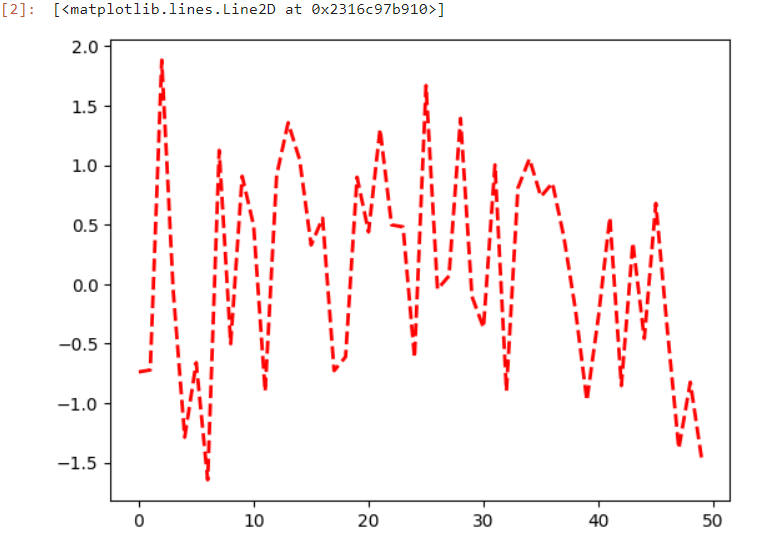
修改后:
mpl.rcParams['axes.prop_cycle'] = cycler(color=['r', 'g', 'b', 'y'])
plt.plot(data)  # first color is red
临时 rc 设置
可通过matplotlib.rc_context即上下文管理器临时改变rcParams
with mpl.rc_context({'lines.linewidth': 2, 'lines.linestyle': ':'}):
    plt.plot(data)
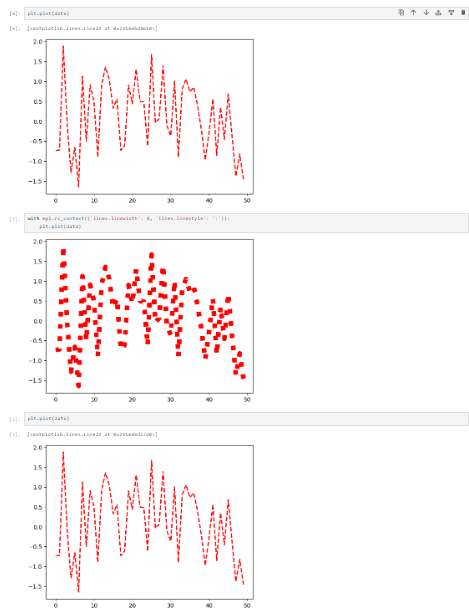
第1张与第3张一样,说明第2张的改变是临时的。
也可以作为装饰器来修改 函数中的默认值。
@mpl.rc_context({'lines.linewidth': 3, 'lines.linestyle': '-'})
def plotting_function():
    plt.plot(data)

plotting_function()
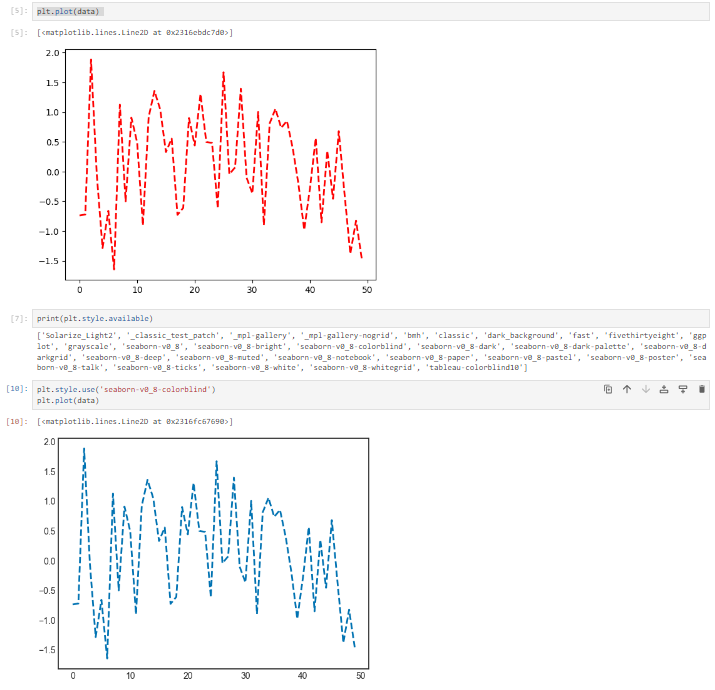
使用样式表
matplotlib预置了一下样式表,可通过如下代码导入
plt.style.use('ggplot')
可通过此命令列车所有样式表:
print(plt.style.available)

也可以自定义自己风格的样式表:
您可以创建自定义样式,并通过调用样式表的路径或 URL实现。
例如:创建文件./images/presentation.mplstyle,内容如下:
axes.titlesize : 24
axes.labelsize : 20
lines.linewidth : 3
lines.markersize : 10
xtick.labelsize : 16
ytick.labelsize : 16
使用:
import matplotlib.pyplot as plt
plt.style.use('./images/presentation.mplstyle')
其他参考:使用样式表和 rcParams 自定义 Matplotlib — Matplotlib 3.8.2 文档
更改 matplotlibrc 文件
Matplotlib 使用配置文件自定义所有 各种属性,我们称之为“RC 设置”或“RC 参数”。您可以 控制 Matplotlib 中几乎所有属性的默认值:图形大小和 DPI、线宽、颜色和样式、轴、轴和网格属性、文本和 字体属性等。在启动时读取到 配置 Matplotlib。Matplotlib 在四个中寻找 位置,按以下顺序排列:matplotlibrcmatplotlibrcmatplotlibrc
-
matplotlibrc在当前工作目录中,通常用于 您不希望在其他地方应用的特定自定义项。 -
$MATPLOTLIBRC如果是文件,则为 .$MATPLOTLIBRC/matplotlibrc -
接下来,它会在特定于用户的位置进行查找,具体取决于您的平台:
-
在 Linux 和 FreeBSD 上,如果您自定义了,它会在(或)中查找 您的环境。
.config/matplotlib/matplotlibrc$XDG_CONFIG_HOME/matplotlib/matplotlibrc -
在其他平台上,它会在 .
.matplotlib/matplotlibrc
请参阅 matplotlib 配置和缓存目录位置。
-
-
INSTALL/matplotlib/mpl-data/matplotlibrc,在 Linux 上,也许在 Windows 上。每次你 安装 matplotlib,这个文件将被覆盖,所以如果你愿意 要保存的自定义项,请将此文件移动到 特定于用户的 matplotlib 目录。INSTALL/usr/lib/python3.9/site-packagesC:\Python39\Lib\site-packages
一旦找到文件,它就不会搜索 任何其他路径。当样式表中指定了 的设置时 样式表优先于文件中的设置。matplotlibrcstyle.use('<path>/<style-name>.mplstyle')matplotlibrc
显示当前活动文件的位置 加载自,可以执行以下操作:matplotlibrc
import matplotlib
matplotlib.matplotlib_fname()

matplotlibrc文件内容:
#### MATPLOTLIBRC FORMAT ## NOTE FOR END USERS: DO NOT EDIT THIS FILE! ## ## This is a sample Matplotlib configuration file - you can find a copy ## of it on your system in site-packages/matplotlib/mpl-data/matplotlibrc ## (relative to your Python installation location). ## DO NOT EDIT IT! ## ## If you wish to change your default style, copy this file to one of the ## following locations: ## Unix/Linux: ## $HOME/.config/matplotlib/matplotlibrc OR ## $XDG_CONFIG_HOME/matplotlib/matplotlibrc (if $XDG_CONFIG_HOME is set) ## Other platforms: ## $HOME/.matplotlib/matplotlibrc ## and edit that copy. ## ## See https://matplotlib.org/stable/users/explain/customizing.html#customizing-with-matplotlibrc-files ## for more details on the paths which are checked for the configuration file. ## ## Blank lines, or lines starting with a comment symbol, are ignored, as are ## trailing comments. Other lines must have the format: ## key: val # optional comment ## ## Formatting: Use PEP8-like style (as enforced in the rest of the codebase). ## All lines start with an additional '#', so that removing all leading '#'s ## yields a valid style file. ## ## Colors: for the color values below, you can either use ## - a Matplotlib color string, such as r, k, or b ## - an RGB tuple, such as (1.0, 0.5, 0.0) ## - a double-quoted hex string, such as "#ff00ff". ## The unquoted string ff00ff is also supported for backward ## compatibility, but is discouraged. ## - a scalar grayscale intensity such as 0.75 ## - a legal html color name, e.g., red, blue, darkslategray ## ## String values may optionally be enclosed in double quotes, which allows ## using the comment character # in the string. ## ## This file (and other style files) must be encoded as utf-8. ## ## Matplotlib configuration are currently divided into following parts: ## - BACKENDS ## - LINES ## - PATCHES ## - HATCHES ## - BOXPLOT ## - FONT ## - TEXT ## - LaTeX ## - AXES ## - DATES ## - TICKS ## - GRIDS ## - LEGEND ## - FIGURE ## - IMAGES ## - CONTOUR PLOTS ## - ERRORBAR PLOTS ## - HISTOGRAM PLOTS ## - SCATTER PLOTS ## - AGG RENDERING ## - PATHS ## - SAVING FIGURES ## - INTERACTIVE KEYMAPS ## - ANIMATION ##### CONFIGURATION BEGINS HERE ## *************************************************************************** ## * BACKENDS * ## *************************************************************************** ## The default backend. If you omit this parameter, the first working ## backend from the following list is used: ## MacOSX QtAgg Gtk4Agg Gtk3Agg TkAgg WxAgg Agg ## Other choices include: ## QtCairo GTK4Cairo GTK3Cairo TkCairo WxCairo Cairo ## Qt5Agg Qt5Cairo Wx # deprecated. ## PS PDF SVG Template ## You can also deploy your own backend outside of Matplotlib by referring to ## the module name (which must be in the PYTHONPATH) as 'module://my_backend'. ##backend: Agg ## The port to use for the web server in the WebAgg backend. #webagg.port: 8988 ## The address on which the WebAgg web server should be reachable #webagg.address: 127.0.0.1 ## If webagg.port is unavailable, a number of other random ports will ## be tried until one that is available is found. #webagg.port_retries: 50 ## When True, open the web browser to the plot that is shown #webagg.open_in_browser: True ## If you are running pyplot inside a GUI and your backend choice ## conflicts, we will automatically try to find a compatible one for ## you if backend_fallback is True #backend_fallback: True #interactive: False #figure.hooks: # list of dotted.module.name:dotted.callable.name #toolbar: toolbar2 # {None, toolbar2, toolmanager} #timezone: UTC # a pytz timezone string, e.g., US/Central or Europe/Paris ## *************************************************************************** ## * LINES * ## *************************************************************************** ## See https://matplotlib.org/stable/api/artist_api.html#module-matplotlib.lines ## for more information on line properties. #lines.linewidth: 1.5 # line width in points #lines.linestyle: - # solid line #lines.color: C0 # has no affect on plot(); see axes.prop_cycle #lines.marker: None # the default marker #lines.markerfacecolor: auto # the default marker face color #lines.markeredgecolor: auto # the default marker edge color #lines.markeredgewidth: 1.0 # the line width around the marker symbol #lines.markersize: 6 # marker size, in points #lines.dash_joinstyle: round # {miter, round, bevel} #lines.dash_capstyle: butt # {butt, round, projecting} #lines.solid_joinstyle: round # {miter, round, bevel} #lines.solid_capstyle: projecting # {butt, round, projecting} #lines.antialiased: True # render lines in antialiased (no jaggies) ## The three standard dash patterns. These are scaled by the linewidth. #lines.dashed_pattern: 3.7, 1.6 #lines.dashdot_pattern: 6.4, 1.6, 1, 1.6 #lines.dotted_pattern: 1, 1.65 #lines.scale_dashes: True #markers.fillstyle: full # {full, left, right, bottom, top, none} #pcolor.shading: auto #pcolormesh.snap: True # Whether to snap the mesh to pixel boundaries. This is # provided solely to allow old test images to remain # unchanged. Set to False to obtain the previous behavior. ## *************************************************************************** ## * PATCHES * ## *************************************************************************** ## Patches are graphical objects that fill 2D space, like polygons or circles. ## See https://matplotlib.org/stable/api/artist_api.html#module-matplotlib.patches ## for more information on patch properties. #patch.linewidth: 1.0 # edge width in points. #patch.facecolor: C0 #patch.edgecolor: black # if forced, or patch is not filled #patch.force_edgecolor: False # True to always use edgecolor #patch.antialiased: True # render patches in antialiased (no jaggies) ## *************************************************************************** ## * HATCHES * ## *************************************************************************** #hatch.color: black #hatch.linewidth: 1.0 ## *************************************************************************** ## * BOXPLOT * ## *************************************************************************** #boxplot.notch: False #boxplot.vertical: True #boxplot.whiskers: 1.5 #boxplot.bootstrap: None #boxplot.patchartist: False #boxplot.showmeans: False #boxplot.showcaps: True #boxplot.showbox: True #boxplot.showfliers: True #boxplot.meanline: False #boxplot.flierprops.color: black #boxplot.flierprops.marker: o #boxplot.flierprops.markerfacecolor: none #boxplot.flierprops.markeredgecolor: black #boxplot.flierprops.markeredgewidth: 1.0 #boxplot.flierprops.markersize: 6 #boxplot.flierprops.linestyle: none #boxplot.flierprops.linewidth: 1.0 #boxplot.boxprops.color: black #boxplot.boxprops.linewidth: 1.0 #boxplot.boxprops.linestyle: - #boxplot.whiskerprops.color: black #boxplot.whiskerprops.linewidth: 1.0 #boxplot.whiskerprops.linestyle: - #boxplot.capprops.color: black #boxplot.capprops.linewidth: 1.0 #boxplot.capprops.linestyle: - #boxplot.medianprops.color: C1 #boxplot.medianprops.linewidth: 1.0 #boxplot.medianprops.linestyle: - #boxplot.meanprops.color: C2 #boxplot.meanprops.marker: ^ #boxplot.meanprops.markerfacecolor: C2 #boxplot.meanprops.markeredgecolor: C2 #boxplot.meanprops.markersize: 6 #boxplot.meanprops.linestyle: -- #boxplot.meanprops.linewidth: 1.0 ## *************************************************************************** ## * FONT * ## *************************************************************************** ## The font properties used by `text.Text`. ## See https://matplotlib.org/stable/api/font_manager_api.html for more information ## on font properties. The 6 font properties used for font matching are ## given below with their default values. ## ## The font.family property can take either a single or multiple entries of any ## combination of concrete font names (not supported when rendering text with ## usetex) or the following five generic values: ## - 'serif' (e.g., Times), ## - 'sans-serif' (e.g., Helvetica), ## - 'cursive' (e.g., Zapf-Chancery), ## - 'fantasy' (e.g., Western), and ## - 'monospace' (e.g., Courier). ## Each of these values has a corresponding default list of font names ## (font.serif, etc.); the first available font in the list is used. Note that ## for font.serif, font.sans-serif, and font.monospace, the first element of ## the list (a DejaVu font) will always be used because DejaVu is shipped with ## Matplotlib and is thus guaranteed to be available; the other entries are ## left as examples of other possible values. ## ## The font.style property has three values: normal (or roman), italic ## or oblique. The oblique style will be used for italic, if it is not ## present. ## ## The font.variant property has two values: normal or small-caps. For ## TrueType fonts, which are scalable fonts, small-caps is equivalent ## to using a font size of 'smaller', or about 83 % of the current font ## size. ## ## The font.weight property has effectively 13 values: normal, bold, ## bolder, lighter, 100, 200, 300, ..., 900. Normal is the same as ## 400, and bold is 700. bolder and lighter are relative values with ## respect to the current weight. ## ## The font.stretch property has 11 values: ultra-condensed, ## extra-condensed, condensed, semi-condensed, normal, semi-expanded, ## expanded, extra-expanded, ultra-expanded, wider, and narrower. This ## property is not currently implemented. ## ## The font.size property is the default font size for text, given in points. ## 10 pt is the standard value. ## ## Note that font.size controls default text sizes. To configure ## special text sizes tick labels, axes, labels, title, etc., see the rc ## settings for axes and ticks. Special text sizes can be defined ## relative to font.size, using the following values: xx-small, x-small, ## small, medium, large, x-large, xx-large, larger, or smaller #font.family: sans-serif #font.style: normal #font.variant: normal #font.weight: normal #font.stretch: normal #font.size: 10.0 #font.serif: DejaVu Serif, Bitstream Vera Serif, Computer Modern Roman, New Century Schoolbook, Century Schoolbook L, Utopia, ITC Bookman, Bookman, Nimbus Roman No9 L, Times New Roman, Times, Palatino, Charter, serif #font.sans-serif: DejaVu Sans, Bitstream Vera Sans, Computer Modern Sans Serif, Lucida Grande, Verdana, Geneva, Lucid, Arial, Helvetica, Avant Garde, sans-serif #font.cursive: Apple Chancery, Textile, Zapf Chancery, Sand, Script MT, Felipa, Comic Neue, Comic Sans MS, cursive #font.fantasy: Chicago, Charcoal, Impact, Western, xkcd script, fantasy #font.monospace: DejaVu Sans Mono, Bitstream Vera Sans Mono, Computer Modern Typewriter, Andale Mono, Nimbus Mono L, Courier New, Courier, Fixed, Terminal, monospace ## *************************************************************************** ## * TEXT * ## *************************************************************************** ## The text properties used by `text.Text`. ## See https://matplotlib.org/stable/api/artist_api.html#module-matplotlib.text ## for more information on text properties #text.color: black ## FreeType hinting flag ("foo" corresponds to FT_LOAD_FOO); may be one of the ## following (Proprietary Matplotlib-specific synonyms are given in parentheses, ## but their use is discouraged): ## - default: Use the font's native hinter if possible, else FreeType's auto-hinter. ## ("either" is a synonym). ## - no_autohint: Use the font's native hinter if possible, else don't hint. ## ("native" is a synonym.) ## - force_autohint: Use FreeType's auto-hinter. ("auto" is a synonym.) ## - no_hinting: Disable hinting. ("none" is a synonym.) #text.hinting: force_autohint #text.hinting_factor: 8 # Specifies the amount of softness for hinting in the # horizontal direction. A value of 1 will hint to full # pixels. A value of 2 will hint to half pixels etc. #text.kerning_factor: 0 # Specifies the scaling factor for kerning values. This # is provided solely to allow old test images to remain # unchanged. Set to 6 to obtain previous behavior. # Values other than 0 or 6 have no defined meaning. #text.antialiased: True # If True (default), the text will be antialiased. # This only affects raster outputs. #text.parse_math: True # Use mathtext if there is an even number of unescaped # dollar signs. ## *************************************************************************** ## * LaTeX * ## *************************************************************************** ## For more information on LaTeX properties, see ## https://matplotlib.org/stable/users/explain/text/usetex.html #text.usetex: False # use latex for all text handling. The following fonts # are supported through the usual rc parameter settings: # new century schoolbook, bookman, times, palatino, # zapf chancery, charter, serif, sans-serif, helvetica, # avant garde, courier, monospace, computer modern roman, # computer modern sans serif, computer modern typewriter #text.latex.preamble: # IMPROPER USE OF THIS FEATURE WILL LEAD TO LATEX FAILURES # AND IS THEREFORE UNSUPPORTED. PLEASE DO NOT ASK FOR HELP # IF THIS FEATURE DOES NOT DO WHAT YOU EXPECT IT TO. # text.latex.preamble is a single line of LaTeX code that # will be passed on to the LaTeX system. It may contain # any code that is valid for the LaTeX "preamble", i.e. # between the "\documentclass" and "\begin{document}" # statements. # Note that it has to be put on a single line, which may # become quite long. # The following packages are always loaded with usetex, # so beware of package collisions: # geometry, inputenc, type1cm. # PostScript (PSNFSS) font packages may also be # loaded, depending on your font settings. ## The following settings allow you to select the fonts in math mode. #mathtext.fontset: dejavusans # Should be 'dejavusans' (default), # 'dejavuserif', 'cm' (Computer Modern), 'stix', # 'stixsans' or 'custom' ## "mathtext.fontset: custom" is defined by the mathtext.bf, .cal, .it, ... ## settings which map a TeX font name to a fontconfig font pattern. (These ## settings are not used for other font sets.) #mathtext.bf: sans:bold #mathtext.bfit: sans:italic:bold #mathtext.cal: cursive #mathtext.it: sans:italic #mathtext.rm: sans #mathtext.sf: sans #mathtext.tt: monospace #mathtext.fallback: cm # Select fallback font from ['cm' (Computer Modern), 'stix' # 'stixsans'] when a symbol cannot be found in one of the # custom math fonts. Select 'None' to not perform fallback # and replace the missing character by a dummy symbol. #mathtext.default: it # The default font to use for math. # Can be any of the LaTeX font names, including # the special name "regular" for the same font # used in regular text. ## *************************************************************************** ## * AXES * ## *************************************************************************** ## Following are default face and edge colors, default tick sizes, ## default font sizes for tick labels, and so on. See ## https://matplotlib.org/stable/api/axes_api.html#module-matplotlib.axes #axes.facecolor: white # axes background color #axes.edgecolor: black # axes edge color #axes.linewidth: 0.8 # edge line width #axes.grid: False # display grid or not #axes.grid.axis: both # which axis the grid should apply to #axes.grid.which: major # grid lines at {major, minor, both} ticks #axes.titlelocation: center # alignment of the title: {left, right, center} #axes.titlesize: large # font size of the axes title #axes.titleweight: normal # font weight of title #axes.titlecolor: auto # color of the axes title, auto falls back to # text.color as default value #axes.titley: None # position title (axes relative units). None implies auto #axes.titlepad: 6.0 # pad between axes and title in points #axes.labelsize: medium # font size of the x and y labels #axes.labelpad: 4.0 # space between label and axis #axes.labelweight: normal # weight of the x and y labels #axes.labelcolor: black #axes.axisbelow: line # draw axis gridlines and ticks: # - below patches (True) # - above patches but below lines ('line') # - above all (False) #axes.formatter.limits: -5, 6 # use scientific notation if log10 # of the axis range is smaller than the # first or larger than the second #axes.formatter.use_locale: False # When True, format tick labels # according to the user's locale. # For example, use ',' as a decimal # separator in the fr_FR locale. #axes.formatter.use_mathtext: False # When True, use mathtext for scientific # notation. #axes.formatter.min_exponent: 0 # minimum exponent to format in scientific notation #axes.formatter.useoffset: True # If True, the tick label formatter # will default to labeling ticks relative # to an offset when the data range is # small compared to the minimum absolute # value of the data. #axes.formatter.offset_threshold: 4 # When useoffset is True, the offset # will be used when it can remove # at least this number of significant # digits from tick labels. #axes.spines.left: True # display axis spines #axes.spines.bottom: True #axes.spines.top: True #axes.spines.right: True #axes.unicode_minus: True # use Unicode for the minus symbol rather than hyphen. See # https://en.wikipedia.org/wiki/Plus_and_minus_signs#Character_codes #axes.prop_cycle: cycler('color', ['1f77b4', 'ff7f0e', '2ca02c', 'd62728', '9467bd', '8c564b', 'e377c2', '7f7f7f', 'bcbd22', '17becf']) # color cycle for plot lines as list of string color specs: # single letter, long name, or web-style hex # As opposed to all other parameters in this file, the color # values must be enclosed in quotes for this parameter, # e.g. '1f77b4', instead of 1f77b4. # See also https://matplotlib.org/stable/users/explain/artists/color_cycle.html # for more details on prop_cycle usage. #axes.xmargin: .05 # x margin. See `axes.Axes.margins` #axes.ymargin: .05 # y margin. See `axes.Axes.margins` #axes.zmargin: .05 # z margin. See `axes.Axes.margins` #axes.autolimit_mode: data # If "data", use axes.xmargin and axes.ymargin as is. # If "round_numbers", after application of margins, axis # limits are further expanded to the nearest "round" number. #polaraxes.grid: True # display grid on polar axes #axes3d.grid: True # display grid on 3D axes #axes3d.xaxis.panecolor: (0.95, 0.95, 0.95, 0.5) # background pane on 3D axes #axes3d.yaxis.panecolor: (0.90, 0.90, 0.90, 0.5) # background pane on 3D axes #axes3d.zaxis.panecolor: (0.925, 0.925, 0.925, 0.5) # background pane on 3D axes ## *************************************************************************** ## * AXIS * ## *************************************************************************** #xaxis.labellocation: center # alignment of the xaxis label: {left, right, center} #yaxis.labellocation: center # alignment of the yaxis label: {bottom, top, center} ## *************************************************************************** ## * DATES * ## *************************************************************************** ## These control the default format strings used in AutoDateFormatter. ## Any valid format datetime format string can be used (see the python ## `datetime` for details). For example, by using: ## - '%x' will use the locale date representation ## - '%X' will use the locale time representation ## - '%c' will use the full locale datetime representation ## These values map to the scales: ## {'year': 365, 'month': 30, 'day': 1, 'hour': 1/24, 'minute': 1 / (24 * 60)} #date.autoformatter.year: %Y #date.autoformatter.month: %Y-%m #date.autoformatter.day: %Y-%m-%d #date.autoformatter.hour: %m-%d %H #date.autoformatter.minute: %d %H:%M #date.autoformatter.second: %H:%M:%S #date.autoformatter.microsecond: %M:%S.%f ## The reference date for Matplotlib's internal date representation ## See https://matplotlib.org/stable/gallery/ticks/date_precision_and_epochs.html #date.epoch: 1970-01-01T00:00:00 ## 'auto', 'concise': #date.converter: auto ## For auto converter whether to use interval_multiples: #date.interval_multiples: True ## *************************************************************************** ## * TICKS * ## *************************************************************************** ## See https://matplotlib.org/stable/api/axis_api.html#matplotlib.axis.Tick #xtick.top: False # draw ticks on the top side #xtick.bottom: True # draw ticks on the bottom side #xtick.labeltop: False # draw label on the top #xtick.labelbottom: True # draw label on the bottom #xtick.major.size: 3.5 # major tick size in points #xtick.minor.size: 2 # minor tick size in points #xtick.major.width: 0.8 # major tick width in points #xtick.minor.width: 0.6 # minor tick width in points #xtick.major.pad: 3.5 # distance to major tick label in points #xtick.minor.pad: 3.4 # distance to the minor tick label in points #xtick.color: black # color of the ticks #xtick.labelcolor: inherit # color of the tick labels or inherit from xtick.color #xtick.labelsize: medium # font size of the tick labels #xtick.direction: out # direction: {in, out, inout} #xtick.minor.visible: False # visibility of minor ticks on x-axis #xtick.major.top: True # draw x axis top major ticks #xtick.major.bottom: True # draw x axis bottom major ticks #xtick.minor.top: True # draw x axis top minor ticks #xtick.minor.bottom: True # draw x axis bottom minor ticks #xtick.minor.ndivs: auto # number of minor ticks between the major ticks on x-axis #xtick.alignment: center # alignment of xticks #ytick.left: True # draw ticks on the left side #ytick.right: False # draw ticks on the right side #ytick.labelleft: True # draw tick labels on the left side #ytick.labelright: False # draw tick labels on the right side #ytick.major.size: 3.5 # major tick size in points #ytick.minor.size: 2 # minor tick size in points #ytick.major.width: 0.8 # major tick width in points #ytick.minor.width: 0.6 # minor tick width in points #ytick.major.pad: 3.5 # distance to major tick label in points #ytick.minor.pad: 3.4 # distance to the minor tick label in points #ytick.color: black # color of the ticks #ytick.labelcolor: inherit # color of the tick labels or inherit from ytick.color #ytick.labelsize: medium # font size of the tick labels #ytick.direction: out # direction: {in, out, inout} #ytick.minor.visible: False # visibility of minor ticks on y-axis #ytick.major.left: True # draw y axis left major ticks #ytick.major.right: True # draw y axis right major ticks #ytick.minor.left: True # draw y axis left minor ticks #ytick.minor.right: True # draw y axis right minor ticks #ytick.minor.ndivs: auto # number of minor ticks between the major ticks on y-axis #ytick.alignment: center_baseline # alignment of yticks ## *************************************************************************** ## * GRIDS * ## *************************************************************************** #grid.color: "#b0b0b0" # grid color #grid.linestyle: - # solid #grid.linewidth: 0.8 # in points #grid.alpha: 1.0 # transparency, between 0.0 and 1.0 ## *************************************************************************** ## * LEGEND * ## *************************************************************************** #legend.loc: best #legend.frameon: True # if True, draw the legend on a background patch #legend.framealpha: 0.8 # legend patch transparency #legend.facecolor: inherit # inherit from axes.facecolor; or color spec #legend.edgecolor: 0.8 # background patch boundary color #legend.fancybox: True # if True, use a rounded box for the # legend background, else a rectangle #legend.shadow: False # if True, give background a shadow effect #legend.numpoints: 1 # the number of marker points in the legend line #legend.scatterpoints: 1 # number of scatter points #legend.markerscale: 1.0 # the relative size of legend markers vs. original #legend.fontsize: medium #legend.labelcolor: None #legend.title_fontsize: None # None sets to the same as the default axes. ## Dimensions as fraction of font size: #legend.borderpad: 0.4 # border whitespace #legend.labelspacing: 0.5 # the vertical space between the legend entries #legend.handlelength: 2.0 # the length of the legend lines #legend.handleheight: 0.7 # the height of the legend handle #legend.handletextpad: 0.8 # the space between the legend line and legend text #legend.borderaxespad: 0.5 # the border between the axes and legend edge #legend.columnspacing: 2.0 # column separation ## *************************************************************************** ## * FIGURE * ## *************************************************************************** ## See https://matplotlib.org/stable/api/figure_api.html#matplotlib.figure.Figure #figure.titlesize: large # size of the figure title (``Figure.suptitle()``) #figure.titleweight: normal # weight of the figure title #figure.labelsize: large # size of the figure label (``Figure.sup[x|y]label()``) #figure.labelweight: normal # weight of the figure label #figure.figsize: 6.4, 4.8 # figure size in inches #figure.dpi: 100 # figure dots per inch #figure.facecolor: white # figure face color #figure.edgecolor: white # figure edge color #figure.frameon: True # enable figure frame #figure.max_open_warning: 20 # The maximum number of figures to open through # the pyplot interface before emitting a warning. # If less than one this feature is disabled. #figure.raise_window : True # Raise the GUI window to front when show() is called. ## The figure subplot parameters. All dimensions are a fraction of the figure width and height. #figure.subplot.left: 0.125 # the left side of the subplots of the figure #figure.subplot.right: 0.9 # the right side of the subplots of the figure #figure.subplot.bottom: 0.11 # the bottom of the subplots of the figure #figure.subplot.top: 0.88 # the top of the subplots of the figure #figure.subplot.wspace: 0.2 # the amount of width reserved for space between subplots, # expressed as a fraction of the average axis width #figure.subplot.hspace: 0.2 # the amount of height reserved for space between subplots, # expressed as a fraction of the average axis height ## Figure layout #figure.autolayout: False # When True, automatically adjust subplot # parameters to make the plot fit the figure # using `tight_layout` #figure.constrained_layout.use: False # When True, automatically make plot # elements fit on the figure. (Not # compatible with `autolayout`, above). ## Padding (in inches) around axes; defaults to 3/72 inches, i.e. 3 points. #figure.constrained_layout.h_pad: 0.04167 #figure.constrained_layout.w_pad: 0.04167 ## Spacing between subplots, relative to the subplot sizes. Much smaller than for ## tight_layout (figure.subplot.hspace, figure.subplot.wspace) as constrained_layout ## already takes surrounding texts (titles, labels, # ticklabels) into account. #figure.constrained_layout.hspace: 0.02 #figure.constrained_layout.wspace: 0.02 ## *************************************************************************** ## * IMAGES * ## *************************************************************************** #image.aspect: equal # {equal, auto} or a number #image.interpolation: antialiased # see help(imshow) for options #image.cmap: viridis # A colormap name (plasma, magma, etc.) #image.lut: 256 # the size of the colormap lookup table #image.origin: upper # {lower, upper} #image.resample: True #image.composite_image: True # When True, all the images on a set of axes are # combined into a single composite image before # saving a figure as a vector graphics file, # such as a PDF. ## *************************************************************************** ## * CONTOUR PLOTS * ## *************************************************************************** #contour.negative_linestyle: dashed # string or on-off ink sequence #contour.corner_mask: True # {True, False} #contour.linewidth: None # {float, None} Size of the contour line # widths. If set to None, it falls back to # `line.linewidth`. #contour.algorithm: mpl2014 # {mpl2005, mpl2014, serial, threaded} ## *************************************************************************** ## * ERRORBAR PLOTS * ## *************************************************************************** #errorbar.capsize: 0 # length of end cap on error bars in pixels ## *************************************************************************** ## * HISTOGRAM PLOTS * ## *************************************************************************** #hist.bins: 10 # The default number of histogram bins or 'auto'. ## *************************************************************************** ## * SCATTER PLOTS * ## *************************************************************************** #scatter.marker: o # The default marker type for scatter plots. #scatter.edgecolors: face # The default edge colors for scatter plots. ## *************************************************************************** ## * AGG RENDERING * ## *************************************************************************** ## Warning: experimental, 2008/10/10 #agg.path.chunksize: 0 # 0 to disable; values in the range # 10000 to 100000 can improve speed slightly # and prevent an Agg rendering failure # when plotting very large data sets, # especially if they are very gappy. # It may cause minor artifacts, though. # A value of 20000 is probably a good # starting point. ## *************************************************************************** ## * PATHS * ## *************************************************************************** #path.simplify: True # When True, simplify paths by removing "invisible" # points to reduce file size and increase rendering # speed #path.simplify_threshold: 0.111111111111 # The threshold of similarity below # which vertices will be removed in # the simplification process. #path.snap: True # When True, rectilinear axis-aligned paths will be snapped # to the nearest pixel when certain criteria are met. # When False, paths will never be snapped. #path.sketch: None # May be None, or a 3-tuple of the form: # (scale, length, randomness). # - *scale* is the amplitude of the wiggle # perpendicular to the line (in pixels). # - *length* is the length of the wiggle along the # line (in pixels). # - *randomness* is the factor by which the length is # randomly scaled. #path.effects: ## *************************************************************************** ## * SAVING FIGURES * ## *************************************************************************** ## The default savefig parameters can be different from the display parameters ## e.g., you may want a higher resolution, or to make the figure ## background white #savefig.dpi: figure # figure dots per inch or 'figure' #savefig.facecolor: auto # figure face color when saving #savefig.edgecolor: auto # figure edge color when saving #savefig.format: png # {png, ps, pdf, svg} #savefig.bbox: standard # {tight, standard} # 'tight' is incompatible with generating frames # for animation #savefig.pad_inches: 0.1 # padding to be used, when bbox is set to 'tight' #savefig.directory: ~ # default directory in savefig dialog, gets updated after # interactive saves, unless set to the empty string (i.e. # the current directory); use '.' to start at the current # directory but update after interactive saves #savefig.transparent: False # whether figures are saved with a transparent # background by default #savefig.orientation: portrait # orientation of saved figure, for PostScript output only ### macosx backend params #macosx.window_mode : system # How to open new figures (system, tab, window) # system uses the MacOS system preferences ### tk backend params #tk.window_focus: False # Maintain shell focus for TkAgg ### ps backend params #ps.papersize: letter # {figure, letter, legal, ledger, A0-A10, B0-B10} #ps.useafm: False # use AFM fonts, results in small files #ps.usedistiller: False # {ghostscript, xpdf, None} # Experimental: may produce smaller files. # xpdf intended for production of publication quality files, # but requires ghostscript, xpdf and ps2eps #ps.distiller.res: 6000 # dpi #ps.fonttype: 3 # Output Type 3 (Type3) or Type 42 (TrueType) ### PDF backend params #pdf.compression: 6 # integer from 0 to 9 # 0 disables compression (good for debugging) #pdf.fonttype: 3 # Output Type 3 (Type3) or Type 42 (TrueType) #pdf.use14corefonts: False #pdf.inheritcolor: False ### SVG backend params #svg.image_inline: True # Write raster image data directly into the SVG file #svg.fonttype: path # How to handle SVG fonts: # path: Embed characters as paths -- supported # by most SVG renderers # None: Assume fonts are installed on the # machine where the SVG will be viewed. #svg.hashsalt: None # If not None, use this string as hash salt instead of uuid4 ### pgf parameter ## See https://matplotlib.org/stable/tutorials/text/pgf.html for more information. #pgf.rcfonts: True #pgf.preamble: # See text.latex.preamble for documentation #pgf.texsystem: xelatex ### docstring params #docstring.hardcopy: False # set this when you want to generate hardcopy docstring ## *************************************************************************** ## * INTERACTIVE KEYMAPS * ## *************************************************************************** ## Event keys to interact with figures/plots via keyboard. ## See https://matplotlib.org/stable/users/explain/interactive.html for more ## details on interactive navigation. Customize these settings according to ## your needs. Leave the field(s) empty if you don't need a key-map. (i.e., ## fullscreen : '') #keymap.fullscreen: f, ctrl+f # toggling #keymap.home: h, r, home # home or reset mnemonic #keymap.back: left, c, backspace, MouseButton.BACK # forward / backward keys #keymap.forward: right, v, MouseButton.FORWARD # for quick navigation #keymap.pan: p # pan mnemonic #keymap.zoom: o # zoom mnemonic #keymap.save: s, ctrl+s # saving current figure #keymap.help: f1 # display help about active tools #keymap.quit: ctrl+w, cmd+w, q # close the current figure #keymap.quit_all: # close all figures #keymap.grid: g # switching on/off major grids in current axes #keymap.grid_minor: G # switching on/off minor grids in current axes #keymap.yscale: l # toggle scaling of y-axes ('log'/'linear') #keymap.xscale: k, L # toggle scaling of x-axes ('log'/'linear') #keymap.copy: ctrl+c, cmd+c # copy figure to clipboard ## *************************************************************************** ## * ANIMATION * ## *************************************************************************** #animation.html: none # How to display the animation as HTML in # the IPython notebook: # - 'html5' uses HTML5 video tag # - 'jshtml' creates a JavaScript animation #animation.writer: ffmpeg # MovieWriter 'backend' to use #animation.codec: h264 # Codec to use for writing movie #animation.bitrate: -1 # Controls size/quality trade-off for movie. # -1 implies let utility auto-determine #animation.frame_format: png # Controls frame format used by temp files ## Path to ffmpeg binary. Unqualified paths are resolved by subprocess.Popen. #animation.ffmpeg_path: ffmpeg ## Additional arguments to pass to ffmpeg. #animation.ffmpeg_args: ## Path to ImageMagick's convert binary. Unqualified paths are resolved by ## subprocess.Popen, except that on Windows, we look up an install of ## ImageMagick in the registry (as convert is also the name of a system tool). #animation.convert_path: convert ## Additional arguments to pass to convert. #animation.convert_args: -layers, OptimizePlus # #animation.embed_limit: 20.0 # Limit, in MB, of size of base64 encoded # animation in HTML (i.e. IPython notebook)
简写
rc (runtime configuration) 运行时动态配置