一、QPieSeries简介
1. 官方描述
https://doc.qt.io/qtforpython-6/PySide6/QtCharts/QPieSeries.html
一个饼图序列(QPieSeries)由一组 QPieSlice 类对象组成。slice的值可以是任意数值,当它被加入series后,QPieSeries 会计算出它占所有切片值总和的百分比,以便确定该切片在饼图中的实际大小。
饼图在图表中的大小【译注:包括 QPieSeries 的属性饼图大小size、空洞大小holeSize】和位置【译注:属性horizontalPosition】都由一个 [0.0, 1.0] 范围内的浮点值来控制。该值控制饼图属性的实际大小与饼图所在QChart矩形区域大小相关。
默认情况下,饼图有一个完整的圆周。
一个不完整的饼图可以通过设置QPieSeries的起始角度【译注:指属性startAngle,设置方法为setPieStartAngle()】和生长角度【译注:原文"angle span",但官方文档没有相关属性和方法,仅有一个endAngle符合该情景,其设置方法为setPieEndAngle()】来实现。
一个完整的饼图是360°,它的0°在12点钟的方向【译注:也就是正上方】。
1.1 属性
| 属性 | 描述 | 备注 |
|---|---|---|
| count | 切片数量 | |
| sum | 所有切片数值总和 | |
| startAngle | 饼图开始的角度。默认值为0 | 数值没有限制,甚至可以在 [-360, 360] 之外 |
| endAngle | 饼图结束的角度。默认值为360 | 数值没有限制,甚至可以在 [-360, 360] 之外。 若startAngle > endAngle,那么饼图将逆时针生长; 若startAngle与endAngle的差值大于360,那么饼图会出现重叠现象 |
| size | 饼图大小。默认值为0.7 | 取值范围 [0, 1] 。是相对于饼图所在QChart的矩形区域而言的。 若取值为0,那么饼图不会显示; 若取值为1,那么饼图占满QChart的矩形区域,也就是饼图的边界与QChart的矩形内接 |
| holeSize | 饼图中心空洞的大小。默认值为0 | 取值范围 [0, 1] 。是相对于饼图所在QChart的矩形区域而言的。 若取值为0,那么没有空洞; 若取值为1,那么空洞占满饼图,也就没有显示饼图; 若holeSize > size,那么饼图不会显示(相当于饼图被一个背景色的圆形完全遮挡) |
| horizontalPosition | 饼图的水平位置。默认值为0.5 | 取值范围 [0, 1] 。是饼图的圆心相对于饼图所在QChart的左右边界范围而言的。 若取值为0,那么圆心在QChart的左边界上; 若取值为1,那么圆心在QChart的右边界上 |
| verticalPosition | 饼图的垂直位置。默认值为0.5 | 取值范围 [0, 1] 。是饼图的圆心相对于饼图所在QChart的上下边界范围而言的。 若取值为0,那么圆心在QChart的上边界上; 若取值为1,那么圆心在QChart的下边界上 |
1.2 信号
| 信号 | 描述 |
|---|---|
| hovered(slice, state) | 鼠标悬停到切片,或离开切片时触发。鼠标悬停到切片时,status为True,离开时为False |
2. 官方用例
https://doc.qt.io/qtforpython-6/examples/example_charts_piechart.html
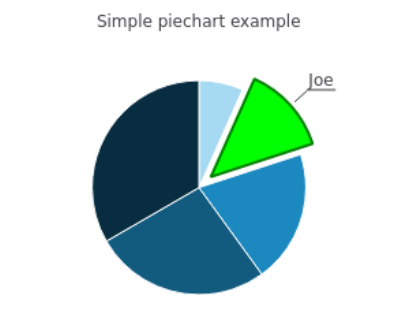
该用例绘制了含有5个切片的饼图。
2.1 创建饼图
# Copyright (C) 2022 The Qt Company Ltd.
# SPDX-License-Identifier: LicenseRef-Qt-Commercial OR BSD-3-Clause

"""PySide6 port of the Pie Chart Example from Qt v5.x"""

import sys
from PySide6.QtCore import Qt
from PySide6.QtGui import QPainter, QPen
from PySide6.QtWidgets import QMainWindow, QApplication
from PySide6.QtCharts import QChart, QChartView, QPieSeries


class TestChart(QMainWindow):

    def __init__(self):
        super().__init__()

        # 创建饼图序列QPieSeries
        self.series = QPieSeries()

        # 向QPieSeries中添加切片 (3种append方法之一:直接传入标签和数值)
        self.series.append('Jane', 1)
        self.series.append('Joe', 2)
        self.series.append('Andy', 3)
        self.series.append('Barbara', 4)
        self.series.append('Axel', 5)

        # 设置第二个切片QPieSlice的格式
        self.slice = self.series.slices()[1]
        # 使其分离饼图中心 (该方法的形参exploded默认为True)
        self.slice.setExploded()
        # 使标签可见 (该方法的形参visible默认为True)
        self.slice.setLabelVisible()
        # 设置该切片的轮廓颜色
        self.slice.setPen(QPen(Qt.darkGreen, 2))
        # 设置该切片的内部填充颜色
        self.slice.setBrush(Qt.green)

        self.chart = QChart()
        self.chart.addSeries(self.series)
        self.chart.setTitle('Simple piechart example')
        self.chart.legend().hide()

        self._chart_view = QChartView(self.chart)
        self._chart_view.setRenderHint(QPainter.Antialiasing)

        self.setCentralWidget(self._chart_view)


if __name__ == "__main__":
    app = QApplication(sys.argv)

    window = TestChart()
    window.show()
    window.resize(440, 300)

    sys.exit(app.exec())
二、实践
1. 用例说明
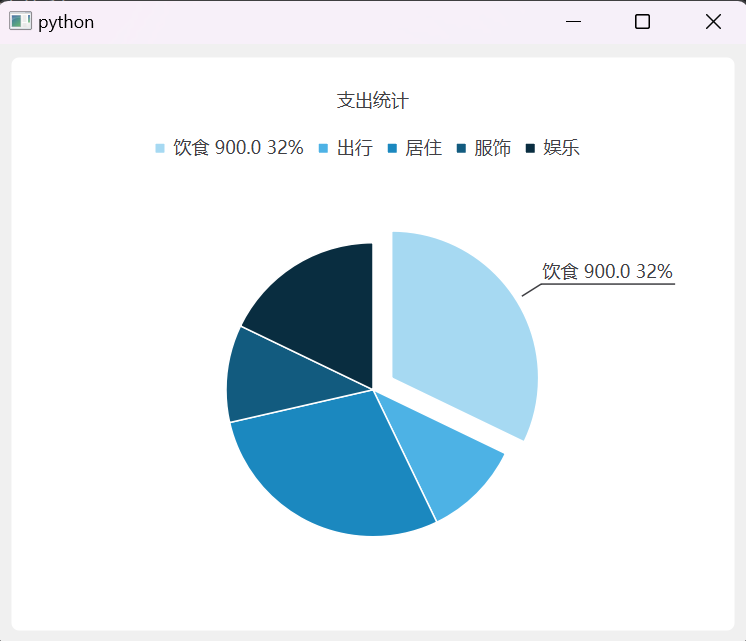
用支出类型及其数值,绘制饼图。
2. 代码实现
from PySide6.QtCharts import QChart, QChartView, QPieSeries, QPieSlice
from PySide6.QtGui import QPainter
from PySide6.QtWidgets import QApplication, QMainWindow


# 鼠标悬停在切片slice上时触发
def onHovered(the_slice: QPieSlice, state: bool):
    the_slice.setExploded(state)
    the_slice.setLabelVisible(state)
    pure_label = the_slice.label().split(' ')[0]
    if state:
        the_slice.setLabel(f'{pure_label} {the_slice.value()} {the_slice.percentage():.0%}')
    else:
        the_slice.setLabel(pure_label)


app = QApplication([])
window = QMainWindow()
chart = QChart()
chart.setTitle('支出统计')
chart.setAnimationOptions(QChart.AnimationOption.SeriesAnimations)

# 准备数据
axisY_value1 = [10 - 2 * i for i in range(5)]
axisY_value2 = [5 + i * (-1) ** i for i in range(5)]

# 创建饼图切片slice
slice_eating = QPieSlice('饮食', 900)
slice_go_out = QPieSlice('出行', 300)
slice_shelter = QPieSlice('居住', 800)
slice_clothing = QPieSlice('服饰', 300)
slice_entertainment = QPieSlice('娱乐', 500)
slice_list = [slice_eating, slice_go_out, slice_shelter, slice_clothing, slice_entertainment]

# 创建饼图序列series
pie_series = QPieSeries()
# 绑定信号与槽
pie_series.hovered.connect(onHovered)

# 将slice加入series
pie_series.append(slice_list)

# 将series加入chart
chart.addSeries(pie_series)

# 显示图表
chartView = QChartView(chart)
chartView.setRenderHint(QPainter.Antialiasing)
window.setCentralWidget(chartView)
window.show()

# 更新数据
pie_series.clear()
new_value = [(i + 2) * 10 for i in range(5)]
slice_new_list = [QPieSlice(f'饮食{i + 1}', new_value[i]) for i in range(5)]
pie_series.append(slice_new_list)

window.resize(500, 400)
app.exec()
三、问题与总结
比较简单,暂时未遇到问题