ELK的使用
目录
环境准备
| 主机 | 内网 | 外网 | 软件 | 作用 |
|---|---|---|---|---|
| ELK01 | 172.16.1.81 | 10.0.0.81 | elasticsearch | |
| ELK02 | 172.16.1.82 | 10.0.0.82 | elasticsearch | |
| ELK03 | 172.16.1.83 | 10.0.0.83 | logstash, tomcat | |
| ELK04 | 172.16.1.84 | 10.0.0.84 | kibana | |
| db01 | 172.16.1.51 | 10.0.0.51 | redis |
安装elasticsearch
# 安装JDK依赖,java里有
yum install -y java

# 换源
vim /etc/yum.repos.d/es.repo
[elasticsearch-5.x]
name=Elasticsearch repository for 5.x packages
baseurl=https://artifacts.elastic.co/packages/5.x/yum
gpgcheck=1
gpgkey=https://artifacts.elastic.co/GPG-KEY-elasticsearch
enabled=1
autorefresh=1
type=rpm-md

# 用于更新 Yum 软件包管理器的本地缓存的命令
yum makecache

# 下载es
yum install -y elasticsearch

# es的配置文件
vim /etc/elasticsearch/elasticsearch.yml
cluster.name: elkstack
node.name: es01
path.data: /data/es/data
path.logs: /data/es/logs
network.host: 0.0.0.0
http.port: 9200
discovery.zen.ping.unicast.hosts: ["10.0.0.81", "10.0.0.82"]
# bootstrap.memory_lock: true   如果服务起不来就改false

#?--------------
## 解释
cluster.name: 设置集群的名称为 "elkstack"。
node.name: 设置节点的名称为 "es01"。
path.data: 指定数据存储路径为 "/data/es/data"。Elasticsearch 会将索引和分片的数据存储在该路径下。你可以根据实际需求来设置该路径。
path.logs: 指定日志文件存储路径为 "/data/es/logs"。Elasticsearch 会将日志文件存储在该路径下。你可以根据实际需求来设置该路径。
network.host: 设置节点的网络地址为 0.0.0.0。这表示节点将监听所有可用的网络接口,并接受来自任何地址的请求。
http.port: 设置 HTTP 通信端口为 9200。Elasticsearch 节点将通过该端口提供 HTTP API 服务,用于与客户端进行通信。
discovery.zen.ping.unicast.hosts: 设置用于发现其他节点的主机列表。在这里,设置为 ["10.0.0.81", "10.0.0.82"],表示节点将尝试连接到这两个 IP 地址上的其他 Elasticsearch 节点。
#?--------------
# 创建目录和日志的文件
mkdir -p /data/es/data
mkdir -p /data/es/logs

# 修改内存限制(如果有去掉此行注释)
vim /usr/lib/systemd/system/elasticsearch.service
查看文件内是否有这个,有的话注释了
LimitMEMLOCK=infinity

# 授权
chown -R elasticsearch.elasticsearch /data/

#优化文件描述符(最后一行)
vim /etc/security/limits.conf
# End of file
* - nofile 65535
* soft memlock unlimited
* hard memlock unlimited
* soft nofile 131072
* hard nofile 131072

# 设置JVM最大最小内存限制
vim /etc/elasticsearch/jvm.options
 22 -Xms1g
 23 -Xmx1g

# 启动es
systemctl start elasticsearch.service

# 查看是否有9200端口(还一个9300端口)
[root@elk01 ~]# netstat -lntup
tcp6       0      0 :::9200                 :::*                    LISTEN      1250/java
tcp6       0      0 :::9300                 :::*                    LISTEN      1250/java

# 查看/data
[root@elk01 ~]# tree /data/
/data/
└── es
    ├── data
    │   └── nodes
    │       └── 0
    │           ├── node.lock
    │           └── _state
    │               ├── global-0.st
    │               └── node-0.st
    └── logs
        ├── elkstack_deprecation.log
        ├── elkstack_index_indexing_slowlog.log
        ├── elkstack_index_search_slowlog.log
        └── elkstack.log

# 浏览器访问
10.0.0.81:9200
10.0.0.82:9200


安装elasticsearch插件
# 安装npm
yum install -y npm
npm 前端语法 //node
head插件是一个前端的代码
python-pip
# 安装git命令
yum install -y git
## 下载head插件
[root@elk01 ~]# git clone https://github.com/mobz/elasticsearch-head.git
Cloning into 'elasticsearch-head'...
remote: Enumerating objects: 4377, done.
remote: Counting objects: 100% (40/40), done.
remote: Compressing objects: 100% (27/27), done.
remote: Total 4377 (delta 12), reused 34 (delta 12), pack-reused 4337
Receiving objects: 100% (4377/4377), 2.54 MiB | 2.15 MiB/s, done.
Resolving deltas: 100% (2429/2429), done.
## 下载nodejs
wget https://nodejs.org/dist/v16.13.0/node-v16.13.0-linux-x64.tar.xz
## 解压nodejs
tar xf node-v16.13.0-linux-x64.tar.xz
mkdir /app
mv node-v16.13.0-linux-x64 /app/
# 做软连接
ln -s /app/node-v16.13.0-linux-x64/ /app/node
# 添加环境变量
vim /etc/profile.d/node.sh
expr PATH="/app/node/bin:$PATH"
# 生效配置文件
[root@elk01 ~]# source /etc/profile
PATH=/app/node/bin:/usr/local/sbin:/usr/local/bin:/usr/sbin:/usr/bin:/root/bin
# 查看版本
[root@elk01 ~]# npm --version
8.19.2
# 进入head插件目录
cd elasticsearch-head
# 换源
npm config set registry=https://registry.npm.taobao.org
# 查看当前包下的镜像源
[root@elk01 elasticsearch-head]# npm config get registry
https://registry.npm.taobao.org/
# 安装换源命令
[root@elk01 elasticsearch-head]# npm install -g nrm open@8.4.2 --save
added 17 packages in 6s
npm notice
npm notice New major version of npm available! 8.19.2 -> 9.8.0
npm notice Changelog: https://github.com/npm/cli/releases/tag/v9.8.0
npm notice Run npm install -g npm@9.8.0 to update!
npm notice
# 查看可用源
[root@elk01 elasticsearch-head]# nrm ls
npm ---------- https://registry.npmjs.org/
yarn --------- https://registry.yarnpkg.com/
tencent ------ https://mirrors.cloud.tencent.com/npm/
cnpm --------- https://r.cnpmjs.org/
taobao ------- https://registry.npmmirror.com/
npmMirror ---- https://skimdb.npmjs.com/registry/
# 切换到taobao源
[root@elk01 elasticsearch-head]# nrm use taobao
SUCCESS The registry has been changed to 'taobao'.
# 可能需要安装bzip2
yum install -y bzip2
# 构筑
npm install grunt -save-no-fund
?----------------------------------
# 不能进行grunt安装的时候进行执行下面这些
## 保存phantomjs-2.1.1-linux-x86_64.tar.bz2 到/root
#解压phantomjs-2.1.1-linux-x86_64.tar.bz2
tar -xf phantomjs-2.1.1-linux-x86_64.tar.bz2
# 进入目录
cd phantomjs-2.1.1-linux-x86_64
cp bin/phantomjs /usr/local/bin/
# 回到elasticsearch-head
cd elasticsearch-head
?--------------------------------
# 启动head插件(& 是防到后台运行)
[root@elk01 elasticsearch-head-master]# npm run start &
[1] 18164
[root@elk01 elasticsearch-head-master]#
> elasticsearch-head@0.0.0 start
> grunt server
Running "connect:server" (connect) task
Waiting forever...
Started connect web server on http://localhost:9100
# 检查端口
[root@elk01 ~]# netstat -lntup
Active Internet connections (only servers)
Proto Recv-Q Send-Q Local Address Foreign Address State PID/Program name
tcp 0 0 0.0.0.0:9100 0.0.0.0:* LISTEN 1334/grunt
# 开启跨域访问支持
vim /etc/elasticsearch/elasticsearch.yml
http.cors.enabled: true
http.cors.allow-origin: "*"
# 重启elasticsearch
systemctl restart elasticsearch.service
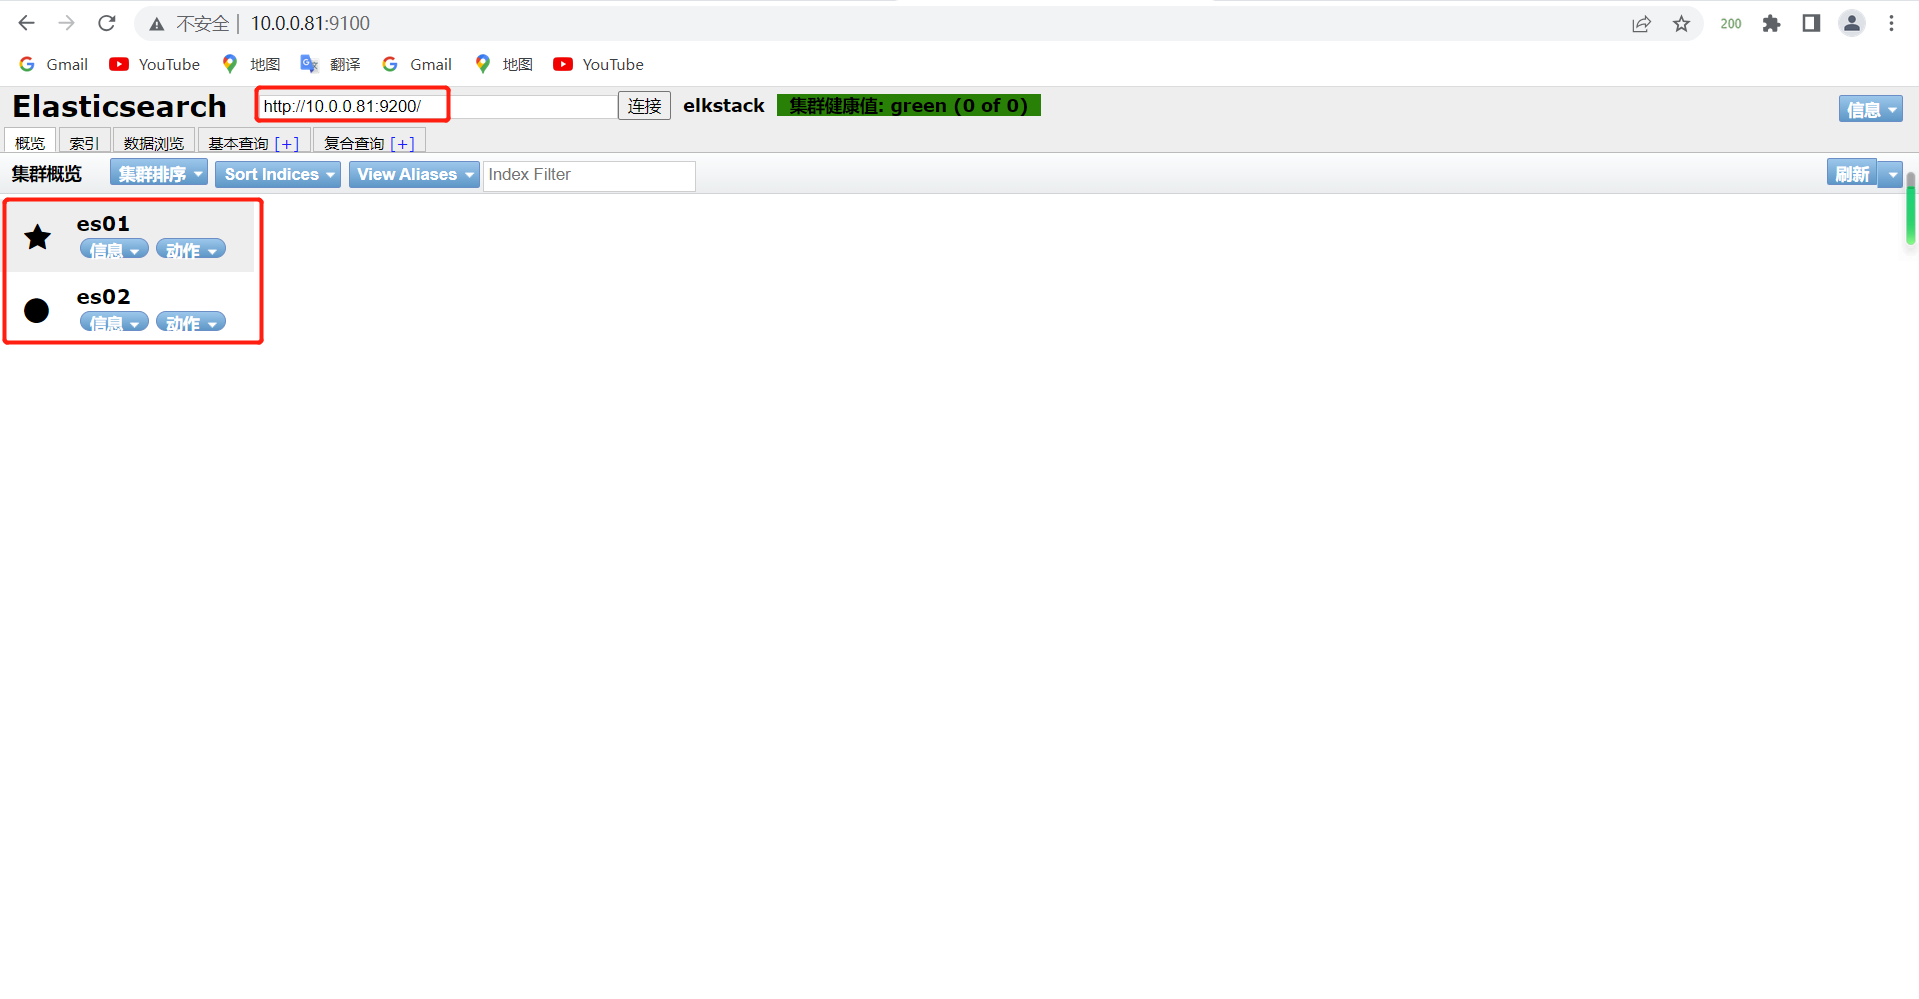
# 访问浏览器
10.0.0.81:9100
副本分片
手动添加节点
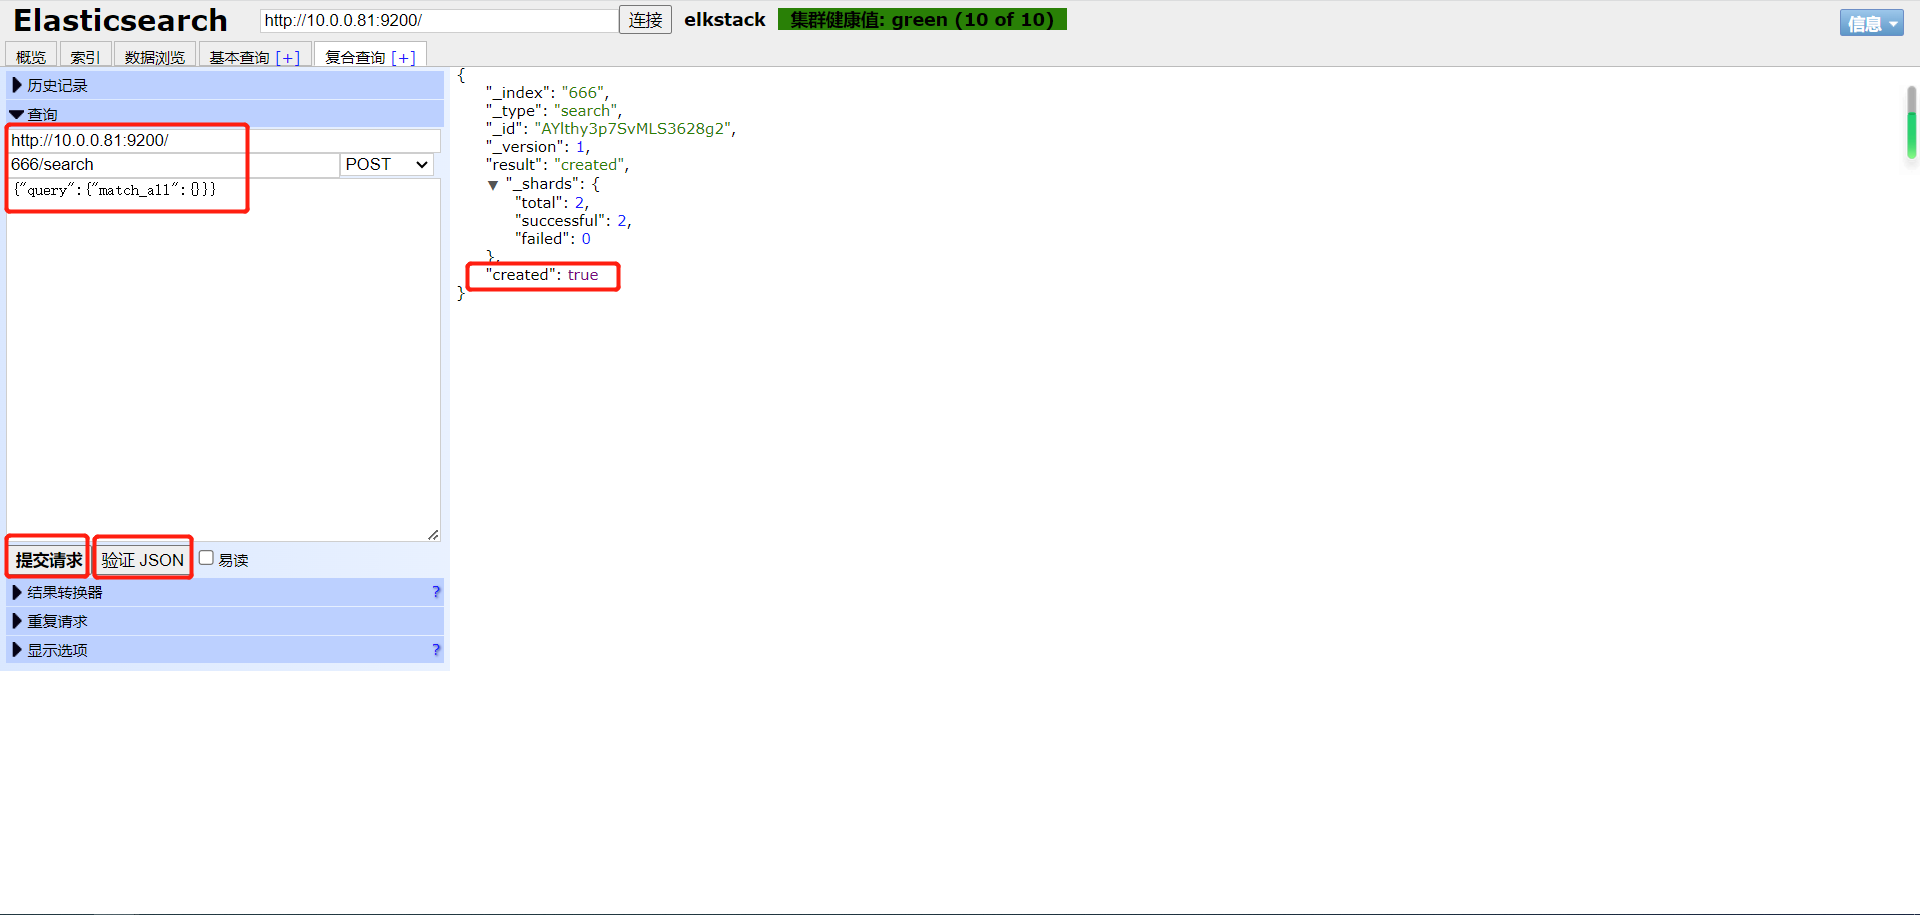
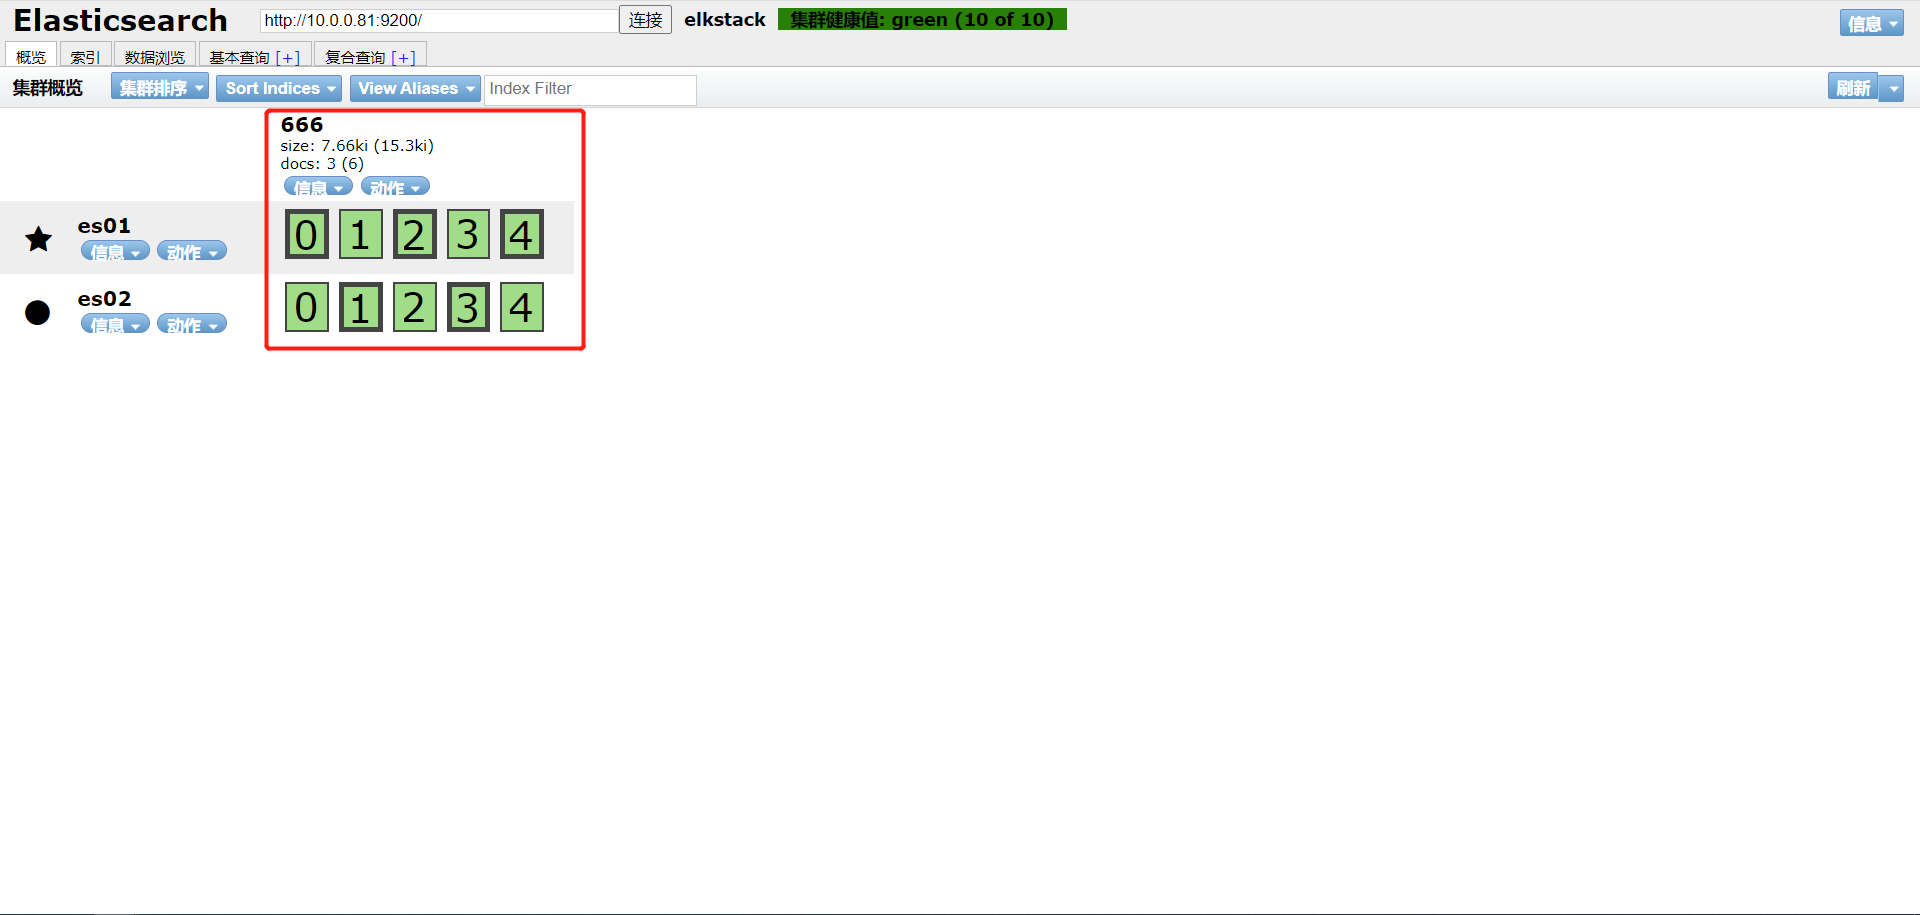
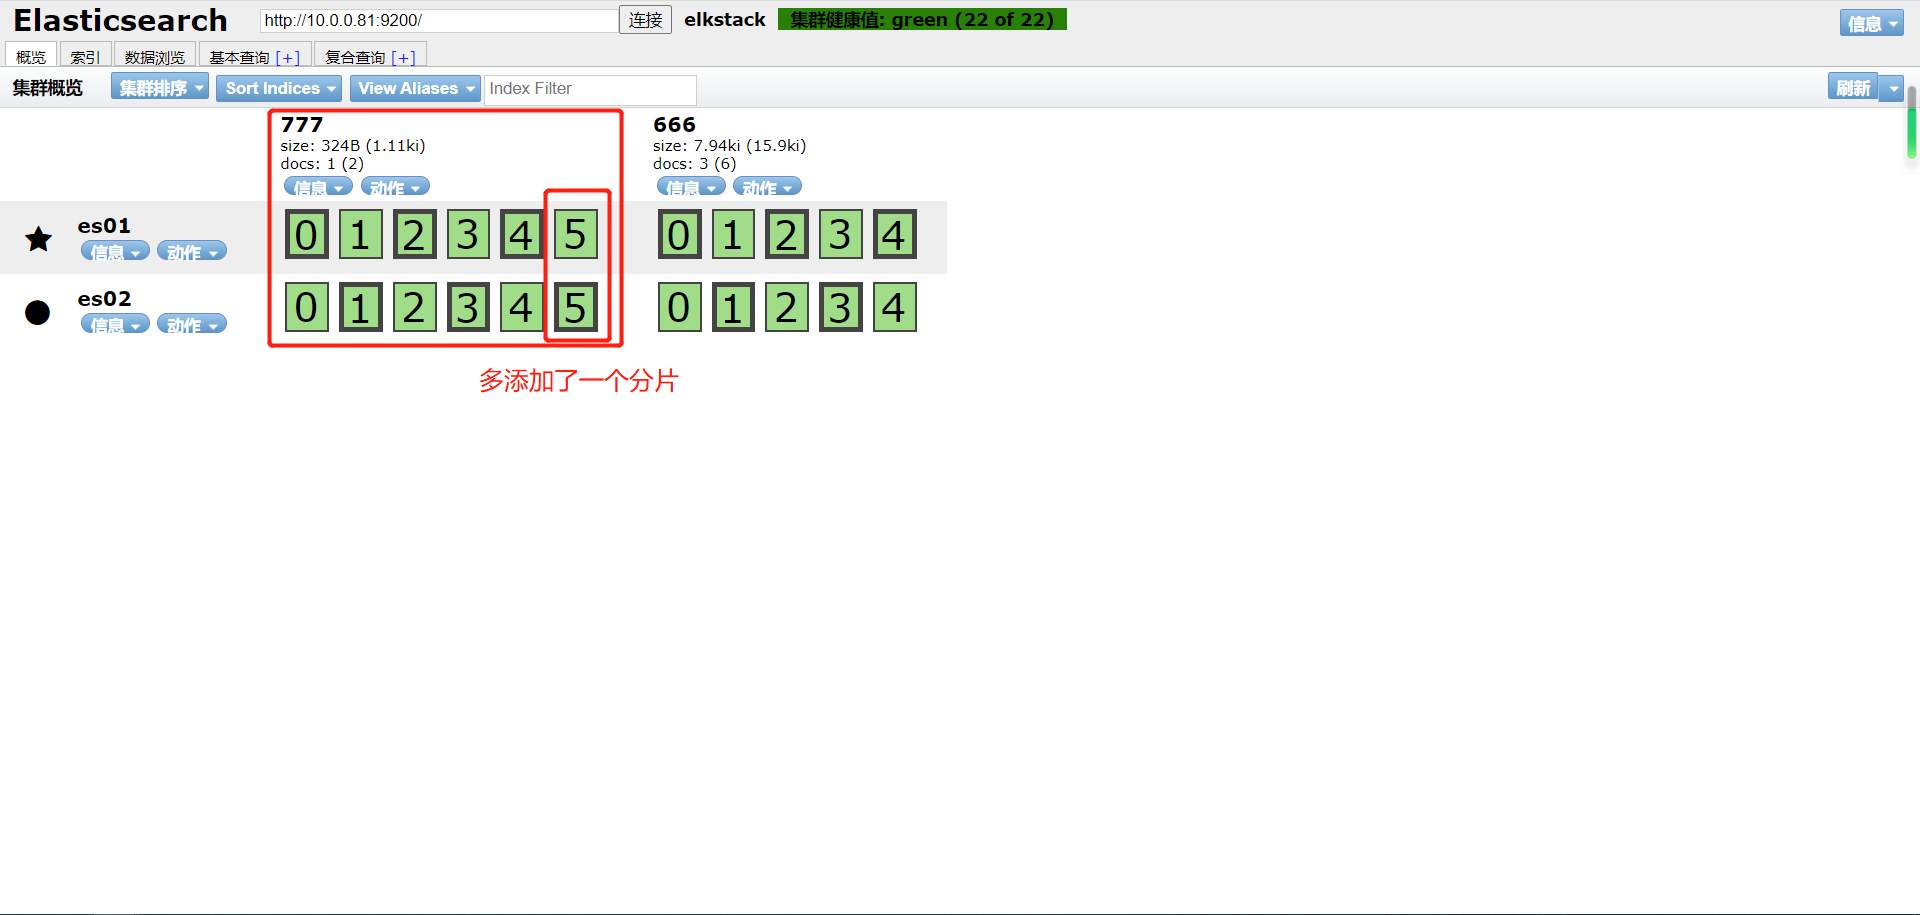
添加分片
#在每个节点上执行,分配1个副本6个分片
[root@elk01 ~]# curl -XPUT 10.0.0.81:9200/_template/my_template -d'
> {    "template": "*",
>      "settings": {
>         "index": {
>             "number_of_shards": 6,
>             "number_of_replicas": 1
>         }
>      }
> }'
{"acknowledged":true}[root@elk01 ~]#
节点保存位置
[root@elk01 ~]# ll /data/es/data/nodes/0/indices/
total 0
drwxr-xr-x 9 elasticsearch elasticsearch 74 Jul 19 17:49 -bUngdi4QGqKWULLFs6PKA
drwxr-xr-x 8 elasticsearch elasticsearch 65 Jul 19 17:41 X_FAPMR1RpSUHjZNHad8HQ

主备删除一个后,健康值会变黄,但是他们可以同步。
logstash部署
# 安装jdk依赖,java里有
yum install -y java

# logstash的下载
wget https://artifacts.elastic.co/downloads/logstash/logstash-5.3.0.rpm

# 安装logstash
yum localinstall logstash-5.3.0.rpm -y

# 授权
chown logstash.logstash /usr/share/logstash/

# 添加输入命令执行
cat >>/etc/profile.d/logstash.sh<< EOF
export PATH='/usr/share/logstash/bin:$PATH'
EOF

# 生效文件
source /etc/profile
logstash的插件
- INPUT 输入插件 日志来自哪里
- OUPUT 输出插件
| INPUT支持事件源 | OUTPUT支持输出源 | CODEC编解码器支持编码 |
|---|---|---|
| azure_event_hubs(微软云事件中心) | elasticsearch(搜索引擎数据库) | avro(数据序列化) |
| beats(filebeat日志收集工具) | email(邮件) | CEF(嵌入式框架) |
| elasticsearch(搜索引擎数据库) | file(文件) | es_bulk(ES中的bulk api) |
| file(文件) | http(超文本传输协议) | Json(数据序列化、格式化) |
| generator(生成器) | kafka(基于java的消息队列) | Json_lines(便于存储结构化) |
| heartbeat(高可用软件) | rabbitmq(消息队列 OpenStack) | line(行) |
| http_poller(http api) | redis(缓存、消息队列、NoSQL) | multiline(多行匹配) |
| jdbc(java连接数据库的驱动) | s3*(存储) | plain(纯文本,事件间无间隔) |
| kafka(基于Java的消息队列) | sidout(标准输出) | rubydebug(ruby语法格式) |
| rabbitmq(消息队列 OpenStack) | tcp(传输控制协议) | |
| redis(缓存、消息队列、NoSQL) | udp(用户数据报协议) | |
| s3*(存储) | ||
| stdin(标准输入) | ||
| syslog(系统日志) | ||
| tcp(传输控制协议) | ||
| udp(用户数据报协议) |
logstash日志收集
配置文件
# Logstash管道通常有三个阶段:输入→ 过滤器→ 输出。输入生成事件,过滤器修改它们,输出将它们发送到其他地方。
input {
  ...
}

filter {
  ...
}

output {
  ...
}
#进入Logstash配置文件目录下
[root@elkstack03 ~]# cd /etc/logstash/conf.d/
#编辑Logstash收集日志的配置文件
[root@elkstack03 conf.d]# vim message.conf
#输入插件
input {
#文件模块
  file {
#日志类型
    type => "message-log"
#日志路径
    path => "/var/log/messages"
#第一次收集日志从头开始
    start_position => "beginning"
#从日志文件末尾开始读取
    #start_position => "end"
  }
}
#对日志数据进行过滤处理
filter{
#接下来要使用的是 JSON 过滤器插件,用于解析日志数据中的 JSON 字符串。
	json{
#要解析的字段为 message,即将该字段中的 JSON 字符串进行解析。
		source => 'message'
#在解析后,将原始的 message 字段移除,避免在输出阶段仍然包含未解析的字段。
		remove_field => ["message"]
		}
	}
#输出插件
output {
#ES模块
    elasticsearch {
#主机信息
      hosts => ["10.0.0.51:9200"]
#索引名称,也就是日志名称
      index => "%{type}-%{+YYYY.MM.dd}"
#输出成json格式
      codec => "json"
  }
}
多个文件输入
input{
        file{
                type => "msg_log"
                path => "/var/log/messages"
                start_position => "beginning"
        }
        file{
                type => "sec_log"
                path => "/var/log/secure"
                start_position => "beginning"
        }
}
output{
        elasticsearch{
                hosts => ["10.0.0.81:9200"]
                index => "%{type}-%{+yyyy.MM.dd}"
        }
}
haproxy日志收集
haproxy
#安装rsyslog
[root@elkstack03 ~]# yum install -y rsyslog

#编辑rsyslog配置文件
[root@elkstack03 ~]# vim /etc/rsyslog.conf
$ModLoad imudp
$UDPServerRun 514
$ModLoad imtcp
$InputTCPServerRun 514
#最后面一行添加,local6对应haproxy配置文件定义的local级别,端口为Logstash的端口
local6.*     @@10.0.0.83:2222

在这个配置中:
$ModLoad imudp 表示加载rsyslog的imudp模块,该模块允许接收通过UDP协议发送的日志消息。
$UDPServerRun 514 指定UDP服务器监听端口为514,表示rsyslog将通过UDP协议监听514端口来接收日志消息。
$ModLoad imtcp 表示加载rsyslog的imtcp模块,该模块允许接收通过TCP协议发送的日志消息。
$InputTCPServerRun 514 指定TCP服务器监听端口为514,表示rsyslog将通过TCP协议监听514端口来接收日志消息。
local6.* @@10.0.0.83:2222 表示将所有local6标记的日志消息通过TCP协议发送到IP地址为10.0.0.83、端口为2222的Logstash服务器。local6是一个设备设施标识符(facility),它通常与haproxy的日志配置中的设备标记相对应。

[root@elk03 ~]# cat /etc/logstash/conf.d/haproxy.conf
input{
      syslog {
        type => "rsyslog_haproxy"
        port => "2222"
      }
}
output{
	elasticsearch {
	  hosts => ["10.0.0.81:9200"]
      index =>  "logstash_rsyslog-%{+YYYY.MM.dd}"
    }
}
TCP/UDP日志收集
#编辑logstash配置文件
[root@elkstack03 conf.d]# vim tcp.conf
input {
  tcp {
    port => 1234
    type => "tcplog"
    mode => "server"
  }
}
output {
  elasticsearch {
    hosts => ["10.0.0.81:9200"]
    index =>  "tcp_log-%{+YYYY.MM.dd}"
  }
}

#测试数据
[root@elk02 ~]# echo "曾老湿 伪设备 测试1"  > /dev/tcp/10.0.0.83/1234

#使用yum安装nc
[root@db04 ~]# yum install -y nc

#将/etc/passwd文件当成日志文件传送
[root@elkstack04 ~]# nc 10.0.0.53 1234 < /etc/passwd

#使用nc传输数据
[root@elkstack04 ~]# echo "zls test nc" | nc 10.0.0.53 1234
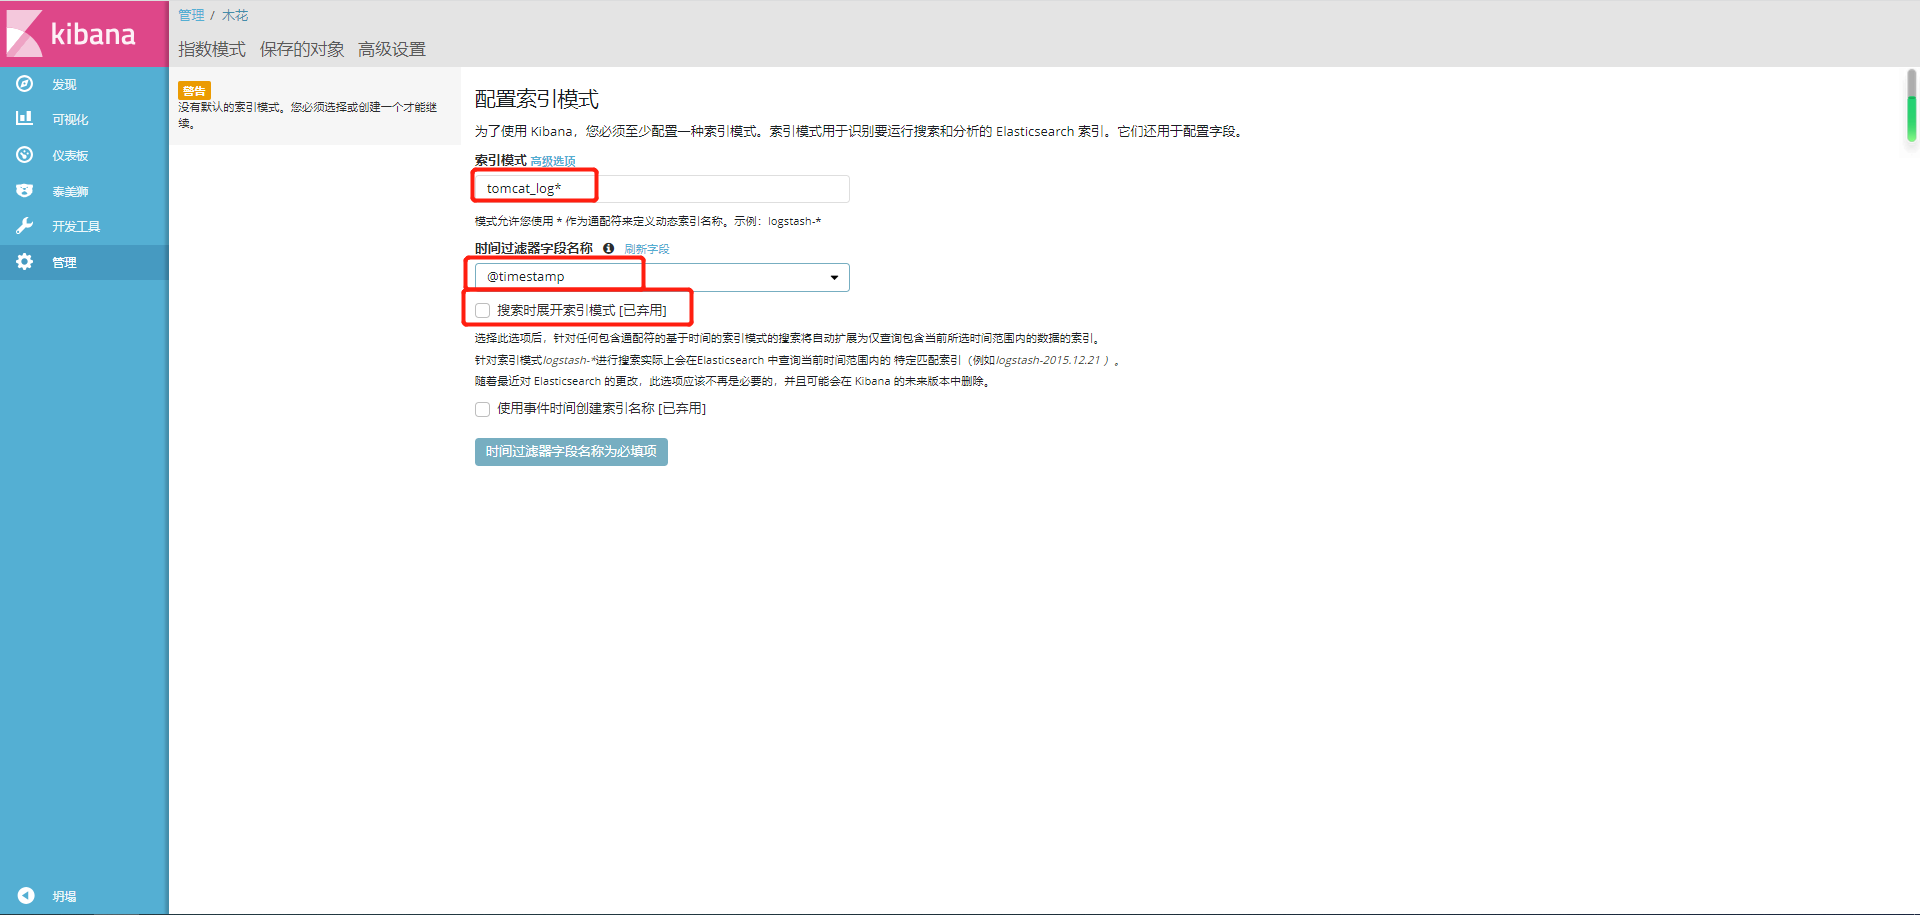
收集tomcat日志以Json格式
vim /etc/tomcat/server.xml
# 137行,加入到pattern里
"clientip":"%h","ClientUser":"%l","authenticated":"%u","AccessTime":"%t","method":"%r","status":"%s","SendBytes":"%b","Query?string":"%q","partner":"%{Referer}i","AgentVersion":"%{User-Agent}i"

vim /etc/logstash/conf.d/tomcat.conf
input{
        file{
                type => "tomcat_log"
                path => "/var/log/tomcat/localhost_access_log.*.txt"
                start_position => "beginning"
        }
}
filter{
	json{
		source => 'message'
		remove_field => ["message"]
		}
	}
output{
        elasticsearch{
                hosts => ["10.0.0.81:9200"]
                index => "%{type}-%{+yyyy.MM.dd}"
        }
}
修改nginx日志格式为Json
# 1.编辑nginx日志,添加日志格式,源main格式和Json格式
[root@elkstack03 ~]# vim /usr/local/nginx/conf/nginx.conf

#main格式日志
    log_format  main  '$remote_addr - $remote_user [$time_local] "$request" '
                      '$status $body_bytes_sent "$http_referer" '
                      '"$http_user_agent" "$http_x_forwarded_for"';

    access_log  logs/access.log  main;

#Json格式日志
    log_format access_json '{"@timestamp":"$time_iso8601",'
            '"host":"$server_addr",'
            '"clientip":"$remote_addr",'
            '"size":$body_bytes_sent,'
            '"responsetime":$request_time,'
            '"upstreamtime":"$upstream_response_time",'
            '"upstreamhost":"$upstream_addr",'
            '"http_host":"$host",'
            '"url":"$uri",'
            '"domain":"$host",'
            '"xff":"$http_x_forwarded_for",'
            '"referer":"$http_referer",'
            '"status":"$status"}';
    access_log  logs/access_json.log  access_json;

# 2.nginx配置文件
[root@elk03 conf.d]# cat blog.conf ttt.com
server {
	listen 80;
	server_name blog.xxx.com;
	root /blog;
	index index.html;
	access_log /var/log/nginx/blog.xxx.com_access_json.log json;
}
server {
	listen 80;
	server_name ttt.xxx.com;
	root /code;
	index index.html;
	access_log /var/log/nginx/ttt.xxx.com_access_json.log json;
}

# 3.logstash配置
[root@elk03 nginx]# pwd
/var/log/nginx
[root@elk03 conf.d]# cat blog_nginx.conf
input{
        file{
                type => "ttt_nginx_acc_log"
                path => "/var/log/nginx/ttt.xxx.com_access_json.log"
                start_position => "beginning"
        }
        file{
                type => "blog_nginx_acc_log"
                path => "/var/log/nginx/blog.xxx.com_access_json.log"
                start_position => "beginning"
        }
}
filter{
	json{
		source => 'message'
		remove_field => ["message"]
		}
	}
output{
        elasticsearch{
                hosts => ["10.0.0.81:9200"]
                index => "%{type}-%{+yyyy.MM.dd}"
		codec => "json"
        }
}
启动logstash
# 启动
logstash -f /etc/logstash/conf.d/message_file_es.conf

# 放到后台启动
logstash -f /etc/logstash/conf.d/message_file_es.conf &
检测语法是否正确
/usr/share/logstash/bin/logstash -f /etc/logstash/conf.d/message.conf -t
Configuration OK
验证Json格式
复制一条日志,打开浏览器,访问:http://www.kjson.com/
安装kibana
# 下载kibana
kibana-5.6.16-x86_64.rpm

# 安装kibana
yum localinstall -y kibana-5.6.16-x86_64.rpm
#?---------------------------------------------或者,
# 更换yum源
[root@elk04 ~]# vim /etc/yum.repos.d/elk.repo
[kibana-5.x]
name=Kibana repository for 5.x packages
baseurl=https://artifacts.elastic.co/packages/5.x/yum
gpgcheck=1
gpgkey=https://artifacts.elastic.co/GPG-KEY-elasticsearch
enabled=1
autorefresh=1
type=rpm-md

# 下载kibana
yum install -y kibana
#?------------------------------------------------wan。

# 编辑配置文件
vim /etc/kibana/kibana.yml
2 server.port: 5601
7 server.host: "0.0.0.0"
21 elasticsearch.url: "http://10.0.0.81:9200"

# 启动kibana
systemctl start kibana

# 检查端口
[root@elk04 ~]# netstat -lntup
tcp        0      0 0.0.0.0:5601            0.0.0.0:*               LISTEN      522/node

# 浏览器访问
10.0.0.84:5601

filebeat部署
执行流程:
日志文件 --> filebeat --> redis --> logstash --> ela --> k
# 下载filebeat
wget https://artifacts.elastic.co/downloads/beats/filebeat/filebeat-5.6.16-x86_64.rpm

# 安装
yum localinstall filebeat-5.6.16-x86_64.rpm -y

# 备份配置文件
[root@elk03 ~]# cp /etc/filebeat/filebeat.yml{,.bak}

# 配置文件更改
/etc/filebeat/filebeat.yml

filebeat.prospectors:
  - input_type: log
  paths:
    - /var/log/nginx/blog.jng.com_access_json.log
# 不收集的行
    exclude_lins: ["^DBG","^$"]
# 日志类型
    document_type: blog_jng_log
  - input_type: log
  paths:
    - /var/log/nginx/blog.xhl.com_access_json.log
# 不收集的行
    exclude_lins: ["^DBG","^$"]
# 日志类型
    document_type: blog_xhl_log
output.redis:
  hosts: ["10.0.0.51:6379"]
# redis里key名称
  key: 'nginx'
# 设置1库
  db: 1
# 设置超时时间
  timeout: 5
# redis密码 没有就不写
# passwd: zls

# 启动filebeat
[root@elk03 ~]# systemctl restart filebeat

# 检查进程
[root@elk03 ~]# ps -ef | grep filebeat

# logstash配置
vim /etc/logstash/conf.d/nginx_redis_es.conf
input{
        redis{
                data_type => 'list'
                key => 'nginx'
                host => '10.0.0.51'
                port => '6379'
                db => '1'
                codec => 'json'
                #password => "zls"
        }
}
filter{
        json{
                source => 'message'
                remove_field => ['message']
        }
}
output{
        elasticsearch{
                hosts => ['10.0.0.81:9200']
                index => '%{type}-%{+yyyy.MM.dd}'
        }
}
redis库
# 下载redis
wget http://download.redis.io/releases/redis-3.2.12.tar.gz

# 解压
tar xf redis-3.2.12.tar.gz

# 创建/app
mkdir /app
mv redis-3.2.12 /app/
ln -s /app/redis-3.2.12/ /app/redis

# 添加环境变量并生效
vim /etc/profile.d/redis.sh
export PATH="/app/redis/src:$PATH"
source /etc/profile

# 建配置文件目录
mkdir -p /data/6379
[root@db04 ~]# vim /data/6379/redis.conf
port 6379
daemonize yes
pidfile /data/6379/redis.pid
logfile "/data/6379/redis.log"
dbfilename dump.rdb
dir /data/6379
protected-mode no

# 启动服务
redis-server /data/6379/redis.conf
[root@db01 redis]# redis-cli
127.0.0.1:6379>
redis命令
redis-cli 启动
redis-cli -a zls 启动redis并输入密码zls
select 15 切换库
keys * 查看当前库的内容
llen nginx_log 查看长度
lrange nginx_log 0 2 查看前三条日志消息
lpop0 nginx_log 删除当前日志
AUTH zls 输入密码,为zls