一、企业级监控大盘配置管理(上)
1、Grafana 简述
Grafana 是一个开源的度量分析与可视化工具。提供查询、可视化、报警和指标展示等功能,能灵活创建图表、仪表盘等可视化界面。
主要功能:
- 可视化: 提供多种可选择的不同类型的图形,能够灵活绘制不同样式,且还提供很多插件。
- 动态仪表盘: 提供以模板和变量的方式来创建动态且可重复使用的仪表盘,可以灵活调整。
- 浏览指标: 通过瞬时查询和动态变化等方式展示数据,可以根据不同的时间范围拆分视图。
- 警报: 可以直观地根据重要的指标定义警报规则。Grafana 将不断评估并向 Slack,邮件,快消息等系统发送通知。
- 混合数据源: 在同一图中混合不同的数据源,可以基于每个查询指定不同数据源。

2、部署Grafana到Kubernetes
2.1 数据持久化
apiVersion: v1
kind: PersistentVolumeClaim
metadata:
  name: grafana-data-pvc
  namespace: monitor
spec:
  accessModes:
    - ReadWriteMany
  storageClassName: "nfs-storageclass"
  resources:
    requests:
      storage: 10Gi
[root@master-1-230 7.11]# kubectl apply -f grafana_pvc.yaml
persistentvolumeclaim/grafana-data-pvc created2.2 配置grafana-config
apiVersion: v1
kind: ConfigMap
metadata:
  name: grafana-config
  namespace: monitor
data:
  grafana.ini: |
    [server]
    root_url = http://grafana.kubernets.cn
    [smtp]
    enabled = true
    host = smtp.exmail.qq.com:465
    user = devops@xxxx.com
    password = aDhUcxxxxyecE
    skip_verify = true
    from_address = devops@xxxx.com
    [alerting]
    enabled = true
    execute_alerts = true
[root@master-1-230 7.11]# kubectl apply -f grafana-config.yaml
configmap/grafana-config created2.3 配置grafana-SVC
apiVersion: v1
kind: Service
metadata:
  name: grafana
  namespace: monitor
  labels:
    app: grafana
    component: core
spec:
  type: ClusterIP
  ports:
    - port: 3000
  selector:
    app: grafana
    component: core
[root@master-1-230 7.11]# kubectl apply -f grafana-svc.yaml
service/grafana created2.4 部署grafana-deployment
apiVersion: apps/v1
kind: Deployment
metadata:
  name: grafana-core
  namespace: monitor
  labels:
    app: grafana
    component: core
spec:
  replicas: 1
  selector:
    matchLabels:
      app: grafana
  template:
    metadata:
      labels:
        app: grafana
        component: core
    spec:
      containers:
      - name: grafana-core
        image: grafana/grafana:latest
        imagePullPolicy: IfNotPresent
        volumeMounts:
        - name: storage
          subPath: grafana
          mountPath: /var/lib/grafana
        # env:
        resources:
          # keep request = limit to keep this container in guaranteed class
          limits:
            cpu: 500m
            memory: 1Gi
          requests:
            cpu: 100m
            memory: 500Mi
        env: 			#配置环境变量,设置Grafana 的默认管理员用户名/密码
          # The following env variables set up basic auth twith the default admin user and admin password.
          - name: GF_AUTH_BASIC_ENABLED
            value: "true"
          - name: GF_AUTH_ANONYMOUS_ENABLED
            value: "false"
          # - name: GF_AUTH_ANONYMOUS_ORG_ROLE
          #   value: Admin
          # does not really work, because of template variables in exported dashboards:
          # - name: GF_DASHBOARDS_JSON_ENABLED
          #   value: "true"
        readinessProbe:
          httpGet:
            path: /login
            port: 3000
          # initialDelaySeconds: 30
          # timeoutSeconds: 1
        volumeMounts:
        - name: data
          subPath: grafana
          mountPath: /var/lib/grafana
        - name: grafana-config
          mountPath: /etc/grafana
          readOnly: true
      securityContext:		 #容器安全策略,设置运行容器使用的归属组与用户
        fsGroup: 472
        runAsUser: 472
      volumes:
      - name: data
        persistentVolumeClaim:
          claimName: grafana-data-pvc
      - name: grafana-config
        configMap:
          name: grafana-config
[root@master-1-230 7.11]# kubectl apply -f grafana-dep.yaml
deployment.apps/grafana-core created2.5 部署grafana-ingress
apiVersion: networking.k8s.io/v1
kind: Ingress
metadata:
  name: grafana-ingress
  namespace: monitor
  annotations:
    prometheus.io/http_probe: "true"
spec:
  ingressClassName: nginx
  rules:
    - host: grafana.ikubernetes.cloud
      http:
        paths:
          - pathType: Prefix
            backend:
              service:
                name: grafana
                port:
                  number: 3000
            path: /
[root@master-1-230 7.11]# kubectl apply -f grafana-ing.yaml
ingress.networking.k8s.io/grafana-ingress created[root@master-1-230 7.11]# kubectl get ingress -n monitor
NAME CLASS HOSTS ADDRESS PORTS AGE
alertmanager-ingress nginx alertmanager.ikubernetes.cloud 192.168.1.204 80 19h
grafana-ingress nginx grafana.ikubernetes.cloud 80 24s
prometheus-alert-ing nginx prometheusalert.ikubernetes.cloud 192.168.1.204 80 157m
prometheus-ingress nginx prometheus.ikubernetes.cloud 192.168.1.204 80 34h2.6 Grafana 安装插件
进入 Grafana Pod 容器内,通过镜像自带的 grafana-cli 工具进行插件的安装,本文以安装饼图插件为例
[root@master-1-230 7.11]# kubectl  get pod -n monitor
NAME                                       READY   STATUS    RESTARTS      AGE
alertmanager-6d55cbcff4-c8n27              2/2     Running   2 (10h ago)   19h
blackbox-exporter-5b4f75cf4c-rzx2h         1/1     Running   1 (10h ago)   27h
grafana-core-7d849765b5-6q4t9              0/1     Running   0             3m59s
kube-state-metrics-6bddcbb99b-g8wlh        2/2     Running   2 (10h ago)   34h
node-exporter-2mtrj                        1/1     Running   1 (10h ago)   33h
node-exporter-r64mt                        1/1     Running   1 (10h ago)   33h
node-exporter-rbzzq                        1/1     Running   3 (10h ago)   33h
prometheus-7c45654c5f-hwdg7                2/2     Running   8 (10h ago)   34h
prometheus-alert-center-58f446c665-75kdk   1/1     Running   0             125m
webhook-dingtalk-55ddf85686-d8rzz          1/1     Running   0             7h49m
[root@master-1-230 7.11]# kubectl  exec -it grafana-core-7d849765b5-6q4t9 -n monitor -- bash
grafana-core-7d849765b5-6q4t9:/usr/share/grafana$ grafana-cli plugins install grafana-piechart-panel
Deprecation warning: The standalone 'grafana-cli' program is deprecated and will be removed in the future. Please update all uses of 'grafana-cli' to 'grafana cli'
✔ Downloaded and extracted grafana-piechart-panel v1.6.4 zip successfully to /var/lib/grafana/plugins/grafana-piechart-panel

Please restart Grafana after installing or removing plugins. Refer to Grafana documentation for instructions if necessary.

grafana-core-7d849765b5-6q4t9:/usr/share/grafana$ grafana-cli plugins install camptocamp-prometheus-alertmanager-datasource
Deprecation warning: The standalone 'grafana-cli' program is deprecated and will be removed in the future. Please update all uses of 'grafana-cli' to 'grafana cli'
✔ Downloaded and extracted camptocamp-prometheus-alertmanager-datasource v2.0.0 zip successfully to /var/lib/grafana/plugins/camptocamp-prometheus-alertmanager-datasource

Please restart Grafana after installing or removing plugins. Refer to Grafana documentation for instructions if necessary.
插件已经安装成功,不过在默认情况下 Grafana 并不会自动热加载插件,必须将应用重启后才能够重新加载插件。
2.7 验证测试Grafana
[root@master-1-230 7.11]# curl http://grafana.ikubernetes.cloud/
<a href="/login">Found</a>.
二、企业级监控大盘配置管理(下)
4、企业级监控大盘
创建不同维度的大盘:Create --> New dashboard folder --> 集群层面
官方大盘指引:Dashboards | Grafana Labs
监控指标说明:监控指标说明 | KubeSphere Documents
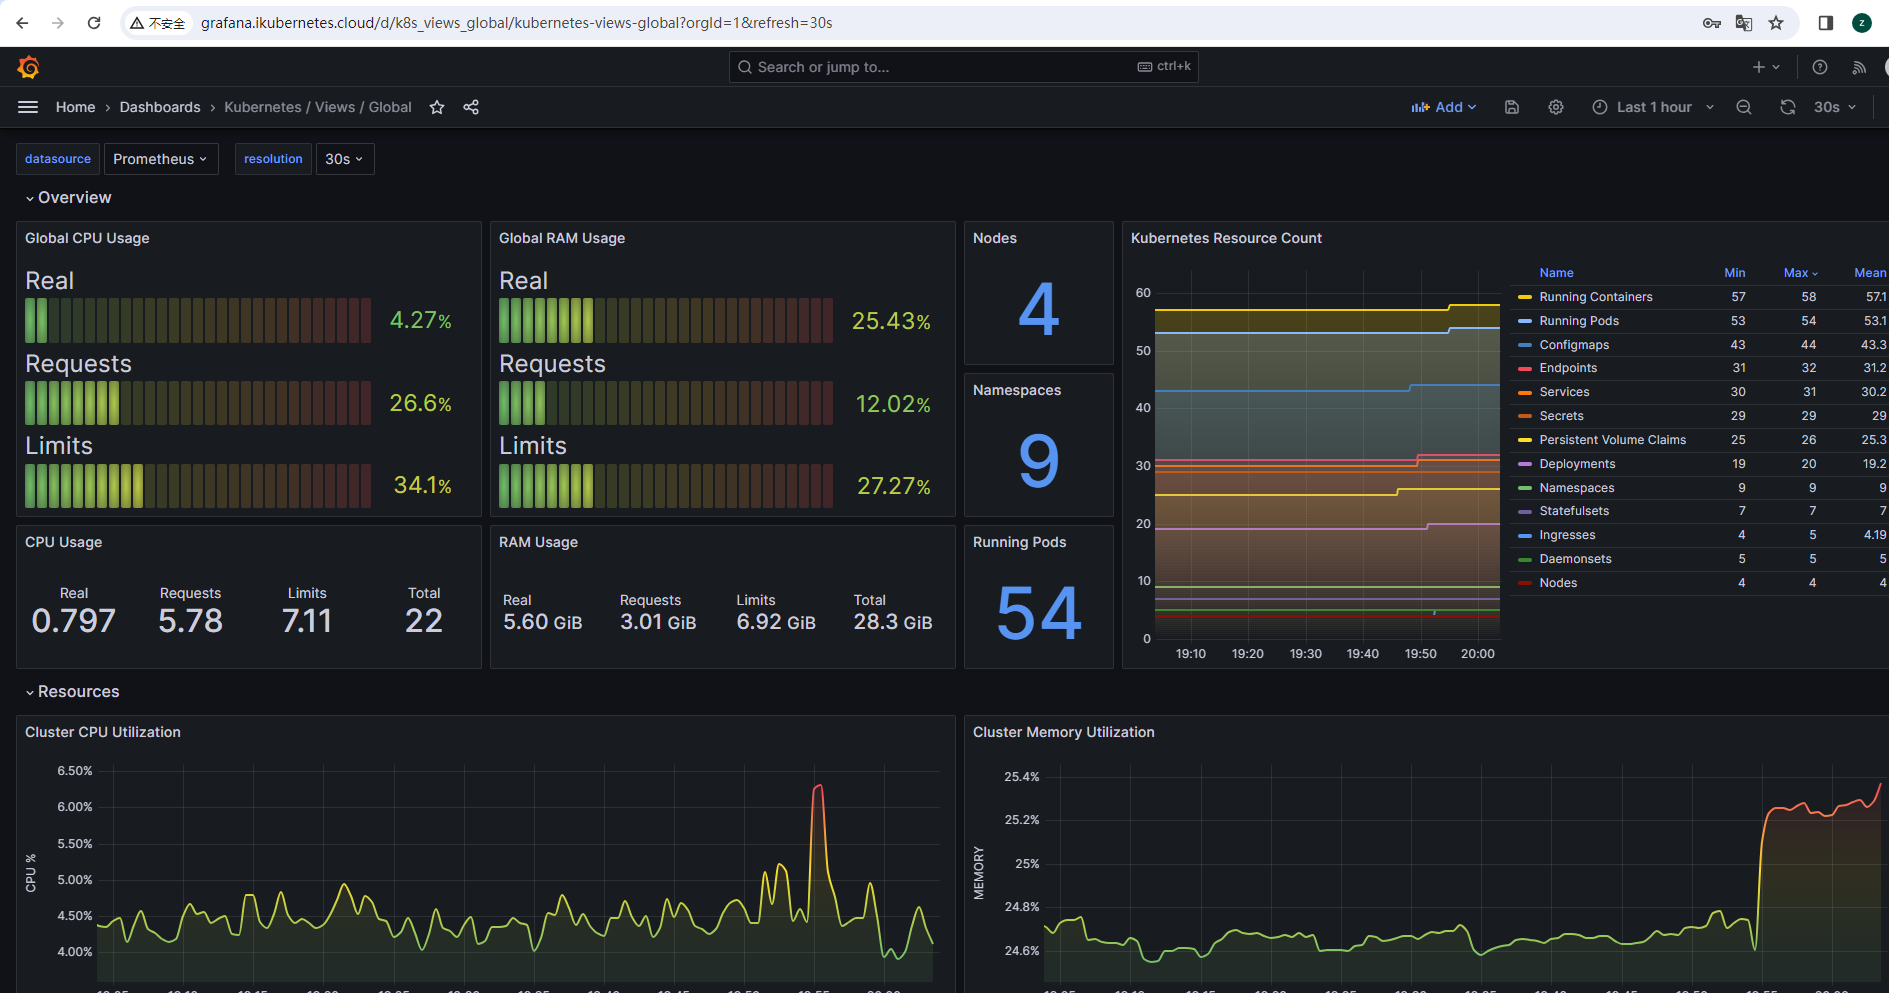
4.1 集群层面监控
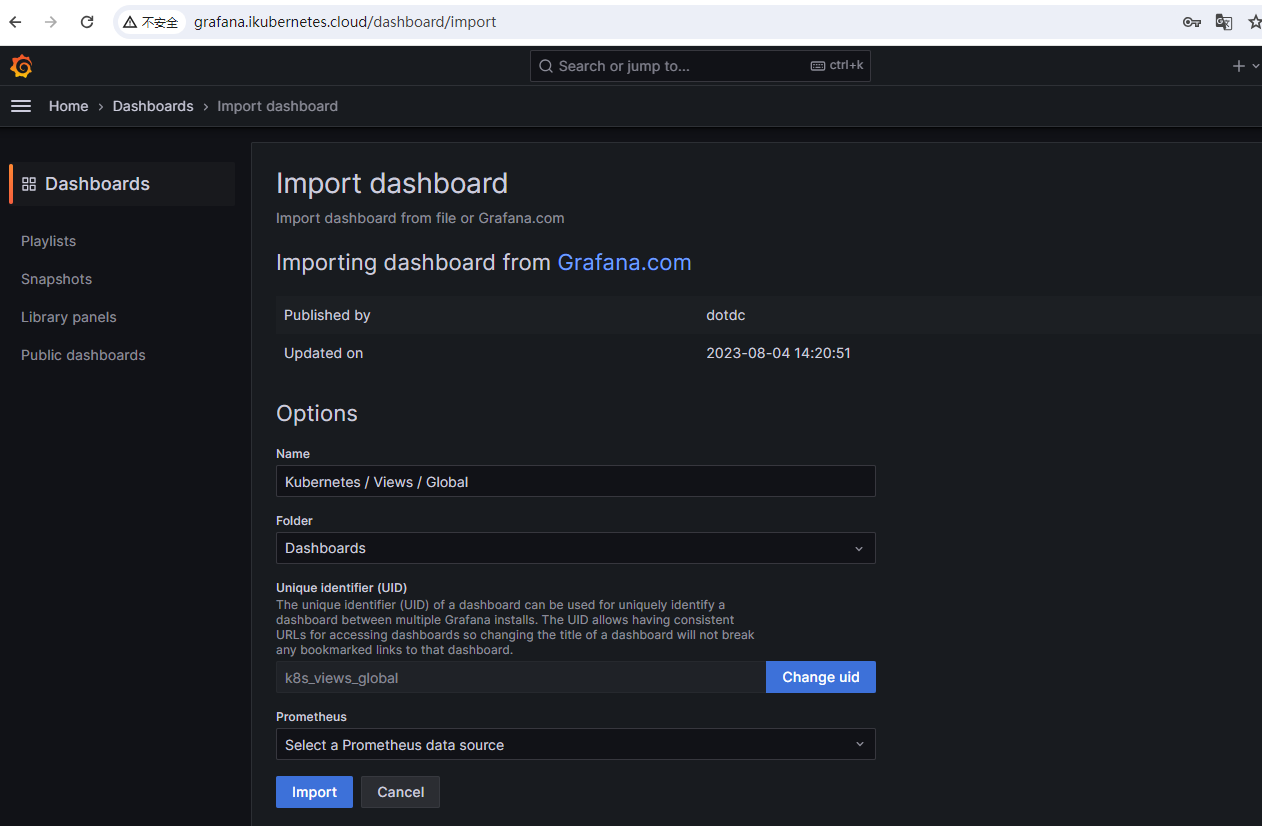
导入大盘:Create --> Import
- Kubernetes / Views / Global :15757
  - [node_cpu_core_throttles_total ignores second thread of hyperthreading systems · Issue #1472 · prometheus/node_exporter (github.com)](https://github.com/prometheus/node_exporter/issues/1472)

- Kubernetes / Views / Nodes  :15759
- Kubernetes / Views / Namespaces :15758
- Kubernetes / Views / Pods :15760
- Kubernetes Deployment Statefulset Daemonset metrics  :8588
4.2、域名层面
域名:9965

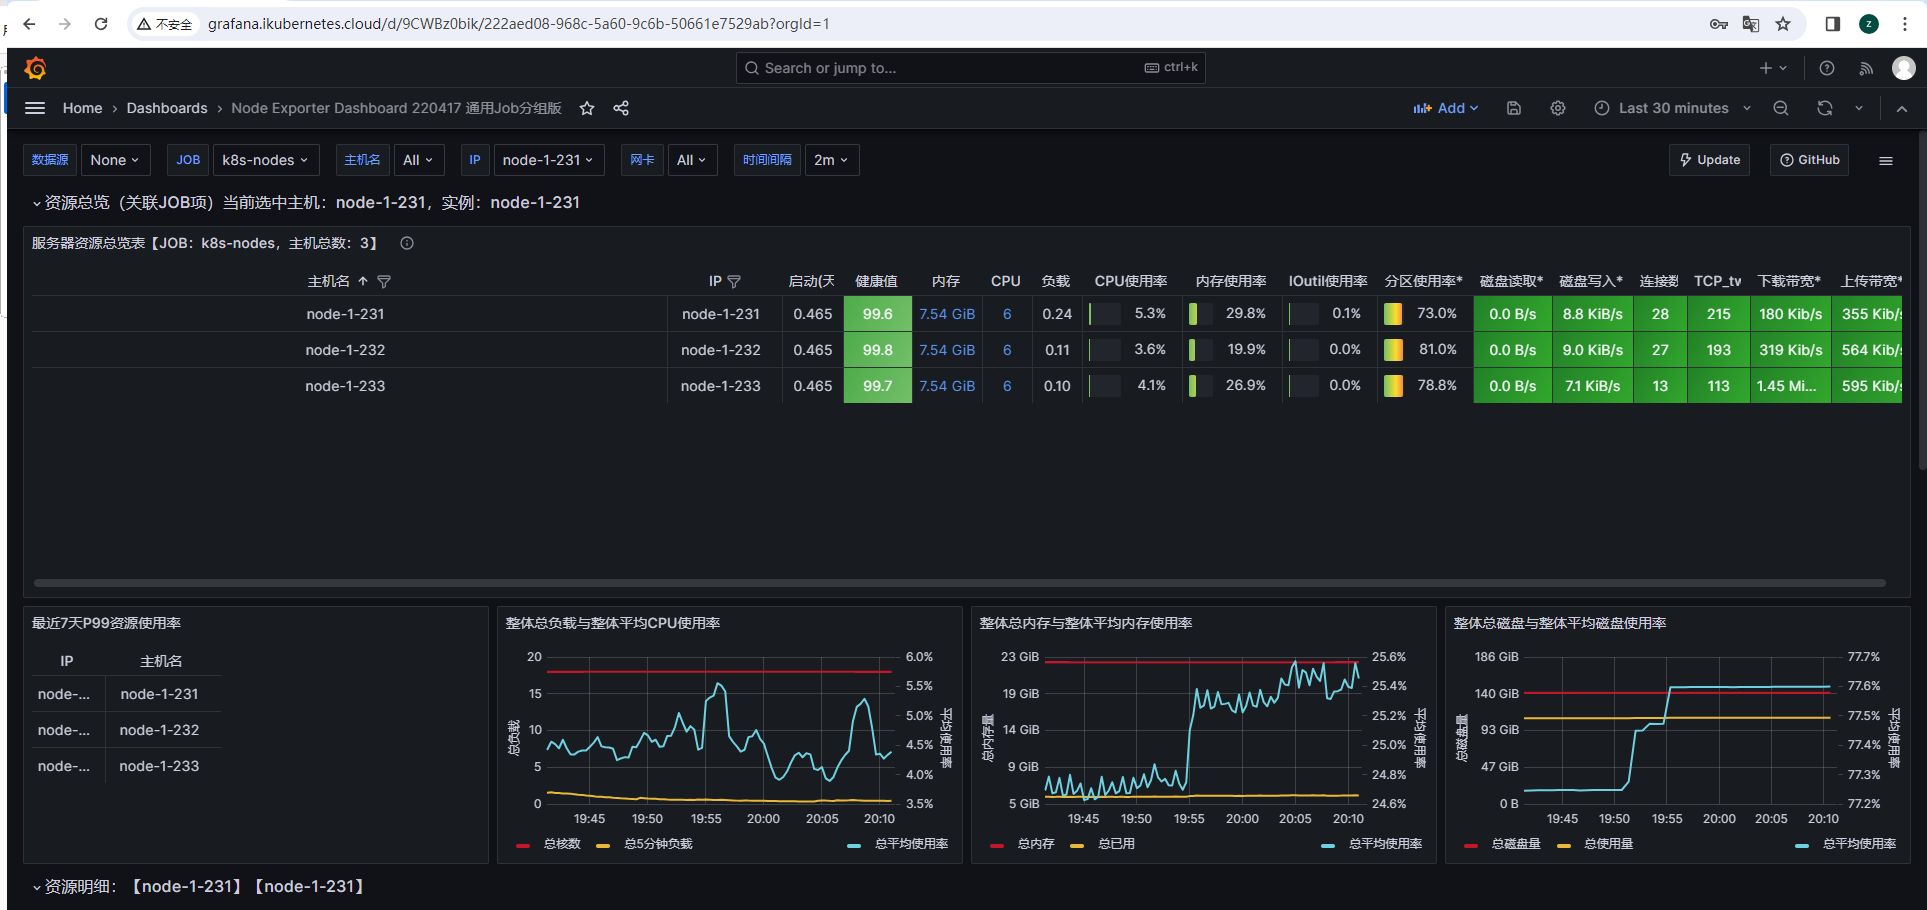
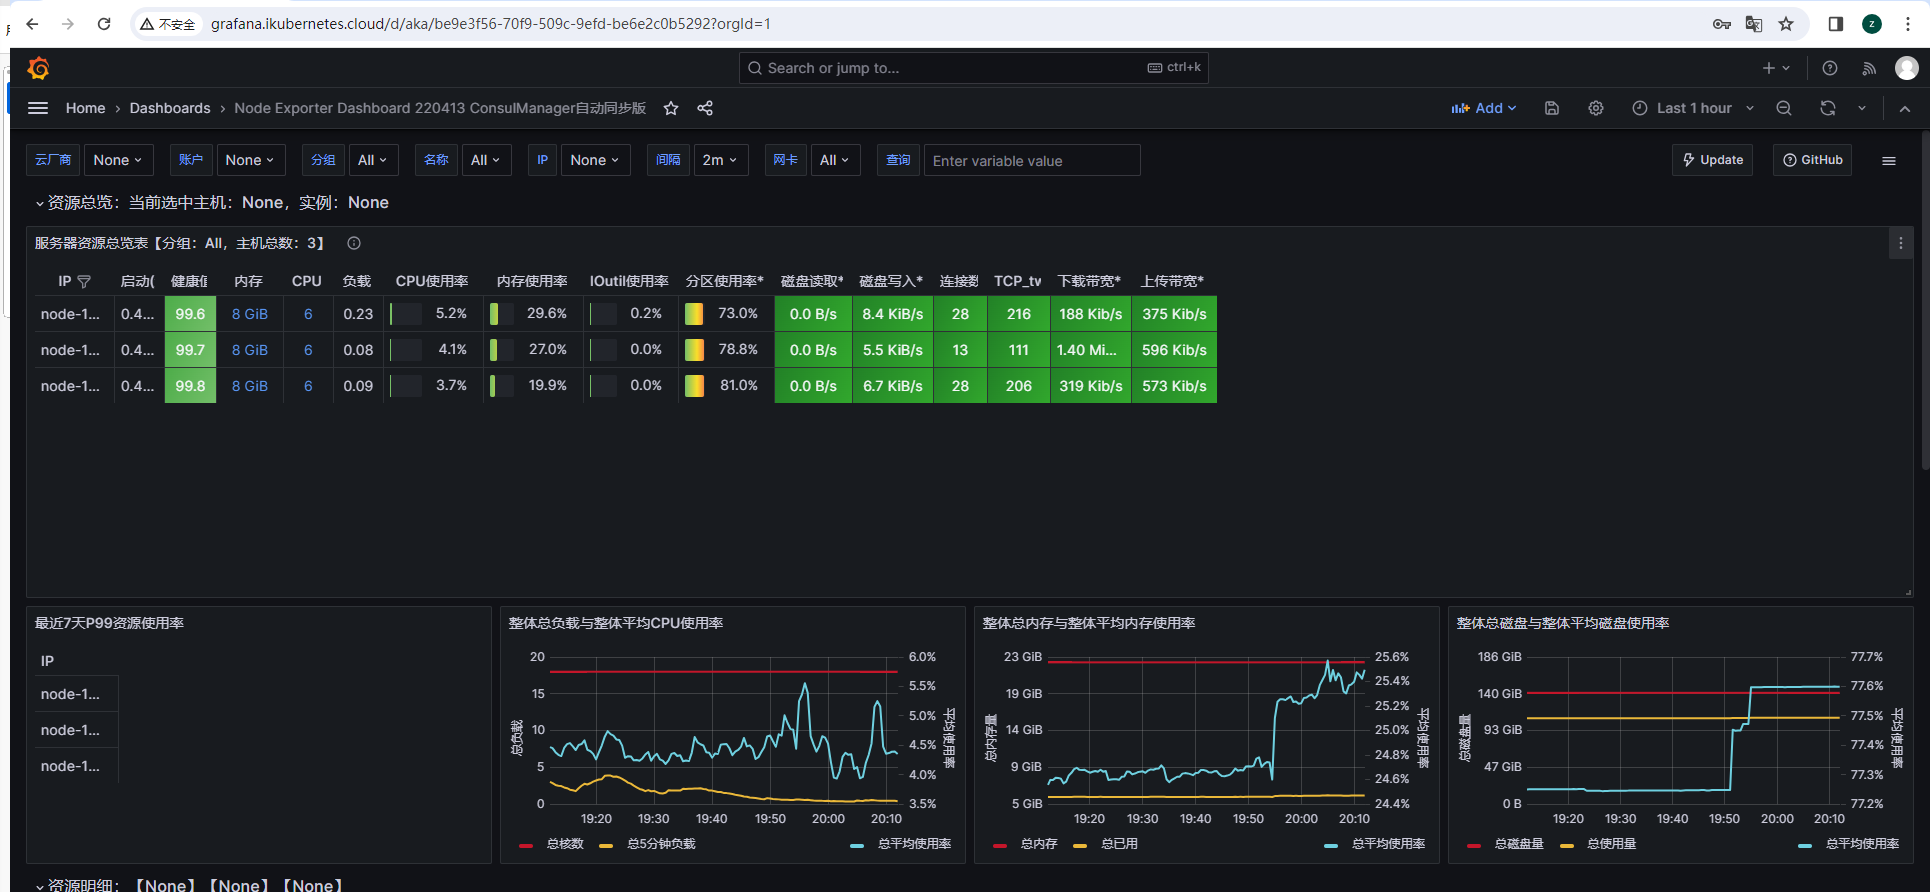
4.3、主机层面
主机:
7.12-Prometheus Operator部署管理
1、Prometheus Operator & Kube-Prometheus & Helm chart 部署区别
- Prometheus Operator 是 Kubernetes 原生的工具,它通过将 Prometheus 资源定义为 Kubernetes 对象(CRD)来简化 Prometheus 集群的管理。它自动化了在Kubernetes 中配置和扩展 Prometheus 实例时涉及的常见任务,并提供了在Kubernetes 环境中部署、配置和管理 Prometheus 的简单方式。
1、通过 kubectl 或 Kubernetes API 创建 Prometheus Operator CustomResource Definition (CRD)。
2、使用 kubectl 或 YAML 文件创建 Prometheus 实例的定义。
3、Prometheus Operator 观察配置更改并创建、更新或删除 Prometheus 实例。
4、官方安装文档: https://prometheus-operator.dev/docs/user-guides/getting-started/ 需要Kubernetes版本至少在v1.16.x以上。
5、官方Github地址:https://github.com/prometheus-operator/prometheus-operator - kube-prometheus 提供基于Prometheus & Prometheus Operator完整的集群监控配置示例,包括多实例Prometheus & Alertmanager部署与配置及node exporter的metrics采集,以及scrape Prometheus target各种不同的metricsendpoints,并提供Alerting rules一些示例,触发告警集群潜在的问题。
1. 使用 YAML 文件或 Helm chart 安装 Kube-Prometheus。
2. Kube-Prometheus 部署 Prometheus、Alertmanager、Grafana 和Pushgateway 等组件。
3. 使用 Prometheus Operator 观察和管理 Prometheus 和相关组件。
4. 官方安装文档:https://prometheus-operator.dev/docs/prologue/quick-start/
5. 安装要求:https://github.com/prometheus-operator/kube-prometheus#compatibility
6. 官方Github地址:https://github.com/prometheus-operator/kube-prometheus - helm chart prometheus-community/kube-prometheus-stack 提供类似kubeprometheus的功能,但是该项目是由Prometheus-community来维护。
1. 安装 Helm 并添加 Prometheus Helm chart 存储库。
2. 使用 Helm 安装 Prometheus chart,包括 Prometheus、Alertmanager和 Pushgateway 等组件。
具体信息参考https://github.com/prometheus-community/helm-charts/tree/main/charts/kube-prometheus-stack#kube-prometheus-stack
总结:三者部署 Prometheus 的区别
- Prometheus Operator 可以更加自动化的管理 Prometheus 集群;
- Kube-Prometheus 则提供了更加全面的监控解决方案,包括 Prometheus、Grafana 和 Alertmanager 等组件;
- Helm chart 则通过一个命令即可快速部署 Prometheus 及其相关组件,但无法方便地进行各个组件的管理。
Kube-Prometheus:目前是k8s集群监控的主流项目,主要使用Prometheus做集群监控,使用Prometheus Operator做监控的运维管理,也就是以上二者的结合。
2、Prometheus-Operator CRD资源
2.1、CRD 全称是 Custom Resource Definition
什么是 CRD?
以 Deployment 为实例,Deployment 没有直接创建 Pod,而是管理 RS,而 RS 管理Pod,这就是控制器模式。控制器模式允许基于已有的资源定义更高阶的控制器,用来实现更复杂的能力。

特点:
- CRD 本身是 Kubernetes 的一种资源,允许用户自定义新的资源类型;
- CRD 允许用户基于已有的 Kubernetes 资源,例如 Deployment、Configmap 等,拓展集群能力;
- CRD 可以自定义一套成体系的规范,自造概念;
CRD 本身是一种 Kubernetes 内置的资源类型,即自定义资源的定义,用于描述用户定义的资源是什么样子。
[root@master-1-230 7.11]# kubectl  get crd
NAME                                                  CREATED AT
addresspools.metallb.io                               2023-11-12T13:12:41Z
bfdprofiles.metallb.io                                2023-11-12T13:12:41Z
bgpadvertisements.metallb.io                          2023-11-12T13:12:41Z
bgpconfigurations.crd.projectcalico.org               2023-11-10T16:31:36Z
bgppeers.crd.projectcalico.org                        2023-11-10T16:31:36Z
bgppeers.metallb.io                                   2023-11-12T13:12:41Z
blockaffinities.crd.projectcalico.org                 2023-11-10T16:31:36Z
caliconodestatuses.crd.projectcalico.org              2023-11-10T16:31:36Z
cephblockpools.ceph.rook.io                           2023-11-27T12:08:00Z
cephclusters.ceph.rook.io                             2023-11-27T12:08:00Z
cephfilesystems.ceph.rook.io                          2023-11-27T12:08:00Z
clusterinformations.crd.projectcalico.org             2023-11-10T16:31:37Z
communities.metallb.io                                2023-11-12T13:12:41Z
felixconfigurations.crd.projectcalico.org             2023-11-10T16:31:37Z
globalnetworkpolicies.crd.projectcalico.org           2023-11-10T16:31:37Z
globalnetworksets.crd.projectcalico.org               2023-11-10T16:31:37Z
hostendpoints.crd.projectcalico.org                   2023-11-10T16:31:37Z
ipaddresspools.metallb.io                             2023-11-12T13:12:41Z
ipamblocks.crd.projectcalico.org                      2023-11-10T16:31:37Z
ipamconfigs.crd.projectcalico.org                     2023-11-10T16:31:37Z
ipamhandles.crd.projectcalico.org                     2023-11-10T16:31:37Z
ippools.crd.projectcalico.org                         2023-11-10T16:31:37Z
ipreservations.crd.projectcalico.org                  2023-11-10T16:31:37Z
kubecontrollersconfigurations.crd.projectcalico.org   2023-11-10T16:31:37Z
l2advertisements.metallb.io                           2023-11-12T13:12:41Z
networkpolicies.crd.projectcalico.org                 2023-11-10T16:31:37Z
networksets.crd.projectcalico.org                     2023-11-10T16:31:37Z
2.2、Prometheus-Operator CRD
Prometheus Operator 的本职就是一组用户自定义的CRD 资源以及Controller 的实现, Prometheus Operator 负责监听这些自定义资源的变化,并且根据这些资源的定
义自动化的完成如Prometheus Server 自身以及配置的自动化管理工作。主要包括以下几个功能:
- Kubernetes 自定义资源:使用 Kubernetes CRD 来部署和管理 Prometheus、Alertmanager 和相关组件。
- 简化的部署配置:直接通过 Kubernetes 资源清单配置 Prometheus,比如版本、持久化、副本、保留策略等等配置。
- Prometheus 监控目标配置:基于熟知的 Kubernetes 标签查询自动生成监控目标配置,无需学习 Prometheus 特地的配置。
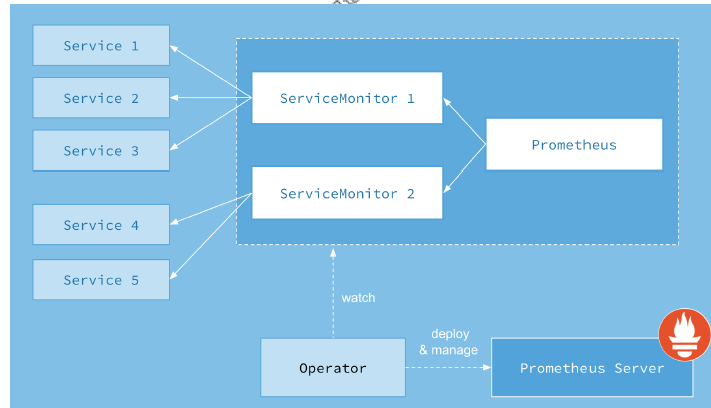
上面架构图中,各组件以不同的方式运行在 Kubernetes 集群中(之前都是用配置文件来配置,现在都是通过资源对象):
| CDR名称 | 作用 |
3 部署 Kube-Prometheus
3.1 概述
kube-prometheus 是一整套监控解决方案,它使用 Prometheus 采集集群指标,Grafana 做展示,包含如下组件:
- The Prometheus Operator
- Highly available Prometheus
- Highly available Alertmanager
- Prometheus node-exporter
- Prometheus Adapter for Kubernetes Metrics APIs (k8s-prometheusadapter)
- kube-state-metrics
- Grafana
注意:kube-promethues与kubernetes的版本对应关系如下:
Compatibility
The following Kubernetes versions are supported and work as we test against these versions in their respective branches. But note that other versions might work!
| kube-prometheus stack | Kubernetes 1.22 | Kubernetes 1.23 | Kubernetes 1.24 | Kubernetes 1.25 | Kubernetes 1.26 | Kubernetes 1.27 | Kubernetes 1.28 |
|---|---|---|---|---|---|---|---|
release-0.10 |
✔ | ✔ | ✗ | ✗ | x | x | x |
release-0.11 |
✗ | ✔ | ✔ | ✗ | x | x | x |
release-0.12 |
✗ | ✗ | ✔ | ✔ | x | x | x |
release-0.13 |
✗ | ✗ | ✗ | x | ✔ | ✔ | ✔ |
main |
✗ | ✗ | ✗ | x | x | ✔ | ✔ |
3.2 下载kube-Prometheus 代码
方法1:
git clone https://github.com/prometheus-operator/kube-prometheus.git
cd kube-prometheus
git branch -r	# 查看当前分支有哪些
git checkout release-0.13	# 切换到自己 Kubernetes 兼容的版本
方法2:
git clone -b release-0.13 https://github.com/prometheus-operator/kube-prometheus.git3.3
国外镜像源某些镜像无法拉取,我们这里修改prometheus-operator,prometheus,alertmanager,kube-state-metrics,node-exporter,prometheus-adapter的镜像源为国内镜像源。这里使用的是中科大的镜像源。
# 进入修改的目录
cd ./kube-prometheus/manifests/
# 镜像替换
sed -i 's/quay.io/quay.mirrors.ustc.edu.cn/g' setup/prometheus-operator-deployment.yaml
sed -i 's/quay.io/quay.mirrors.ustc.edu.cn/g' prometheus-prometheus.yaml
sed -i 's/quay.io/quay.mirrors.ustc.edu.cn/g' alertmanager-alertmanager.yaml
sed -i 's/quay.io/quay.mirrors.ustc.edu.cn/g' kube-state-metrics-deployment.yaml
sed -i 's/k8s.gcr.io/lank8s.cn/g' kube-state-metrics-deployment.yaml
sed -i 's/quay.io/quay.mirrors.ustc.edu.cn/g' node-exporter-daemonset.yaml
sed -i 's/quay.io/quay.mirrors.ustc.edu.cn/g' prometheus-adapter-deployment.yaml
sed -i 's/k8s.gcr.io/lank8s.cn/g' prometheus-adapter-deployment.yaml
# 确认一下是否还有国外镜像
grep "image: " * -r
3.4 安装operator & kube-Prometheus
创建namespace & CRD资源,如下:
setup 文件夹中包含所有自定义资源配置 CustomResourceDefinition(一般不用修改,也不要轻易修改)
# 下载prometheus-operator镜像需要花费几分钟,这里等待几分钟,直到prometheus-operator变成running状态
kubectl create -f manifests/setup
创建所有应用资源:
kubectl create -f manifests/

# 等待所有镜像变成Running状态
watch kubectl get po -n monitoring
需要关注的几个控制器文件
prometheus-adapter-deployment.yaml:kubernetes自定义监控指标
blackbox-exporter-deployment.yaml:黑盒监控控制器
kube-state-metrics-deployment.yaml:监听API Server生成有关资源对象的状态指标
setup/prometheus-operator-deployment.yaml:prometheus-operator控制器文件
prometheus-prometheus.yaml:prometheus主控制器文件
alertmanager-alertmanager.yaml:alertmanager主控制器文件
grafana-deployment.yaml:grafana主控制器文件
删除所有资源
kubectl delete --ignore-not-found=true -f manifests/ -f manifests/setup3.5 配置Ingress资源对象
cat > prometheus-all-ingress.yaml << 'EOF'
apiVersion: networking.k8s.io/v1
kind: Ingress
metadata:
  namespace: monitoring
  name: prometheus-ingress
spec:
  ingressClassName: nginx
  rules:
  - host: grafana-opera.ikubernetes.cloud  # 访问 Grafana 域名
    http:
      paths:
        - pathType: Prefix
          backend:
            service:
              name: grafana
              port:
                number: 3000
          path: /
  - host: prometheus-opera.ikubernetes.cloud  # 访问 Prometheus 域名
    http:
      paths:
        - pathType: Prefix
          backend:
            service:
              name: prometheus-k8s
              port:
                number: 9090
          path: /
  - host: alertmanager-opera.ikubernetes.cloud  # 访问 alertmanager 域名
    http:
      paths:
        - pathType: Prefix
          backend:
            service:
              name: alertmanager-main
              port:
                number: 9093
          path: /
EOF
4、访问验证:
curl prometheus-opera.ikubernetes.cloud4.2、grafana
curl grafana-opera.ikubernetes.cloud4.3、 alertmanager
curl alertmanager-opera.ikubernetes.cloud
- Prometheus 大盘 Operator 企业 7.12prometheus大盘operator企业 prometheus-operator prometheus容器operator体系 prometheus-operator servicemonitor prometheus prometheus exporter operator windows prometheus operator对象7.13 kube-prometheus prometheus operator简介 prometheus-operator集群prometheus operator prometheus-operator prometheus operator规则 alertmanager prometheus linux企业