1:下载相关组件
普罗米修斯 Prometheus
格兰发呢Granfna
export windows_exporter
mysql监控mysql_exporter
https://prometheus.io/download/
2:安装
以上下载均为windows-amd64格式
傻瓜安装
3:配置
Prometheus内的yml
localhost建议换成127.0.0.1
相关ip端口以实际为主,且注意缩进
# my global config
global:
  scrape_interval: 15s # Set the scrape interval to every 15 seconds. Default is every 1 minute.
  evaluation_interval: 15s # Evaluate rules every 15 seconds. The default is every 1 minute.
  # scrape_timeout is set to the global default (10s).

# Alertmanager configuration
alerting:
  alertmanagers:
    - static_configs:
        - targets:
          # - alertmanager:9093

# Load rules once and periodically evaluate them according to the global 'evaluation_interval'.
rule_files:
  # - "first_rules.yml"
  # - "second_rules.yml"

# A scrape configuration containing exactly one endpoint to scrape:
# Here it's Prometheus itself.
scrape_configs:
  # The job name is added as a label `job=<job_name>` to any timeseries scraped from this config.
  - job_name: "prometheus"

    # metrics_path defaults to '/metrics'
    # scheme defaults to 'http'.

    static_configs:
      - targets: ["127.0.0.1:9090"]

  - job_name: "127.0.0.1:windows-exporter"
    static_configs:
      - targets: ["127.0.0.1:9182"]

  - job_name: "127.0.0.1:mysql-exporter"
    static_configs:
      - targets: ["127.0.0.1:9104"]


   # 指定 springboot name标签
  - job_name: "mqtest"
   # 设定metrics 的路径
    metrics_path: "/actuator/prometheus"
    static_configs:
    # 配置目标关联 host,如果是本机的话,建议用  内网ip,而不用 localhost;
    - targets: ['127.0.0.1:9001']
mysql_exporter下载后无配置cnf需自己新建
[client]
host=127.0.0.1
port=3308
user=root
password=Qwfz11g123sda1dsdLja9cZ95
4:启动
Prometheus
以管理员身份运行 prometheus.exe 启动prometheus,任务栏会新增一个黑窗口(不要关闭)
浏览器打开http://127.0.0.1:9090/targets,prometheus状态为up
Granfna
浏览器打开 http://127.0.0.1:3000(默认账号密码都是admin),远程访问用 ip:3000 :
windows_exporter
http://127.0.0.1:9182/metrics
5:创建数据源

6:导入仪表盘
提前下载json或者查好id
https://grafana.com/grafana/dashboards/10467-windows-exporter-for-prometheus-dashboard-cn-v20230531/?tab=revisions

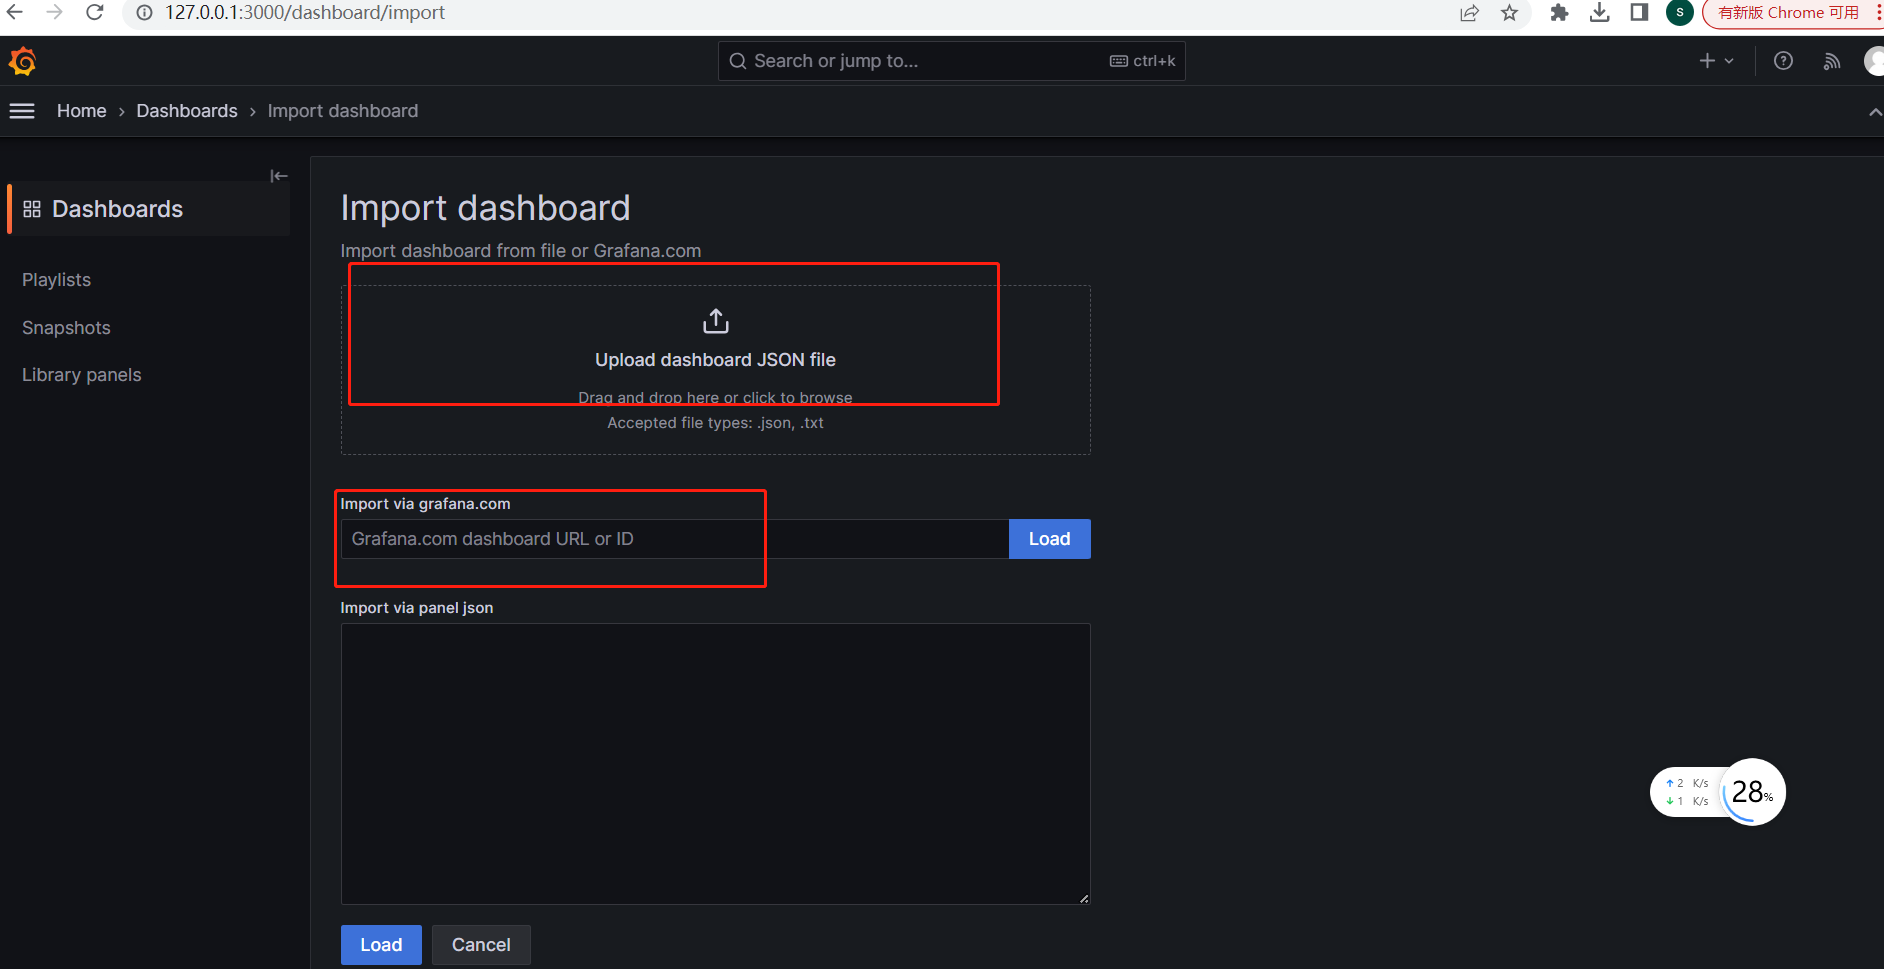
load好之后注意选择数据源
之后就可以展示了
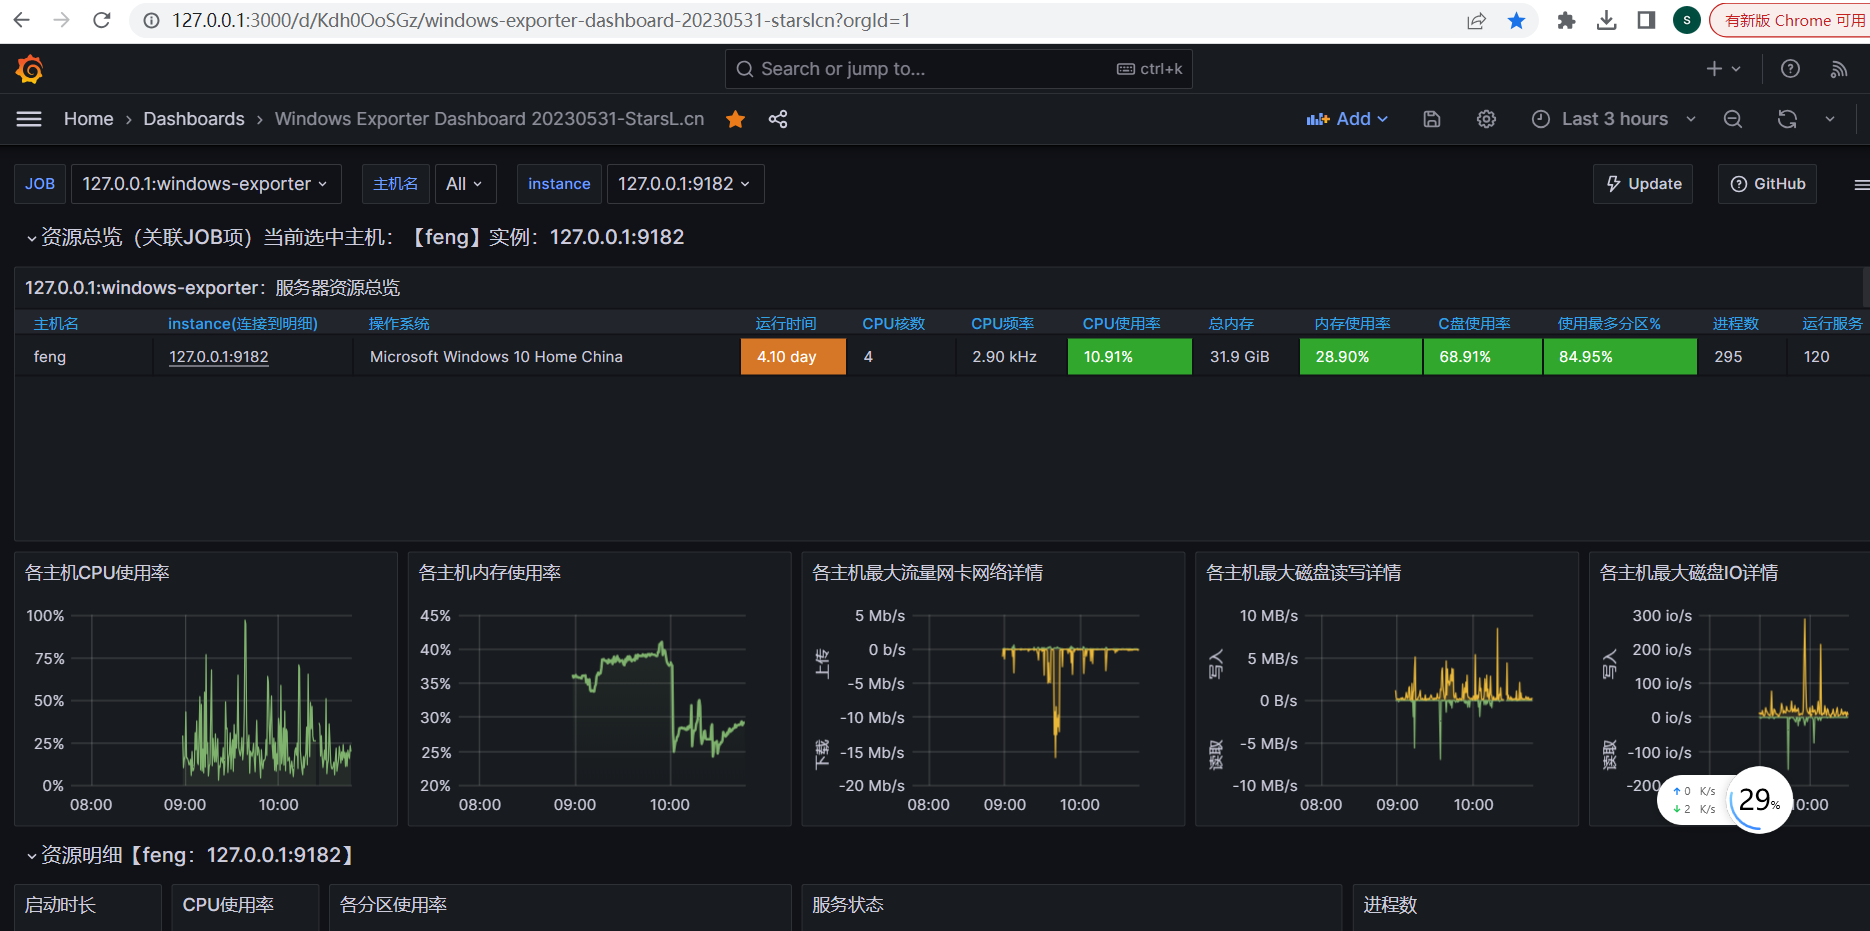
mysql同windows_export
- windows windows-exporter Prometheus exporter Granfnawindows windows-exporter prometheus exporter windows-exporter prometheus exporter operator windows mysql_exporter prometheus exporter windows prometheus-node_exporter blackbox_exporter prometheus blackbox exporter elasticsearch prometheus dashboard exporter prometheus-node_exporter prometheus exporter node_exporter prometheus exporter grafana node-exporter prometheus exporter grafana