Kubernetes学习目录
1、安装python环境
1.1、下载python软件
wget https://www.python.org/ftp/python/3.9.16/Python-3.9.16.tgz
1.2、安装依赖包
yum install gcc gcc-c++ glibc-devel glibc zlib-devel zlib openssl-devel openssl sqlite-devel readline-devel bzip2-devel libffi-devel -y
1.3、编译安装软件
tar xvf Python-3.9.16.tgz && cd Python-3.9.16 && ./configure --prefix=/usr/local/Python-3.9.16 --with-ssl && make && make install
ln -s /usr/local/Python-3.9.16 /usr/local/python3
1.4、配置Python动态链接库
cat >/etc/ld.so.conf.d/Python-3.9.16.conf <<'EOF'
/usr/local/python3/lib/
EOF
ldconfig
1.5、配置环境变量
cat > /etc/profile.d/Python-3.9.16.sh <<'EOF'
#!/bin/bash
export PYTHON_HOME=/usr/local/python3
export PATH=$PATH:${PYTHON_HOME}/bin
EOF
source /etc/profile.d/Python-3.9.16.sh
1.6、配置pip下载源
cd ~ && mkdir .pip && cat > .pip/pip.conf <<'EOF'
[global]
index-url = https://pypi.tuna.tsinghua.edu.cn/simple
[install]
trusted-host=pypi.douban.com
EOF
1.7、配置虚拟环境
1.7.1、安装软件
pip3 install virtualenv
pip3 install --no-deps stevedore virtualenvwrapper
1.7.2、配置环境变量
mkdir /data//venv
echo 'export WORKON_HOME=/data/venv' >> .bashrc
echo 'export VIRTUALENVWRAPPER_PYTHON=/usr/local/python3/bin/python3' >> .bashrc
echo 'export VIRTUALENVWRAPPER_VIRTUALENV=/usr/local/python3/bin/virtualenv' >> .bashrc
echo 'source /usr/local/python3/bin/virtualenvwrapper.sh' >> .bashrc
source .bashrc

注意:virtualenv 和 virtualenvwrapper.sh 的路径位置
1.7.3、创建虚拟环境
mkvirtualenv -p python3 flask_env
pip install flask prometheus_client
pip list

# 关于虚拟环境管理,请看文章:https://www.cnblogs.com/ygbh/p/17305785.html
2、部署Flask项目代码
2.1、拷贝代码
mkdir /opt/my_metrics && cd /opt/my_metrics/
cat > my_metric.py <<'EOF'
# -*- coding: utf-8 -*-
"""
   File Name : flask_metric
   Description :
   Author : Administrator
   date : 2023/4/10
   Change Activity : 2023/4/10:
"""
from prometheus_client import Counter, Summary, start_http_server
from wsgiref.simple_server import make_server

from flask import Flask, jsonify

app = Flask(__name__)

request_time = Summary('request_processing_seconds', 'Time spent processing request')  # 请求时间的记录
counter_time = Counter('request_count', 'Total request cout of the host', ['method', 'endpoint'])  # 请求数量+标签统计
counter_time.labels('get', '/').inc()


@app.route('/metrics')
@request_time.time()
def requests_count():
    counter_time.labels('get', '/').inc()
    return jsonify({'return': 'success OK!'})


if __name__ == '__main__':
    start_http_server(8000)
    httpd = make_server('0.0.0.0', 8001, app)
    httpd.serve_forever()
EOF
2.2、进入虚拟环境跑起代码
(flask_env) [root@register ~]# python3 /opt/my_metrics/my_metric.py &

# 注意:本代码,开启两个端口:8000和8001
8000 是prometheus_client端口,用于被prometheus捉取数据的
8001 是flask接口,用到我们测试访问次数递增之用。
2.3、访问prometheus_client端口8000
(flask_env) [root@register ~]# curl http://192.168.10.33:8000/metric
# HELP python_gc_objects_collected_total Objects collected during gc
# TYPE python_gc_objects_collected_total counter
python_gc_objects_collected_total{generation="0"} 105.0
python_gc_objects_collected_total{generation="1"} 280.0
python_gc_objects_collected_total{generation="2"} 0.0
# HELP python_gc_objects_uncollectable_total Uncollectable object found during GC
# TYPE python_gc_objects_uncollectable_total counter
python_gc_objects_uncollectable_total{generation="0"} 0.0
python_gc_objects_uncollectable_total{generation="1"} 0.0
python_gc_objects_uncollectable_total{generation="2"} 0.0
# HELP python_gc_collections_total Number of times this generation was collected
# TYPE python_gc_collections_total counter
python_gc_collections_total{generation="0"} 74.0
python_gc_collections_total{generation="1"} 6.0
python_gc_collections_total{generation="2"} 0.0
# HELP python_info Python platform information
# TYPE python_info gauge
python_info{implementation="CPython",major="3",minor="9",patchlevel="16",version="3.9.16"} 1.0
# HELP process_virtual_memory_bytes Virtual memory size in bytes.
# TYPE process_virtual_memory_bytes gauge
process_virtual_memory_bytes 4.66591744e+08
# HELP process_resident_memory_bytes Resident memory size in bytes.
# TYPE process_resident_memory_bytes gauge
process_resident_memory_bytes 2.4743936e+07
# HELP process_start_time_seconds Start time of the process since unix epoch in seconds.
# TYPE process_start_time_seconds gauge
process_start_time_seconds 1.6811862109e+09
# HELP process_cpu_seconds_total Total user and system CPU time spent in seconds.
# TYPE process_cpu_seconds_total counter
process_cpu_seconds_total 0.19
# HELP process_open_fds Number of open file descriptors.
# TYPE process_open_fds gauge
process_open_fds 7.0
# HELP process_max_fds Maximum number of open file descriptors.
# TYPE process_max_fds gauge
process_max_fds 1024.0
# HELP request_processing_seconds Time spent processing request
# TYPE request_processing_seconds summary
request_processing_seconds_count 0.0
request_processing_seconds_sum 0.0
# HELP request_processing_seconds_created Time spent processing request
# TYPE request_processing_seconds_created gauge
request_processing_seconds_created 1.6811862113408284e+09
# HELP request_count_total Total request cout of the host
# TYPE request_count_total counter
request_count_total{endpoint="/",method="get"} 1.0
# HELP request_count_created Total request cout of the host
# TYPE request_count_created gauge
request_count_created{endpoint="/",method="get"} 1.681186211340873e+09
2.4、编写自动随机访问flask 8000的端口的shell脚本
cd /opt/my_metrics/ && cat > curl_metrics.sh<<'EOF'
#!/bin/bash
# 获取随机数
while true
do
  sleep_num=$(($RANDOM%5+1))
  curl_num=$(($RANDOM%50+1))
  for c_num in `seq $curl_num`
  do
    curl -s http://192.168.10.33:8001/metrics >>/dev/null 2>&1
  done
  sleep $sleep_num
done
EOF
3、将自定义metric增加到prometheus
3.1、配置prometheus.yml
]# vi /data/server/prometheus/etc/prometheus.yml
scrape_configs:- job_name: "prometheus"
    static_configs:
      - targets: ["localhost:9090"]
  - job_name: "node_exporter"
    static_configs:
    - targets: ['192.168.10.29:9100','192.168.10.30:9100']

# 增加如下配置
  - job_name: "custom_metric"
    static_configs:
    - targets: ['192.168.10.33:8000']
3.2、检查语法是否正常
]# promtool check config /data/server/prometheus/etc/prometheus.yml
Checking /data/server/prometheus/etc/prometheus.yml
 SUCCESS: /data/server/prometheus/etc/prometheus.yml is valid prometheus config file syntax
3.3、重启prometheus服务
systemctl restart prometheus
3.4、到web查询target状态
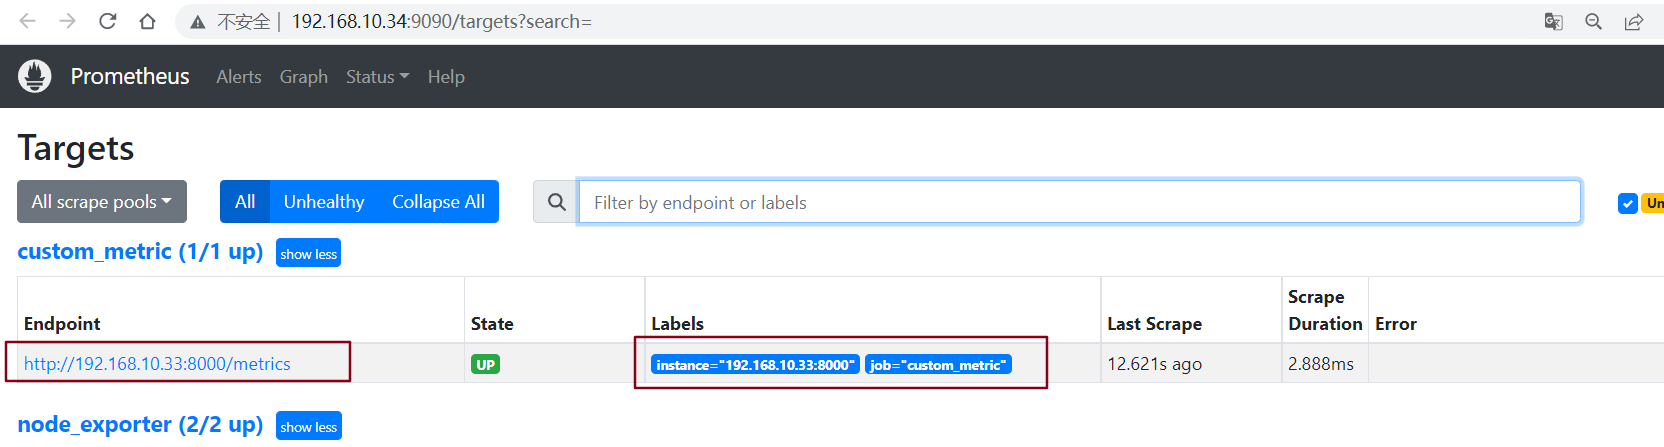
3.5、查询指标值
request_count_total{instance="192.168.10.33:8000"}
在prometheus上面可以看到正常的数据收集。

4、总结
metric基础
   - prometheus管理数据的核心要点
   - 必须由服务端提供标准接口
定制metric
   - 借助于接口开发模块进行定制开发
prometheus集成
   - job配置、重启服务、数据监测