注解
import matplotlib.pyplot as plt
import numpy as np

x = np.linspace(-3,3,50)
y = 2*x+1

plt.figure(num=1,figsize=(8,5),)
plt.plot(x,y,)

ax = plt.gca()
ax.spines['right'].set_color('none')
ax.spines['top'].set_color('none')
ax.xaxis.set_ticks_position('bottom')
ax.spines['bottom'].set_position(('data',0))
ax.yaxis.set_ticks_position('left')
ax.spines['left'].set_position(('data',0))

# 设置点的坐标
x0 = 1
y0 = 2*x0+1
# scatter 用于绘制散点图(绘制一个点或多个点)
# s代表点的大小,color代表点的颜色
plt.scatter(x0,y0,s=50,color='blue')
# [x0,x0][y0,0]代表通过x0,y0和x0,0两点来生成一条直线
# k-- 代表颜色时黑色,其样式为虚线
# lw代表线宽度
plt.plot([x0,x0],[y0,0],'k--',lw=2.5)

# 如何使用annotations?

# method 1
#####################
# 第一个参数代表内容
# 第二个参数代表要解释的点
# 第三个参数代表解释的坐标点以data格式为基准。(类似于移动坐标轴的data)
# 第四个参数代表要解释的文本所显示的位置
# 第五个参数一般配合第四个参数使用,代表文本所显示的位置,以offset points 格式为基准。
# 代表文本以解释的点为基准,在该点的基础上x偏移+30,y偏移-30。
# 注意这里偏移量+30 -30 并不是以data格式为基准,因此不是在坐标轴上进行平移
# 第六个参数代表文字大小
# 第七个参数代表设置箭头(用箭头指向要解释的点)
# 设置箭头需要使用dict来定义箭头格式(arrowstyle代表使用哪种格式的箭头,connectionstyle代表该箭头的弧度样式和圆角)
plt.annotate(r'$2x+1=%s$' % y0,xy=(x0,y0),xycoords='data',xytext=(+30,-30),textcoords='offset points',
             fontsize=16,arrowprops=dict(arrowstyle='->',connectionstyle='arc3,rad=0.2'))

# method 2
#####################
# 第一个,二个参数代表文本显示的位置,data格式
# 第三个参数代表显示的内容 \mu\ 代表μ、sigma_i 代表σ且下标为i
# 第四个参数代表字体样式,以字典形式给出。

plt.text(-3.7,3,r'$This\ is\ the\ some\ text.\ \mu\ \sigma_i\ \alpha_t$',
         fontdict={'size':16,'color':'r'})
plt.show()

    import matplotlib.pyplot as plt
    # plt.annotate(str, xy=data_point_position, xytext=annotate_position,
    #              va="center",  ha="center", xycoords="axes fraction",
    #              textcoords="axes fraction", bbox=annotate_box_type, arrowprops=arrow_style)
    # str是给数据点添加注释的内容,支持输入一个字符串
    # xy=是要添加注释的数据点的位置
    # xytext=是注释内容的位置
    # bbox=是注释框的风格和颜色深度,fc越小,注释框的颜色越深,支持输入一个字典
    # va="center",  ha="center"表示注释的坐标以注释框的正中心为准,而不是注释框的左下角(v代表垂直方向,h代表水平方向)
    # xycoords和textcoords可以指定数据点的坐标系和注释内容的坐标系,通常只需指定xycoords即可,textcoords默认和xycoords相同 axes fraction 代表原点在xy轴的左下角
    figure fraction 代表原点在整个figure的左下角
    # arrowprops可以指定箭头的风格支持,输入一个字典
    # plt.annotate()的详细参数可用__doc__查看,如:print(plt.annotate.__doc__)
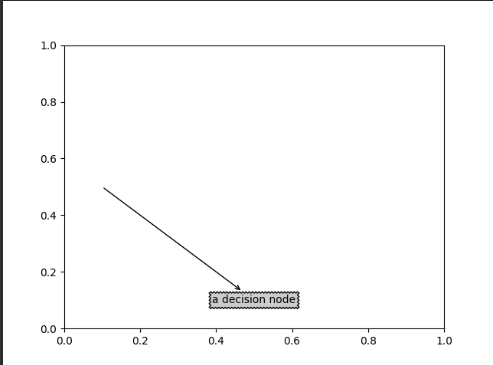
import matplotlib.pyplot as plt

# facecolor 代表背景颜色
fig = plt.figure(1,facecolor='white')
# 代表清空图像
fig.clf()
plt.annotate('a decision node',(0.1,0.5),(0.5,0.1),va='center',ha='center',
             xycoords='axes fraction', textcoords='axes fraction', bbox=dict(boxstyle='sawtooth',fc='0.8'),arrowprops=dict(arrowstyle='<-'))
plt.show()
import matplotlib.pyplot as plt

# facecolor 代表背景颜色
fig = plt.figure(1,facecolor='white')
# 代表清空图像
fig.clf()
# 更改了注解的坐标基准
plt.annotate('a decision node',(0.1,0.5),(0.5,0.1),va='center',ha='center',
             xycoords='axes fraction', textcoords='figure fraction', bbox=dict(boxstyle='sawtooth',fc='0.8'),arrowprops=dict(arrowstyle='<-'))
plt.show()

注:本博客的部分内容来自于:https://blog.csdn.net/watermelon12138/article/details/88375823