# encode=utf-8
import numpy as np
import matplotlib.pyplot as plt
from docx import Document
from docx.shared import Inches
from wordcloud import WordCloud
def func(pct, allvals):
absolute = int(np.round(pct / 100. * np.sum(allvals)))
return f"{pct:.1f}%\n({absolute:d})"
# class Chart:
# def __init__(self, title, xlabel, ylabel):
# self.title = title
# self.xlabel = xlabel
# self.ylabel = ylabel
# self.data = []
#
# def add_data(self, x, y):
# self.data.append((x, y))
#
# def plot(self):
# fig, ax = plt.subplots()
# for x, y in self.data:
# ax.plot(x, y)
# plt.title(self.title)
# plt.xlabel(self.xlabel)
# plt.ylabel(self.ylabel)
# plt.tight_layout()
# plt.savefig('chart.png')
#
#
# class DocumentWithCharts:
# def __init__(self):
# self.document = Document()
# '''
# 添加封面图
# '''
# def add_pic(self, image_path):
# self.document.add_picture(image_path, width=Inches(5.0), height=Inches(3.0))
#
# def add_paragraph(self,text):
# self.document.add_paragraph(text)
#
# def add_heading(self,text):
# self.document.add_heading(text)
#
# def add_table(self,rows,cols):
# self.document.add_table(rows,cols)
#
# def add_chart(self, chart):
# self.document.add_heading(chart.title, level=0)
# # self.document.add_paragraph('This is a chart generated using Matplotlib.')
# chart.plot()
# self.document.add_picture('chart.png', width=Inches(6))
#
# def add_page_break(self):
# self.document.add_page_break()
#
# def save(self, filename):
# self.document.save(filename)
document = Document()
# 添加封面图
image_path ='./xt.jpg'
document.add_picture(image_path, width=Inches(5.0), height=Inches(3.0))
# 添加大标题
document.add_heading('无敌潇洒测试')
# 添加空段落
document.add_paragraph()
# 添加有序段落
document.add_paragraph('信息综述',style='List Number')
# 添加综述
fx_content = '本周期内,共监测到关于 正负面报告 的互联网信息数量为 4819 篇,监测到正面信息 331 篇,占比 6.87% ,中性信息 3527 篇,占比 73.19% ,负面信息 961 篇,占比 19.94%。'
document.add_paragraph(fx_content)
# 添加饼图
fig, ax = plt.subplots(figsize=(6, 3), subplot_kw=dict(aspect="equal"))
recipe = ["60 negativity",
"75 neutral",
"250 positive"
]
data = [float(x.split()[0]) for x in recipe]
ingredients = [x.split()[-1] for x in recipe]
colors = ['red', 'gray', 'green']
wedges, texts, autotexts = ax.pie(data,
autopct=lambda pct: func(pct, data), #自动添加百分比显示
textprops=dict(color="w"), # 设置标签里的字体大小,颜色属性
colors=colors #饼状填充的颜色
)
ax.legend(wedges, ingredients,
title="Ingredients",
loc="center left",
bbox_to_anchor=(1, 0, 0.5, 1))
plt.setp(autotexts, size=8, weight="bold")
ax.set_title("qxx")
plt.savefig('./qxx.jpg')
document.add_picture('./qxx.jpg')
# 增加分页
document.add_page_break()
# 表格数据
records = (
(90, 80, 70),
)
table = document.add_table(rows=1,cols=3)
#设置表头
hdr_cells = table.rows[0].cells
hdr_cells[0].text = 'negativity'
hdr_cells[1].text = 'neutral'
hdr_cells[2].text = 'positive'
for a,b,c in records:
#为表格添加一行
row_cells = table.add_row().cells
row_cells[0].text = str(a)
row_cells[1].text = str(b)
row_cells[2].text = str(c)
# 添加空行
document.add_paragraph()
# 添加折线图
document.add_paragraph('传播趋势',style='List Number')
fig1,ax1 = plt.subplots()
ax1.plot([1, 2, 3, 4], [1, 4, 9, 16])
plt.savefig('./d1.jpg')
document.add_picture('./d1.jpg')
# 添加空行
document.add_paragraph('词云图',style='List Number')
document.add_paragraph()
# 定义文本数据,包含中文和英文单词
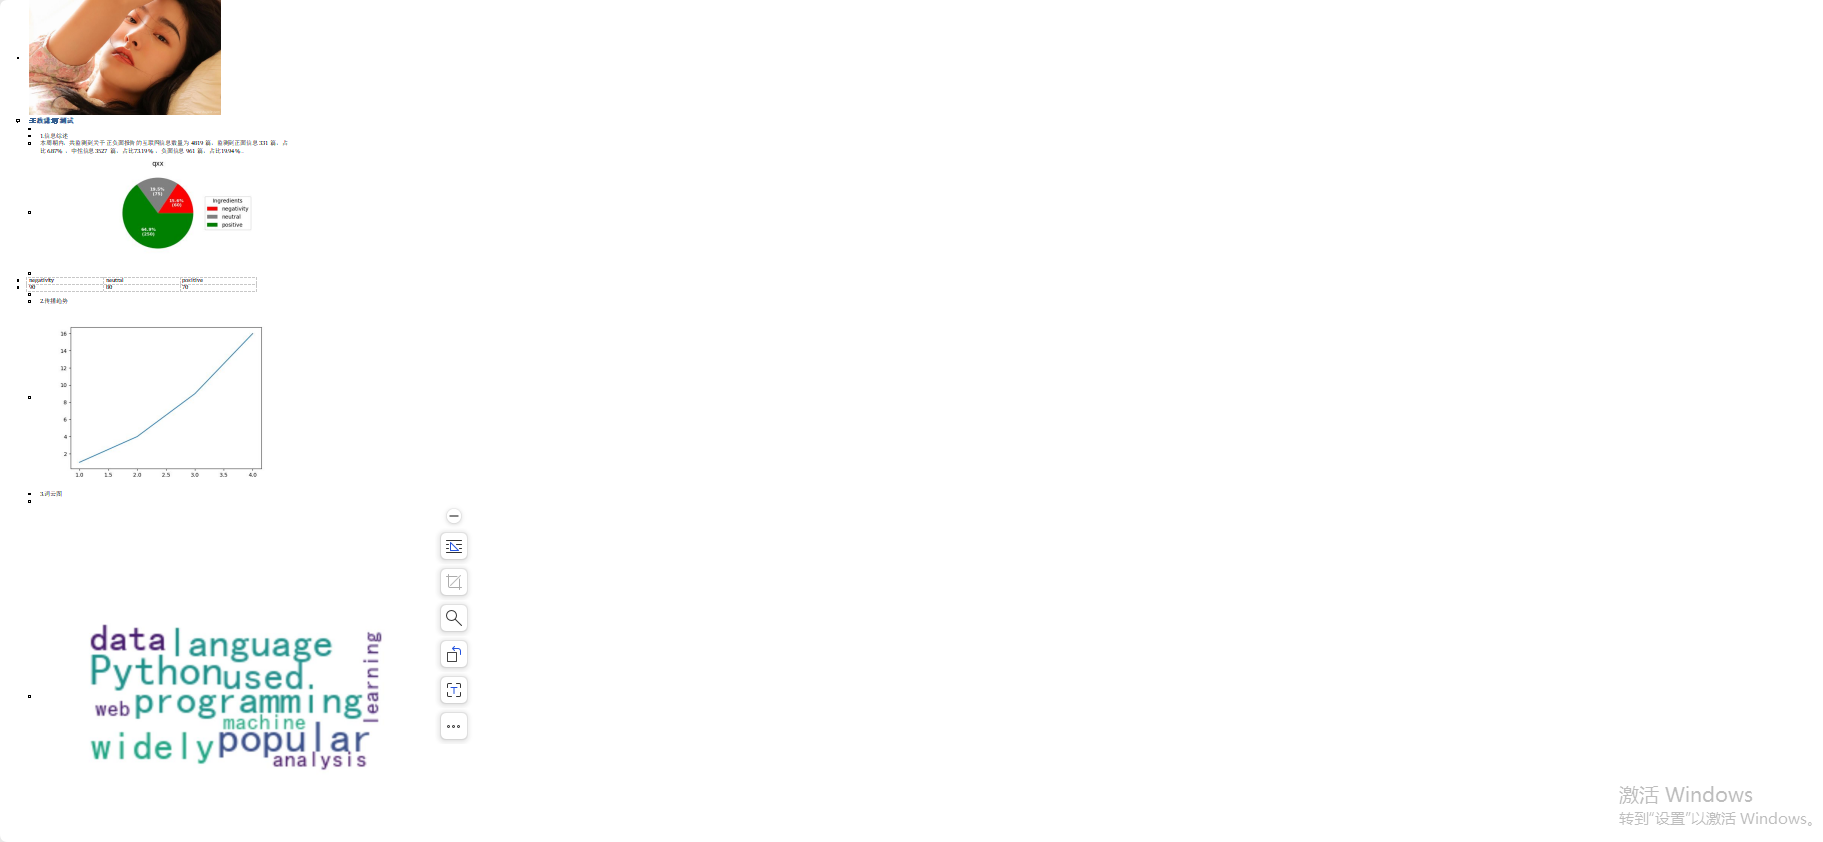
text = "Python is a popular programming language. It is widely used for data analysis, machine learning, and web development. Python是一种流行的编程语言。它被广泛应用于数据分析、机器学习和Web开发。"
# 创建WordCloud对象,设置背景颜色、字体最小尺寸等参数
wordcloud = WordCloud(font_path='./simhei.ttf', # 设置中文字体路径,这里使用黑体字体
background_color='white', # 设置背景颜色为白色
min_font_size=10, # 设置字体最小尺寸
width=200, # 设置词云图表宽度
height=100, # 设置词云图表高度
max_words=50, # 设置最大单词数
max_font_size=30) # 设置最大字体尺寸
# 使用WordCloud对象生成词云图表
wordcloud.generate(text)
# 使用matplotlib显示词云图表
plt.figure(figsize=(10, 10)) # 设置matplotlib图表大小
plt.imshow(wordcloud, interpolation='bilinear') # 显示词云图表,使用双线性插值提高图像质量
plt.axis("off") # 关闭坐标轴显示
plt.savefig('./cy.jpg')
document.add_picture('./cy.jpg')
document.save('my_document.docx')