背景
这几天简单学习了一些基本的测试过程.
可以实现一些简单基本的功能了.
今天晚上继续进行了jmeter的一些学习.

想着可以在测试人大金仓的同时可以查看一下本地的机器性能.
用到的工具以及资料
https://www.cnblogs.com/pachongshangdexuebi/p/13354201.html

Agent的下载地址:
https://github.com/undera/perfmon-agent

Perf的安装
使用 plugins manager 安装的插件为:
PerfMon (Servers Performance Monitoring)

需要注意
PerfMon是关联 Agent的暴露的端口进行展示和处理.
遇到的问题
Win11 自带的jdk的版本为:
openjdk version "11.0.16.1" 2022-08-12 LTS
OpenJDK Runtime Environment Microsoft-40648 (build 11.0.16.1+1-LTS)
OpenJDK 64-Bit Server VM Microsoft-40648 (build 11.0.16.1+1-LTS, mixed mode)

但是这个版本的jdk以及更高的LTS_OpenJDK17的版本在运行之后. perfMon 进行数据获取时会出现严重问题:
主要如下:
比较折腾. 但是将OpenJDK的版本降低到1.8.372之后就没有这个问题了.
下载地址为:
https://builds.openlogic.com/downloadJDK/openlogic-openjdk/8u372-b07/openlogic-openjdk-8u372-b07-windows-x64.zip

注意 我这边特别喜欢使用zip/tar.gz 的包进行安装, 并且不修改环境变量
直接使用绝对/相对路径进行处理.能够极大的减少相关的工作量.

高版本报错的提示信息为:

D:\apache-jmeter-5.6\ServerAgent-2.2.3>startAgenterror.bat
INFO    2023-07-03 22:04:13.412 [kg.apc.p] (): Binding UDP to 4444
INFO    2023-07-03 22:04:13.430 [kg.apc.p] (): Binding TCP to 4444
INFO    2023-07-03 22:04:13.432 [kg.apc.p] (): JP@GC Agent v2.2.3 started
INFO    2023-07-03 22:04:18.016 [kg.apc.p] (): Accepting new TCP connection
INFO    2023-07-03 22:04:18.018 [kg.apc.p] (): Yep, we received the 'test' command
INFO    2023-07-03 22:04:18.018 [kg.apc.p] (): Starting measures: memory:       cpu:    disks i/o:
#
# A fatal error has been detected by the Java Runtime Environment:
#
#  EXCEPTION_ACCESS_VIOLATION (0xc0000005) at pc=0x0000000010014ed4, pid=25212, tid=9636
#
# JRE version: OpenJDK Runtime Environment Microsoft-40648 (11.0.16.1+1) (build 11.0.16.1+1-LTS)
# Java VM: OpenJDK 64-Bit Server VM Microsoft-40648 (11.0.16.1+1-LTS, mixed mode, tiered, compressed oops, g1 gc, windows-amd64)
# Problematic frame:
# C  [sigar-amd64-winnt.dll+0x14ed4]
#
# No core dump will be written. Minidumps are not enabled by default on client versions of Windows
#
# An error report file with more information is saved as:
# D:\apache-jmeter-5.6\ServerAgent-2.2.3\hs_err_pid25212.log
#
# If you would like to submit a bug report, please visit:
#   https://github.com/microsoft/openjdk/issues
# The crash happened outside the Java Virtual Machine in native code.
# See problematic frame for where to report the bug.
监控使用过程-agent
使用 OpenJDK1.8的版本启动 server_agent
注意我是Windows的本地进行的:
修改 ServerAgent.bat 内的的启动脚本,改为 OpenJDK的绝对路径:
D:\apache-jmeter-5.6\ServerAgent-2.2.3\openjdk-8u372\bin\java.exe -jar %0\..\CMDRunner.jar --tool PerfMonAgent %*

然后启动agent 双击就可以了.
注意可能要放开防火墙的限制, 默认监控的端口是: 4444
监控使用构成-监控端
在测试计划->进程组->添加->监听器->jp@gc - PerfMon Metrics Collector

在右侧的 server to monitor 处进行选择.

通过 Add row的方式进行添加

需要注意, 不要一定添加过多的的row 不然非常难看.

其实可以添加多个 监听器监听不同的元素效果也不错.
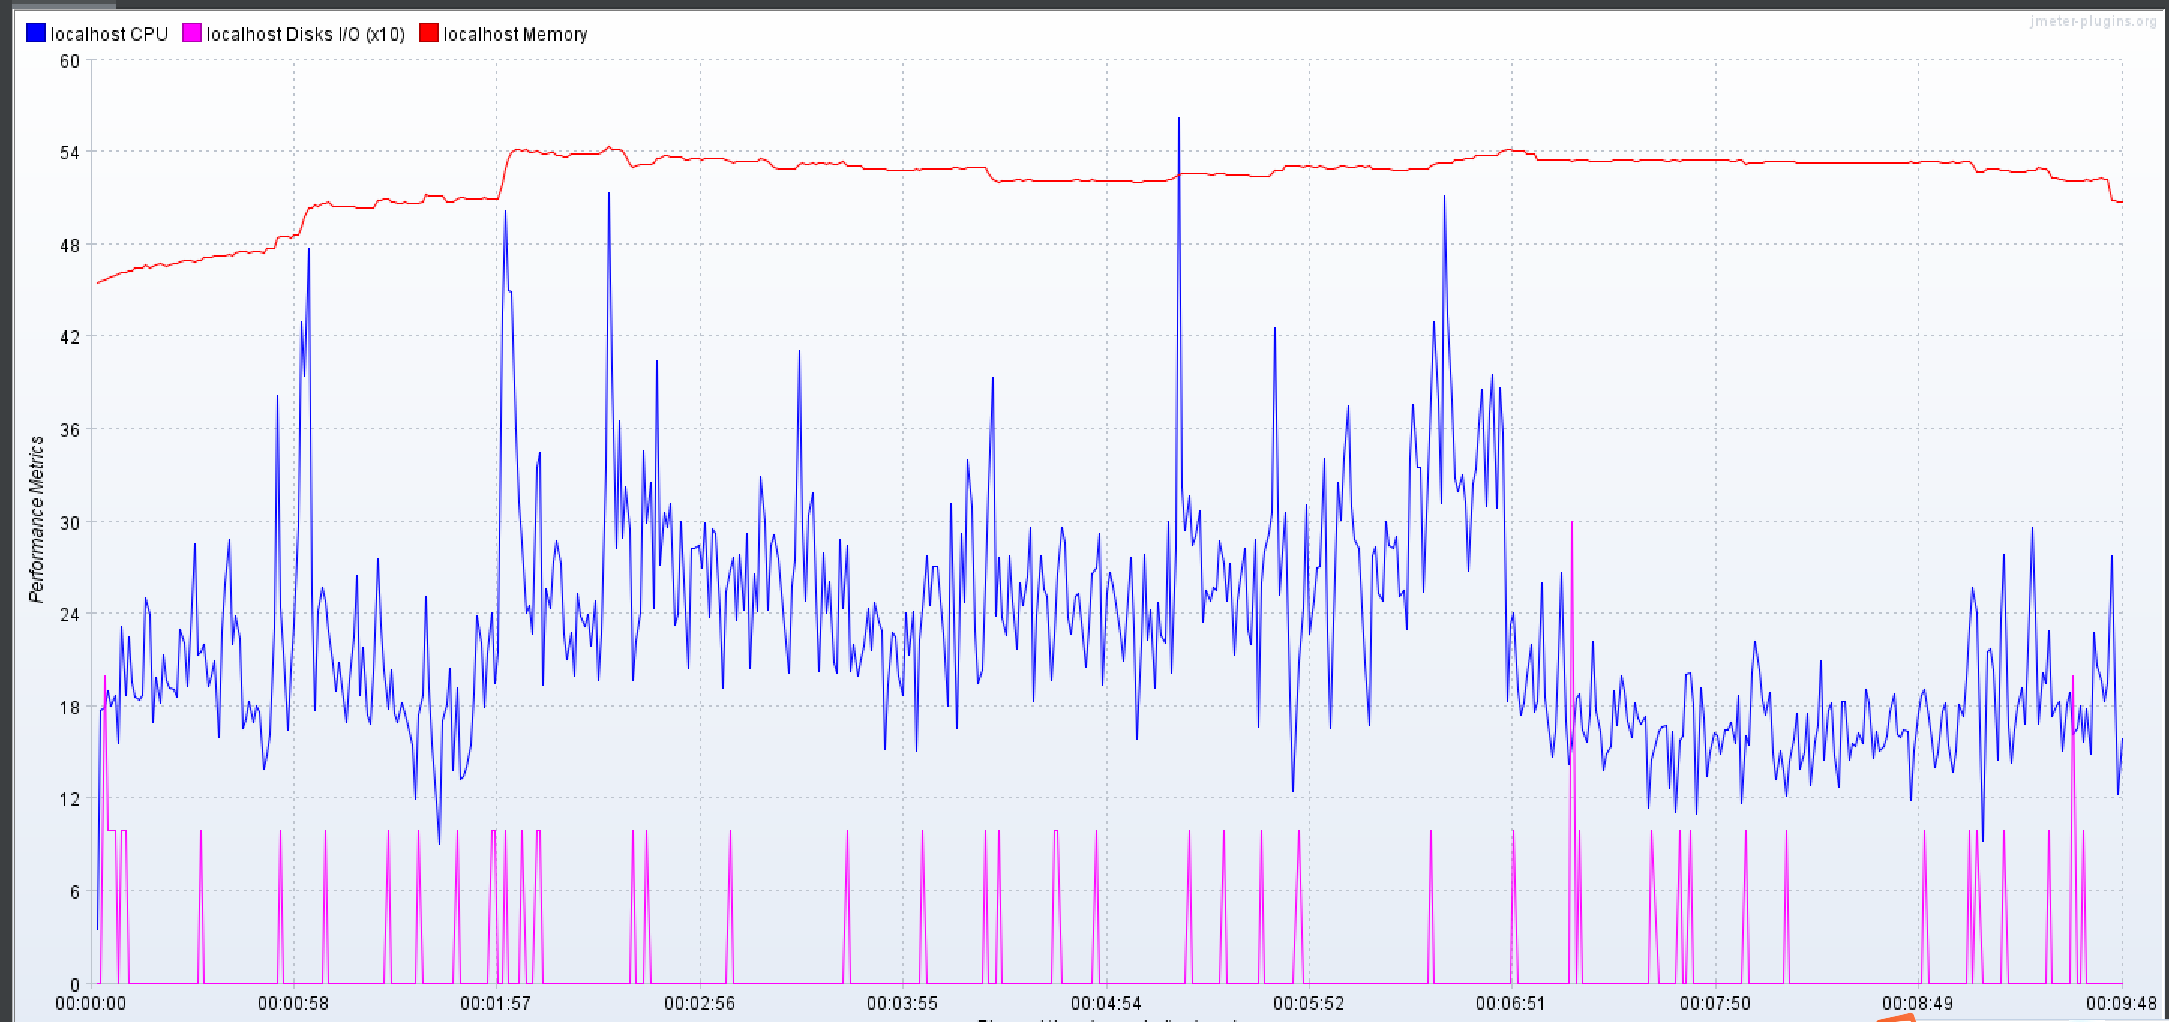
监控效果为:
欢迎关注我的公众号一起学习进步