一. 将安装包上传至目标服务器(即日志所在的服务器)
就是我提供的安装包filebeat-7.6.2-linux-x86_64.tar.gz
将安装包上传至/opt目录下
二. 解压安装
进入/opt目录
cd /opt
tar -zxvf ./ filebeat-7.6.2-linux-x86_64.tar.gz
mv filebeat-7.6.2-linux-x86_64 filebeat-7.6.2
三. 配置filebeat
1. 配置采集日志到logstash,这种配置适用于日志量较小的场景,Filebeat---> logstash,logstash直接解析filebeat
1.1 修改配置文件
cp filebeat.yml filebeat_logstash.yml
vim filebeat_logstash.yml
#配置filebeat_logstash.yml
#Inputs配置:
filebeat.inputs:

# Each - is an input. Most options can be set at the input level, so
# you can use different inputs for various configurations.
# Below are the input specific configurations.

- type: log

  # Change to true to enable this input configuration.
  enabled: true

  # Paths that should be crawled and fetched. Glob based paths.
  paths:
    - /home/lemo/*.log

这里注意启动filebeat进程的用户要有日志文件的读权限,不然会报错权限不够
配置output.logstash: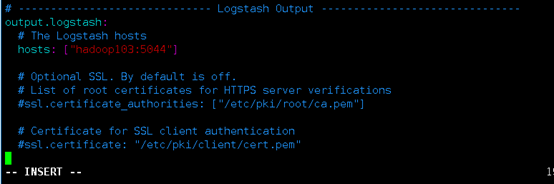
这里hosts指定的logstash是logstash主机的ip或主机名,指定主机名是filebeat本地要配置host映射,端口需指定为logstash服务器未被占用的端口.
1.2 启动filebeat
./filebeat -e -c ./filebeat_logstash.yml
后台启动:
nohup ./filebeat -e -c ./filebeat_logstash.yml &
2. 配置采集日志至kafka,filebeat---> kafka,再通过logstash消费kafka数据进行日志解析
2.1 配置filebeat:
cp filebeat.yml filebeat_kafka.yml
vim filebeat_kafka.yml
filebeat.inputs跟上面一样: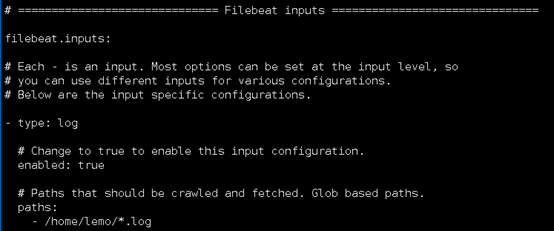
配置output:
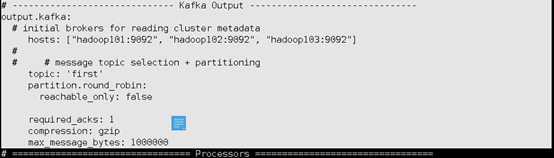
output.kafka:
# ------------------------------ Kafka Output -------------------------------
output.kafka:
  # initial brokers for reading cluster metadata
     hosts: ["hadoop101:9092", "hadoop102:9092", "hadoop103:9092"]
  #
  #     # message topic selection + partitioning
     topic: 'first'
     partition.round_robin:
       reachable_only: false

     required_acks: 1
     compression: gzip
     max_message_bytes: 1000000
2.2 启动filebeat
./filebeat -e -c ./filebeat_kafka.yml
后台启动:
nohup ./filebeat -e -c ./filebeat_kafka.yml &
四. 配置logstash
这里以配置filebeat->kafka->logstash->es方式
在logstash中添加以下配置:
input{
    kafka {
         bootstrap_servers => "hadoop101:9092,hadoop102:9092,hadoop103:9092"
         client_id => "test"
         group_id  => "test"
         topics => ["first"]
         auto_offset_reset => "earliest"
         auto_commit_interval_ms => "1000"
         decorate_events => true
             }
}
filter{
   json {
       source => "message"
   }
   grok {
       match => {
          "message" => "\[%{GREEDYDATA:time}\]-%{GREEDYDATA:level}-\[biz:%{GREEDYDATA:biz}\]\[sys:%{NUMBER:sys}\]\[%{GREEDYDATA:message}\]"
       }
   }
}
output{
    elasticsearch {
        hosts => ["hadoop101:9200","hadoop102:9200","hadoop103:9200"]
        index => "test-%{+YYYY.MM.dd}"
    }
}
保存后启动logstash
./logstash -f 指定配置文件运行
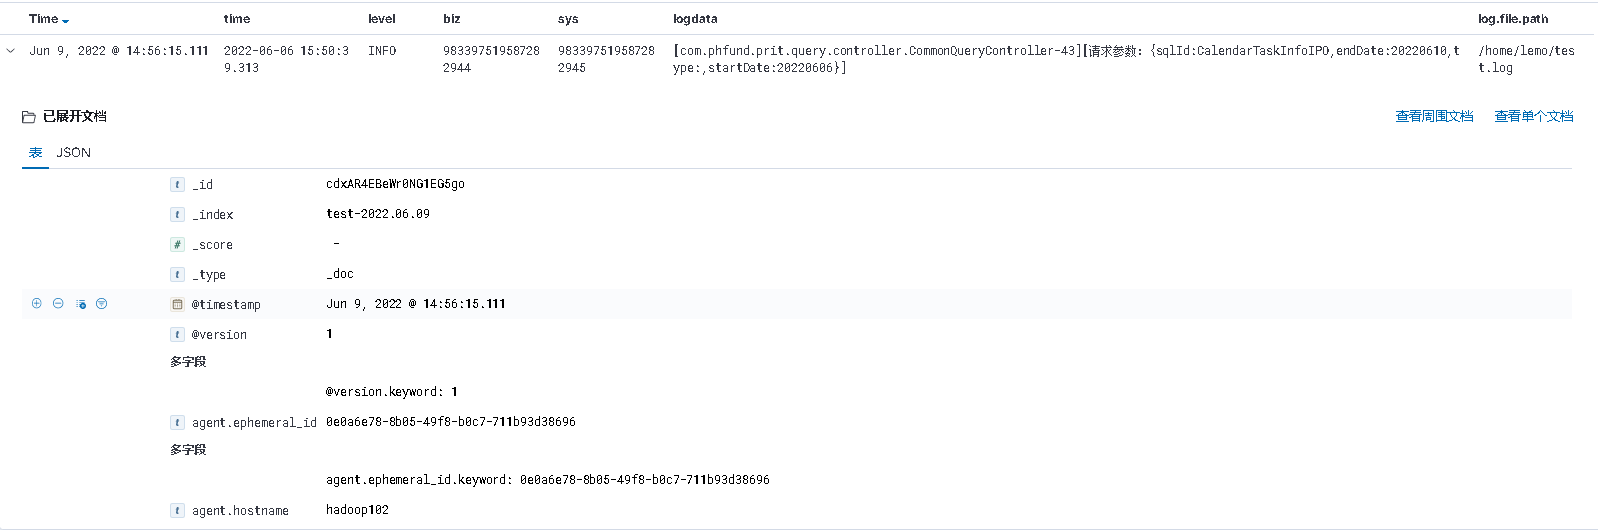
发送日志测试:
echo "[2022-06-06 15:50:39.313]-INFO-[biz:983397519587282944][sys:983397519587282945][com.phfund.prit.query.controller.CommonQueryController-43][请求参数:{"sqlId":"CalendarTaskInfoIPO","endDate":"20220610","type":"","startDate":"20220606"}]" >> /home/lemo/test.log
查看kibana界面: