# -*- coding: utf-8 -*-

import idaapi
import idc
import re
import ida_dbg
import ida_idd
from idaapi import *
from collections import OrderedDict
import logging
import time
import datetime
import os


debughook = None

def xx_hex(ea):
    return hex(ea).rstrip("L").lstrip("0x")

def set_breakpoint(ea):
    #idc.SetReg(ea, "T", 1)
    idc.MakeCode(ea)
    idc.add_bpt(ea)

def my_get_reg_value(register):
    rv = ida_idd.regval_t()
    ida_dbg.get_reg_val(register, rv)
    current_addr = rv.ival
    return current_addr


def suspend_other_thread():
    current_thread = idc.get_current_thread()
    thread_count = idc.get_thread_qty()
    for i in range(0, thread_count):
        other_thread = idc.getn_thread(i)
        if other_thread != current_thread:
            idc.suspend_thread(other_thread)

def resume_process():
    current_thread = idc.get_current_thread()
    thread_count = idc.get_thread_qty()
    for i in range(0, thread_count):
        other_thread = idc.getn_thread(i)
        if other_thread != current_thread:
            idc.resume_thread(other_thread)
    idc.resume_thread(current_thread)
    idc.resume_process()

class MyDbgHook(DBG_Hooks):
    """ Own debug hook class that implementd the callback functions """

    def __init__(self, modules_info, skip_functions, end_ea):
        super(MyDbgHook, self).__init__()
        self.modules_info = modules_info
        self.skip_functions = skip_functions
        self.trace_step_into_count = 0
        self.trace_step_into_size = 1
        self.trace_total_size = 300000
        self.trace_size = 0
        self.trace_lr = 0
        self.end_ea = end_ea
        self.bpt_trace = 0
        self.Logger = None
        self.line_trace = 0
        print("__init__")

    def start_line_trace(self):
        self.bpt_trace = 0
        self.line_trace = 1
        self.start_hook()

    def start_hook(self):
        self.hook()
        print("start_hook")

    def dbg_process_start(self, pid, tid, ea, name, base, size):
        print("Process started, pid=%d tid=%d name=%s" % (pid, tid, name))

    def dbg_process_exit(self, pid, tid, ea, code):
        self.unhook()
        if self.Logger:
            self.Logger.log_close()
        print("Process exited pid=%d tid=%d ea=0x%x code=%d" % (pid, tid, ea, code))

    def dbg_process_detach(self, pid, tid, ea):
        self.unhook()
        self.Logger.log_close()
        return 0

    def dbg_bpt(self, tid, ea):
        print("Break point at 0x%x tid=%d" % (ea, tid))
        if ea in self.end_ea:
            ida_dbg.enable_insn_trace(False)
            ida_dbg.enable_step_trace(False)
            ida_dbg.suspend_process()
            return 0
        return 0

    def dbg_trace(self, tid, ea):
        #print("Trace tid=%d ea=0x%x" % (tid, ea))
        # return values:
        #   1  - do not log this trace event;
        #   0  - log it
        if self.line_trace:
            in_mine_so = False
            for module_info in self.modules_info:
                # print (module_info)
                so_base = module_info["base"]
                so_size = module_info["size"]
                if so_base <= ea <= (so_base + so_size):
                    in_mine_so = True
                    break

            self.trace_size += 1
            if (not in_mine_so) or (ea in self.skip_functions):
                if (self.trace_lr != 0) and (self.trace_step_into_count < self.trace_step_into_size):
                    self.trace_step_into_count += 1
                    return 0

                if (self.trace_lr != 0) and (self.trace_step_into_count == self.trace_step_into_size):
                    ida_dbg.enable_insn_trace(False)
                    ida_dbg.enable_step_trace(False)
                    ida_dbg.suspend_process()
                    if self.trace_size > self.trace_total_size:
                        self.trace_size = 0
                        ida_dbg.request_clear_trace()
                        ida_dbg.run_requests()

                    ida_dbg.request_run_to(self.trace_lr)
                    ida_dbg.run_requests()
                    self.trace_lr = 0
                    self.trace_step_into_count = 0
                    return 0

                if self.trace_lr == 0:
                    self.trace_lr = my_get_reg_value("X30")  #arm thumb LR, arm64 X30
            return 0

    def dbg_run_to(self, pid, tid=0, ea=0):
        # print("dbg_run_to 0x%x pid=%d" % (ea, pid))
        if self.line_trace:
            ida_dbg.enable_insn_trace(True)
            ida_dbg.enable_step_trace(True)
            ida_dbg.request_continue_process()
            ida_dbg.run_requests()


def unhook():
    global debughook
    # Remove an existing debug hook
    try:
        if debughook:
            print("Removing previous hook ...")
            debughook.unhook()
            debughook.Logger.log_close()
    except:
        pass


def starthook():
    global debughook
    if debughook:
        debughook.start_line_trace()


def main():
    global debughook
    unhook()
    skip_functions = []
    modules_info = []
    start_ea = 0
    end_ea = []
    so_modules = ["libnative-lib.so"]
    for module in idc._get_modules():
        module_name = os.path.basename(module.name)
        for so_module in so_modules:
            if re.search(so_module, module_name, re.IGNORECASE):
                print("modules_info append %08X %s %08X" % (module.base, module.name, module.size))
                if module_name == "libnative-lib.so":
                    modules_info.append({"base": module.base, "size": module.size, "name": module.name})
                    start_ea = (module.base + 0xDB4)      #UUIDCheckSum
                    end_ea = [((module.base + 0x1284))]
                    break

    if start_ea:
        set_breakpoint(start_ea)
    if end_ea:
        for ea in end_ea:
            set_breakpoint(ea)

    if skip_functions:
        print("skip_functions")
        for skip_function in skip_functions:
            print ("%08X" % skip_function)

    debughook = MyDbgHook(modules_info, skip_functions, end_ea)

    pass


if __name__ == "__main__":
    main()
    pass
上面是ida trace的脚本,需要加入到ida中,具体trace过程如下
脚本需要修改 trace 的起始和最终位置、so文件名和cpu架构
1、启动ida的android server程序+转发端口
adb forward tcp:23946 tcp:23946
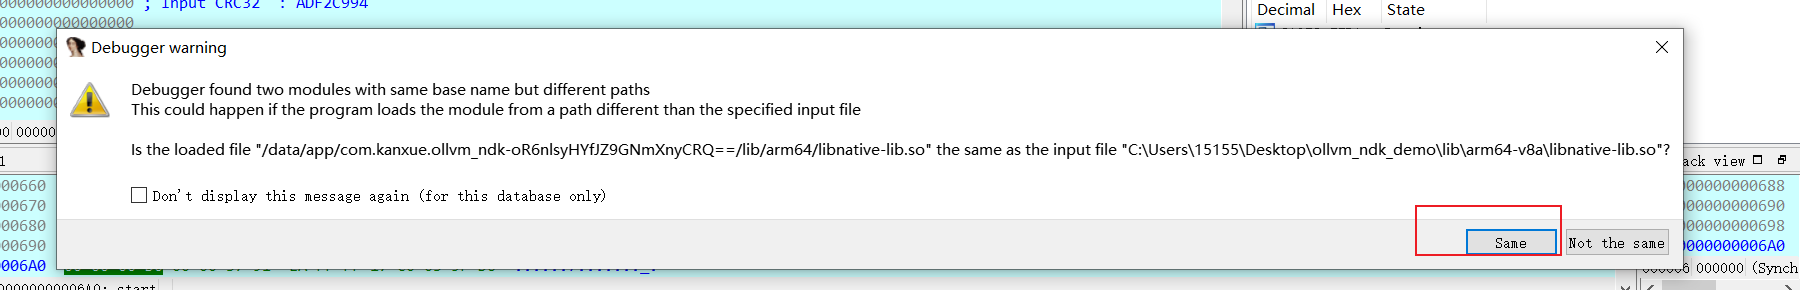
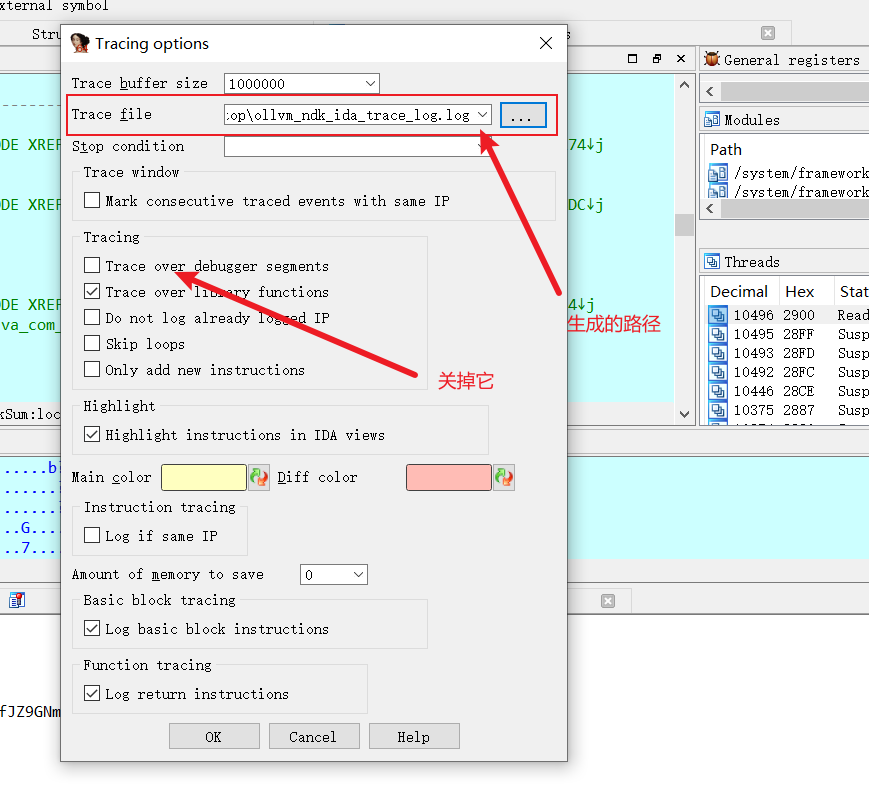
2、ida配置 7.0
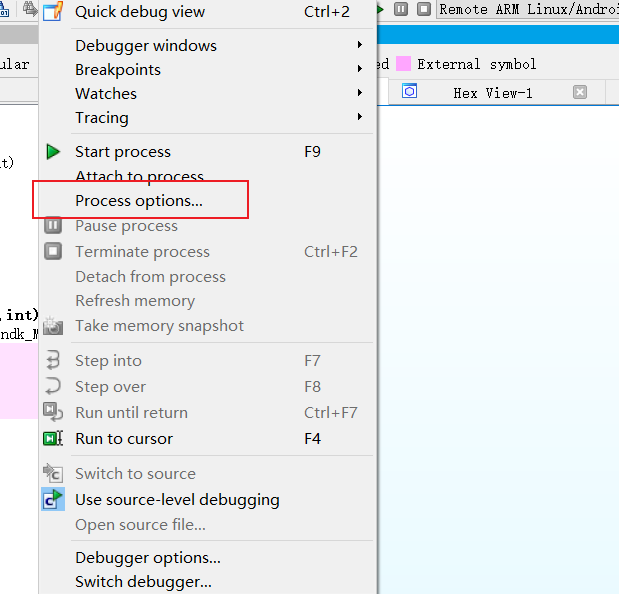
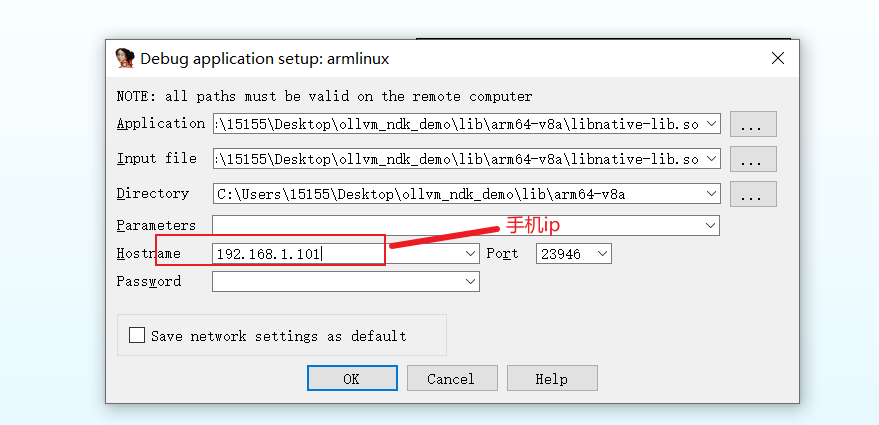
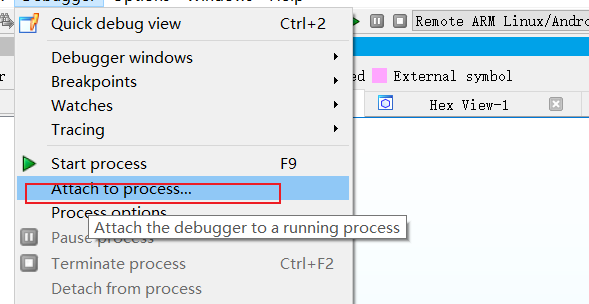
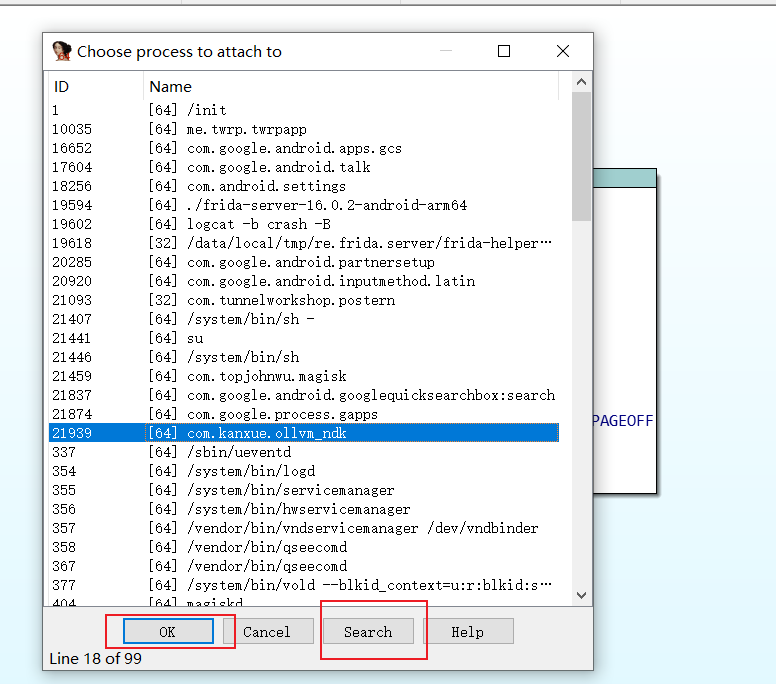
2、加载脚本

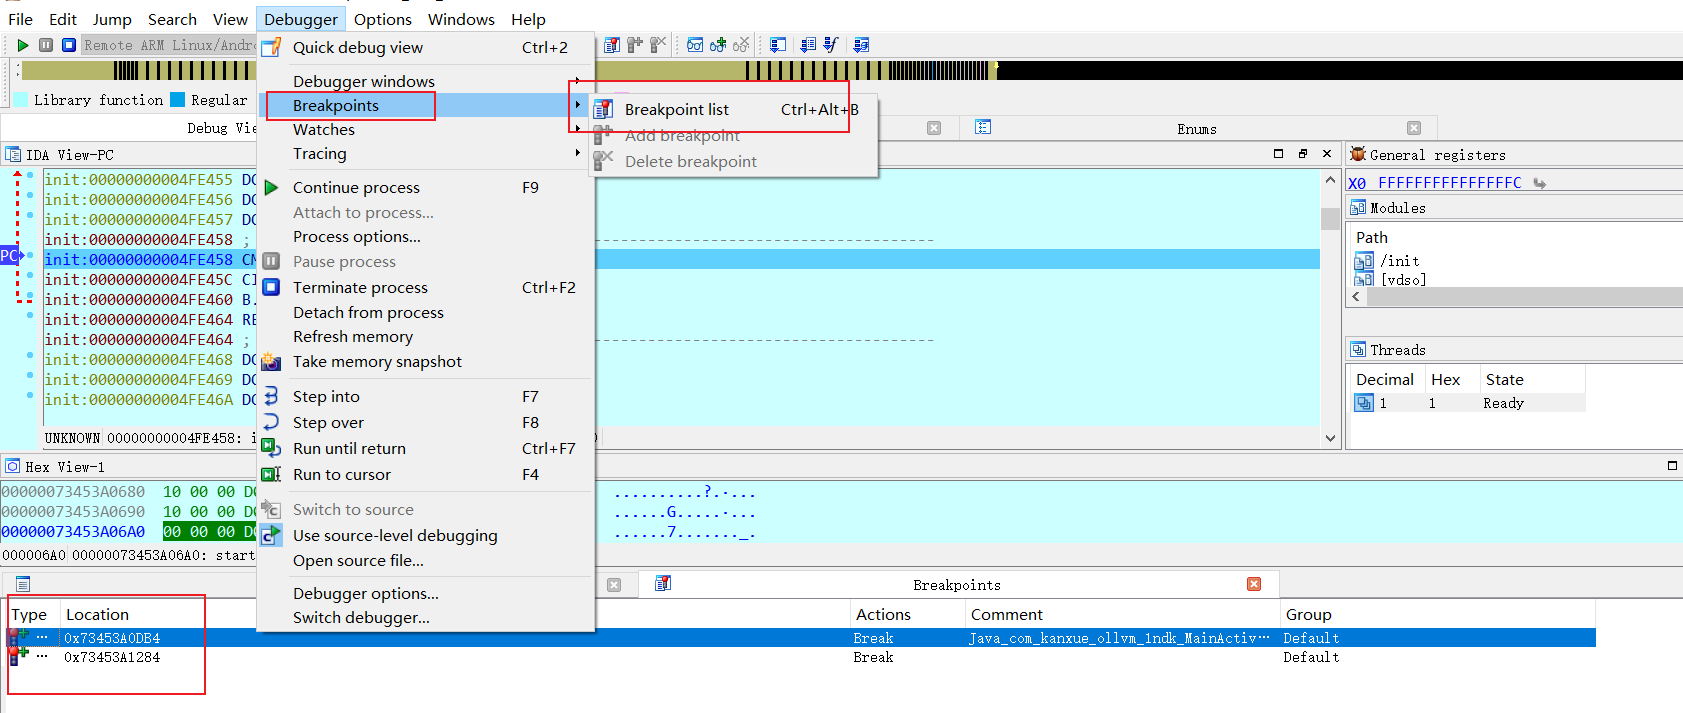
查看断点
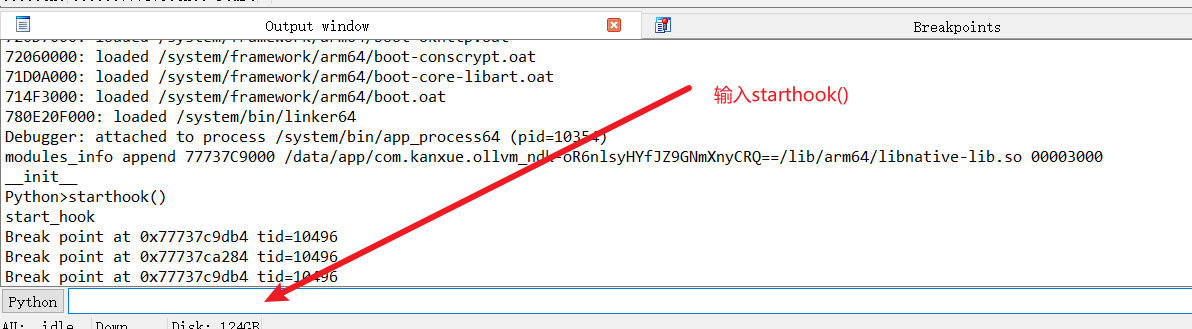
主动调用断点函数,断点生效
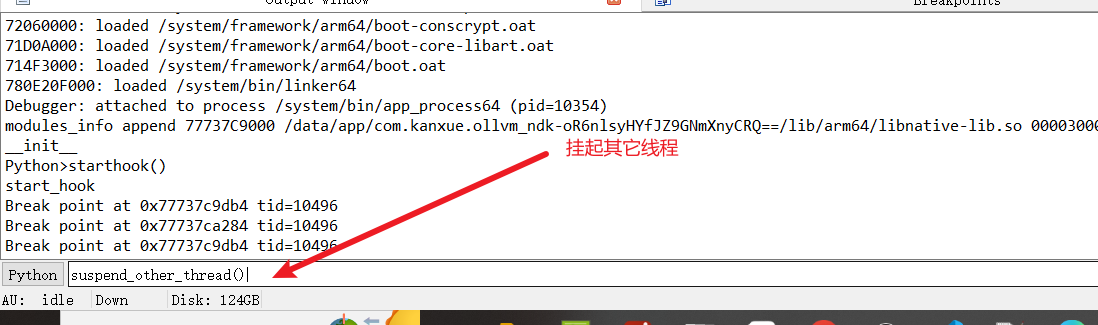
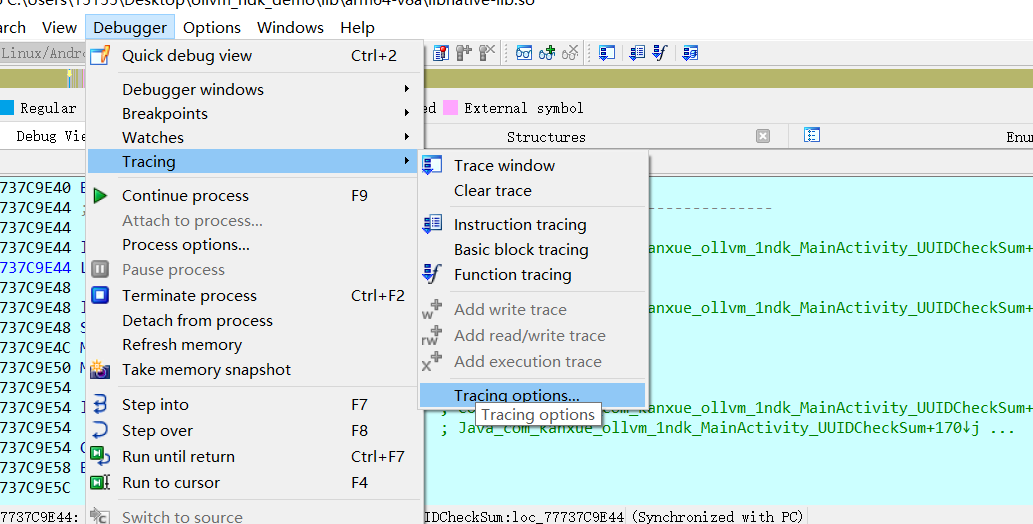
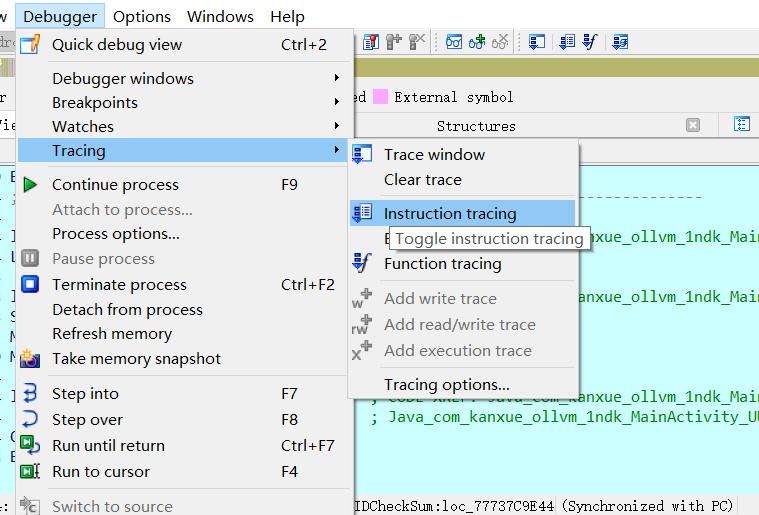
进行trace


根据生成的trace日志,即执行的汇编代码进行算法还原
相关代码、日志、文件、apk见
https://www.aliyundrive.com/s/zziJd6jaeC6
点击链接保存,或者复制本段内容,打开「阿里云盘」APP ,无需下载极速在线查看,视频原画倍速播放。