Prometheus
开源监控解决方案
Prometheus是一个开源监控解决方案,用于收集和聚合指标作为时间序列数据。 更简单地说,Prometheus 商店中的每个项目都是一个指标事件,并带有它发生的时间戳。 Prometheus 最初是在 Soundcloud 开发的,但现在是一个由Cloud Native Computing Foundation (CNCF)支持的社区项目。

特点:
多维数据模型,时间序列由metric名字和K/V标签标识
灵活的查询语言(PromQL)
单机模式,不依赖分布式存储
基于HTTP采用pull方式收集数据
支持push数据到中间件(pushgateway)
通过服务发现或静态配置发现目标
多种图表和仪表盘
由于数据采集可能会有丢失,所以 Prometheus 不适用对采集数据要 100% 准确的情形。但如果用于记录时间序列数据,Prometheus 具有很大的查询优势,此外,Prometheus 适用于微服务的体系架构
组件
Prometheus server - 收集和存储时间序列数据
Client Library: 客户端库,为需要监控的服务生成相应的 metrics 并暴露给 Prometheus server。当 Prometheus server 来 pull 时,直接返回实时状态的 metrics。
pushgateway - 对于短暂运行的任务,负责接收和缓存时间序列数据,同时也是一个数据源
exporter - 各种专用exporter,面向硬件、存储、数据库、HTTP服务等
alertmanager - 处理报警
webUI等,其他各种支持的工具
环境介绍
操作系统 ip地址 主机名 应用
Rocky9 192.168.10.128 server1 grafana
Rocky9 192.168.10.129 server2 prometheus,alermanager
Rocky9 192.168.10.130 server3 node_expoter
Prometheus部署
server1上进行
wget https://github.com/prometheus/prometheus/releases/download/v2.31.0-rc.0/prometheus-2.31.0-rc.0.linux-amd64.tar.gz
直接进行下载
tar -xzvf prometheus-2.31.0-rc.0.linux-amd64.tar.gz -C /usr/local/
mv prometheus-2.31.0-rc.0.linux-amd64/ prometheus
cd prometheus/
mkdir data #创建数据库存放目录
配置systemctl管理
vim /usr/lib/systemd/system/prometheus.service

[Unit]
Description=https://prometheus.io

[Service]
Restart=on-failure
ExecStart=/usr/local/prometheus/prometheus --storage.tsdb.path=/usr/local/prometheus/data --config.file=/usr/local/prometheus/prometheus.yml

[Install]
WantedBy=multi-user.target
cp prometheus.yml prometheus.yml.bak
systemctl start promethe

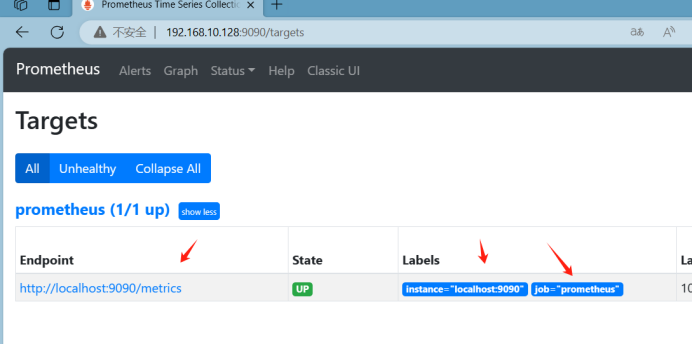
访问部署的这台ip地址加9090端口

下面监控远程主机
在server3上
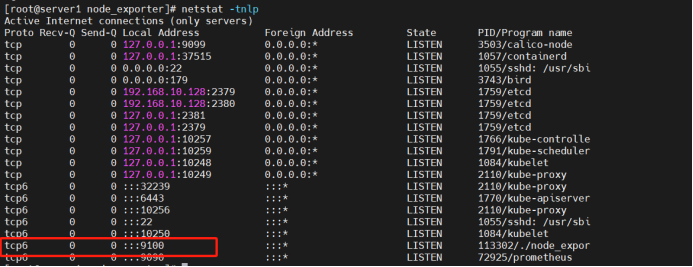
下载安装node_exporter,再需要被监控的机器上面
systemctl stop firewalld
setenforce 0
tar -xvzf node_exporter-1.2.2.linux-amd64.tar.gz -C /usr/local/
cd /usr/local/
mv node_exporter-1.2.2.linux-amd64/ node_exporter
cd node_exporter/
nohup ./node_exporter &
配置systemctl管理
vim /usr/lib/systemd/system/node_exporter.service
|
1
2
3
4
5
6
7
8
9
10
|
[Unit]Description=Prometheusnode_exporter[Service]User=nobodyExecStart=/usr/local/node_exporter/node_exporter --log.level=errorExecStop=/usr/bin/killallnode_exporter[Install]WantedBy=default.target |
systemctl start node_exporter 启动

cd /usr/local/prometheus/
切换到这个目录
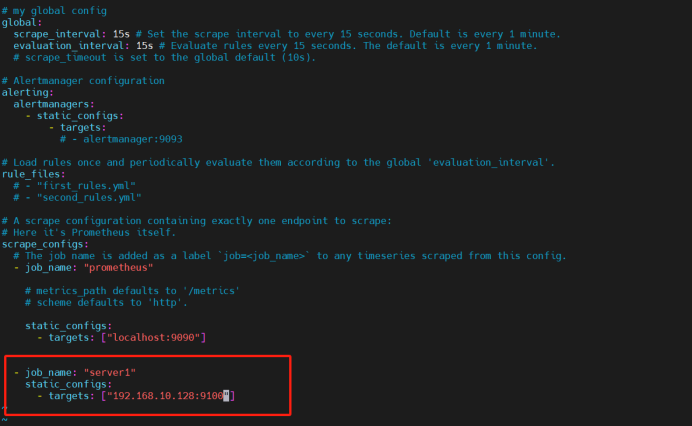
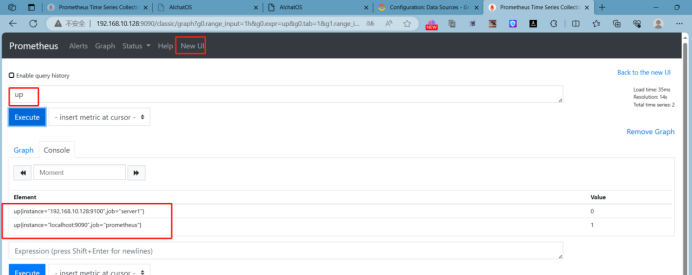
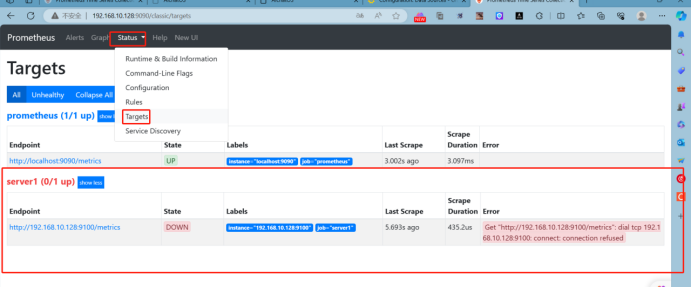
vim prometheus.yml 进去这个文件再最后添加监控主机
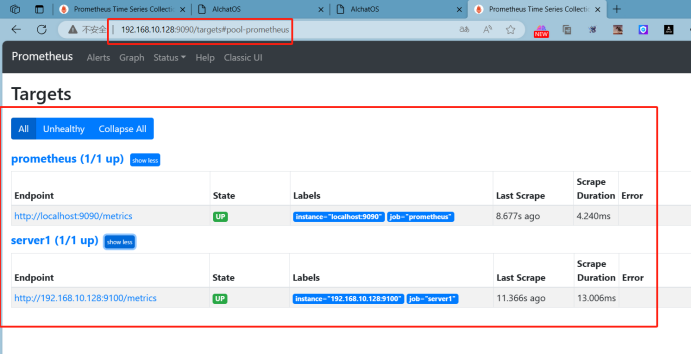
./promtool check config prometheus.yml 检查一下添加的文件是否有问题

systemctl restart prometheus 启动
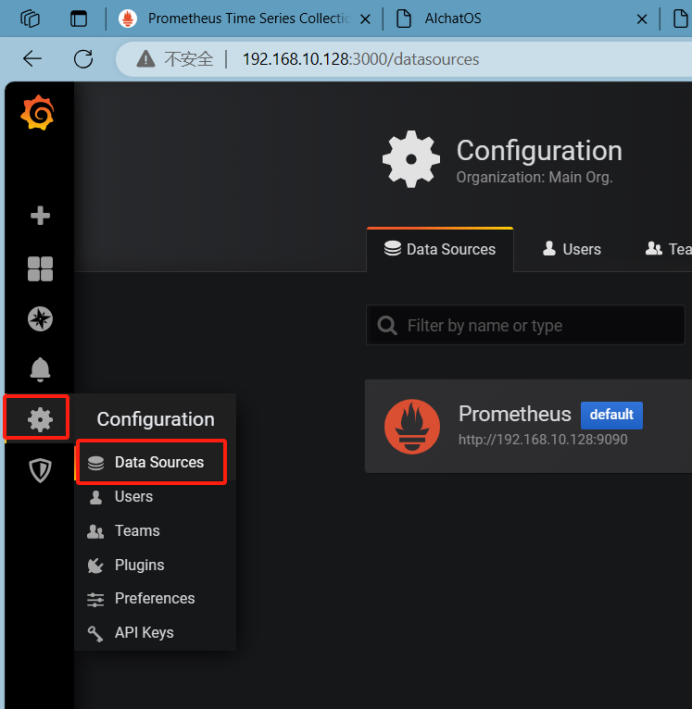
部署Grafana,就是一个展示页面,部署在哪个机器上面都可以,可要可不要
Download Grafana | Grafana Labs
进入上面这个网站

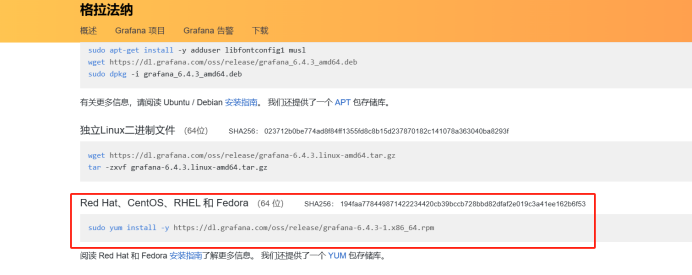
Cd
sudo yum install -y https://dl.grafana.com/oss/release/grafana-6.4.3-1.x86_64.rpm
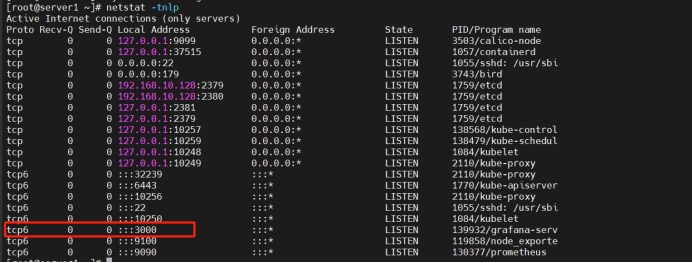
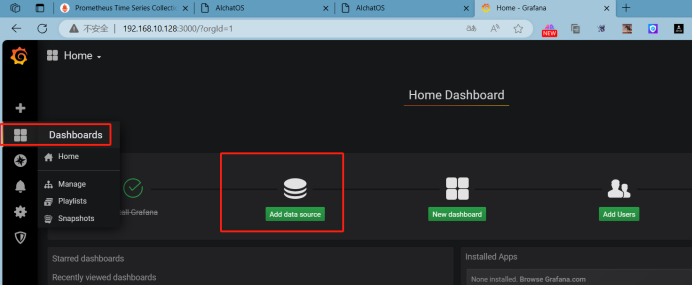
systemctl start grafana-server
默认账号:admin ; 默认密码:admin


还是刚才的账号和密码


邮箱报警实战
开启邮箱SNMP

那个值一定要记住
部署AlterManager报警
这个这里提示一下 ,安装在那一台机器上面都可以,他只是用来部署报警的方式
下载
tar -xvzf alertmanager-0.23.0.linux-amd64.tar.gz -C /usr/local/
cd /usr/local/
mv alertmanager-0.23.0.linux-amd64/ alertmanager
vim alertmanager/alertmanager.yml
进去修改
|
1
2
3
4
5
6
7
8
9
10
11
12
13
14
15
16
17
18
19
20
21
22
23
24
25
|
global: resolve_timeout: 5m smtp_from: '自己的邮箱账号@163.com' smtp_smarthost: 'smtp.163.com:25' smtp_auth_username: '自己的邮箱账号@163.com' smtp_auth_password: 'CTKOCCOAHEVIVXZG这个是我自己的,不过只能使用一次' #这里要开启邮箱SMTP/POP3/IMAP认证,记录授权码 smtp_require_tls: false# smtp_hello: '163.com'route: group_by: ['alertname'] group_wait: 20s group_interval: 5m repeat_interval: 5m receiver: 'email'receivers:- name: 'email' email_configs: - to: '@qq.com' send_resolved: trueinhibit_rules: - source_match: severity: 'critical' target_match: severity: 'warning' equal: ['alertname', 'dev', 'instance'] |
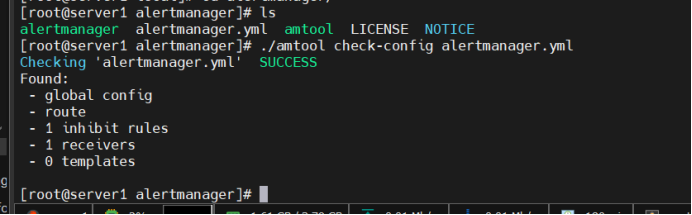
cd alertmanager/ 进去这个文件里面
./amtool check-config alertmanager.yml #检测语法
配置systemctl系统管理
[root@server1 alertmanager]# vim /usr/lib/systemd/system/alertmanager.service
|
1
2
3
4
5
6
7
8
9
|
[Unit]Description=alertmanager SystemDocumentation=alertmanager System[Service]ExecStart=/usr/local/alertmanager/alertmanager --config.file=/usr/local/alertmanager/alertmanager.yml[Install]WantedBy=multi-user.target |
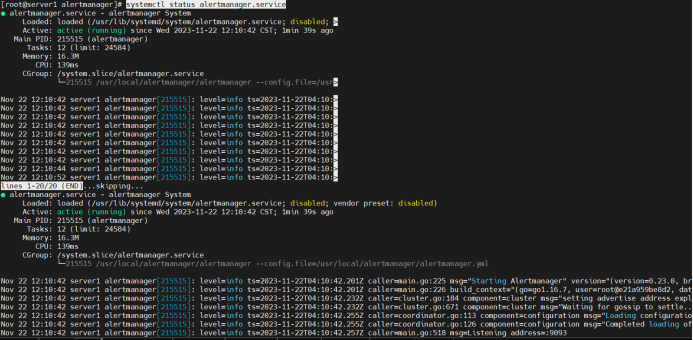
systemctl restart alertmanager.service
systemctl status alertmanager.service
prometheus告警实战
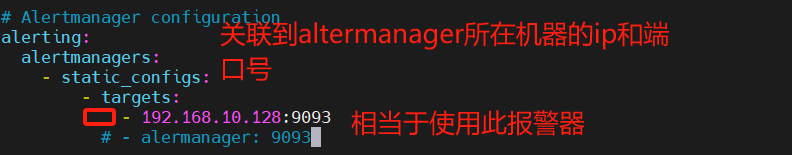
修改 prometheus 配置文件
vim prometheus/prometheus.yml 进去文件进行配置
编写告警规则
创建目录,还有文件
mkdir prometheus/rules/
vim prometheus/rules/host_monitor.yml
|
1
2
3
4
5
6
7
8
9
10
11
|
groups:- name: node-up rules: - alert: node-up expr: up == 0 for: 10s labels: severity: warning team: node annotations: summary: "加油公司 {{ $labels.instance }} 服务已停止运行超过 10s!" |
systemctl restart prometheus 启动
现在进行测试一下
关闭
systemctl stop node_exporter

systemctl start node_exporter 这个是启动的意思
下面是优化版
cd /usr/local/alertmanager/
先进入到这个目录里面
vim email.tmp
|
1
2
3
4
5
6
7
8
9
10
11
12
13
14
15
16
17
18
19
20
21
22
|
{{ define "email.from" }}xxxx@qq.com{{ end }}{{ define "email.to" }}xxxx@qq.com{{ end }}{{ define "email.to.html" }}{{ if gt (len .Alerts.Firing) 0 }}{{ range .Alerts }}@告警: <br>告警程序: prometheus_alert <br>告警级别: {{ .Labels.severity }} 级 <br>告警类型: {{ .Labels.alertname }} <br>故障主机: {{ .Labels.instance }} <br>告警主题: {{ .Annotations.summary }} <br>告警详情: {{ .Annotations.description }} <br>触发时间: {{ .StartsAt.Add 28800e9 }} <br>{{ end }}{{ end }}{{ if gt (len .Alerts.Resolved) 0 }}{{ range .Alerts }}@恢复: <br>告警主机:{{ .Labels.instance }} <br>告警主题:{{ .Annotations.summary }} <br>恢复时间: {{ .EndsAt.Add 28800e9 }} <br>{{ end }}{{ end }}{{ end }} |
vim alertmanager.yml 这时我门在进入这个文件里面
|
1
2
3
4
5
6
7
8
9
10
11
12
13
14
15
16
17
18
19
20
21
22
23
24
25
26
27
28
29
|
global: resolve_timeout: 5m smtp_from: '@163.com' smtp_smarthost: 'smtp.163.com:25' smtp_auth_username: 'xxxxxxx@163.com' smtp_auth_password: 'P' smtp_require_tls: false smtp_hello: '163.com'templates: - "/usr/local/alertmanager/email.tmpl"route: group_by: ['alertname'] group_wait: 5s group_interval: 1m repeat_interval: 1m receiver: 'email'receivers:- name: 'email' email_configs: - to: '@qq.com' - to: '{{ template "email.to" . }}' html: '{{ template "email.to.html" . }}' send_resolved: trueinhibit_rules: - source_match: severity: 'critical' target_match: severity: 'warning' equal: ['alertname', 'dev', 'instance'] |
./amtool check-config alertmanager.yml 检查配置文件是否失败

systemctl stop node_exporter
然后关闭一下在测试一下
这是开去的命令
systemctl start node_exporter