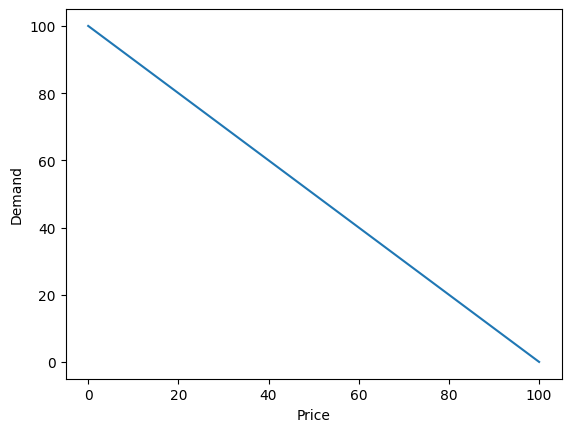
需求曲线有两种形式
1.一种是需求随着价格上涨而下降
import matplotlib.pyplot as plt

# 定义需求函数
def demand_function(price):
  return 100 - price

# 创建数据点
prices = range(0, 101)
demands = [demand_function(price) for price in prices]

# 绘制需求曲线
plt.plot(prices, demands)
plt.xlabel("Price")
plt.ylabel("Demand")
plt.show()
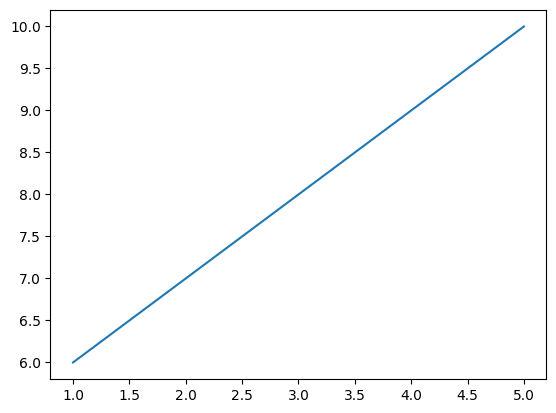
2.一种是需求随着价格上涨而上涨
import matplotlib.pyplot as plt

# 定义数据
x = [1, 2, 3, 4, 5]
y = [6, 7, 8, 9, 10]

# 创建图表
plt.plot(x, y)

# 显示图表
plt.show()