1、SpringBoot应用暴露监控指标
maven依赖
    <dependency>
        <groupId>org.springframework.boot</groupId>
        <artifactId>spring-boot-starter-actuator</artifactId>
    </dependency>
    <dependency>
        <groupId>io.micrometer</groupId>
        <artifactId>micrometer-registry-prometheus</artifactId>
    </dependency>
配置
server.port=8080
management.endpoints.web.exposure.include=*
启动应用程序,访问http://localhost:8080/actuator/prometheus,可以看到指标数据。

2、Prometheus采集应用指标数据
使用docker安装Prometheus
docker pull prom/prometheus
创建prometheus.yml配置文件
#Global configurations
global:
  scrape_interval: 10s
  scrape_timeout: 10s
  evaluation_interval: 10s
scrape_configs:
  - job_name: prometheus
    scrape_interval: 5s
    scrape_timeout: 5s
    metrics_path: /actuator/prometheus
    scheme: http
    static_configs:
      - targets:
        - 192.168.68.49:8080  #SpringBoot应用程序访问地址
启动Prometheus
docker run -d --name prometheus \
-p 9090:9090 -m 500M \
-v "/xx/prometheus.yml":/prometheus.yml \
-v "/xx/Tools/data":/data \
prom/prometheus \
--config.file=/prometheus.yml \
--log.level=info
/xx 是上面创建的prometheus.yml文件存放地址。
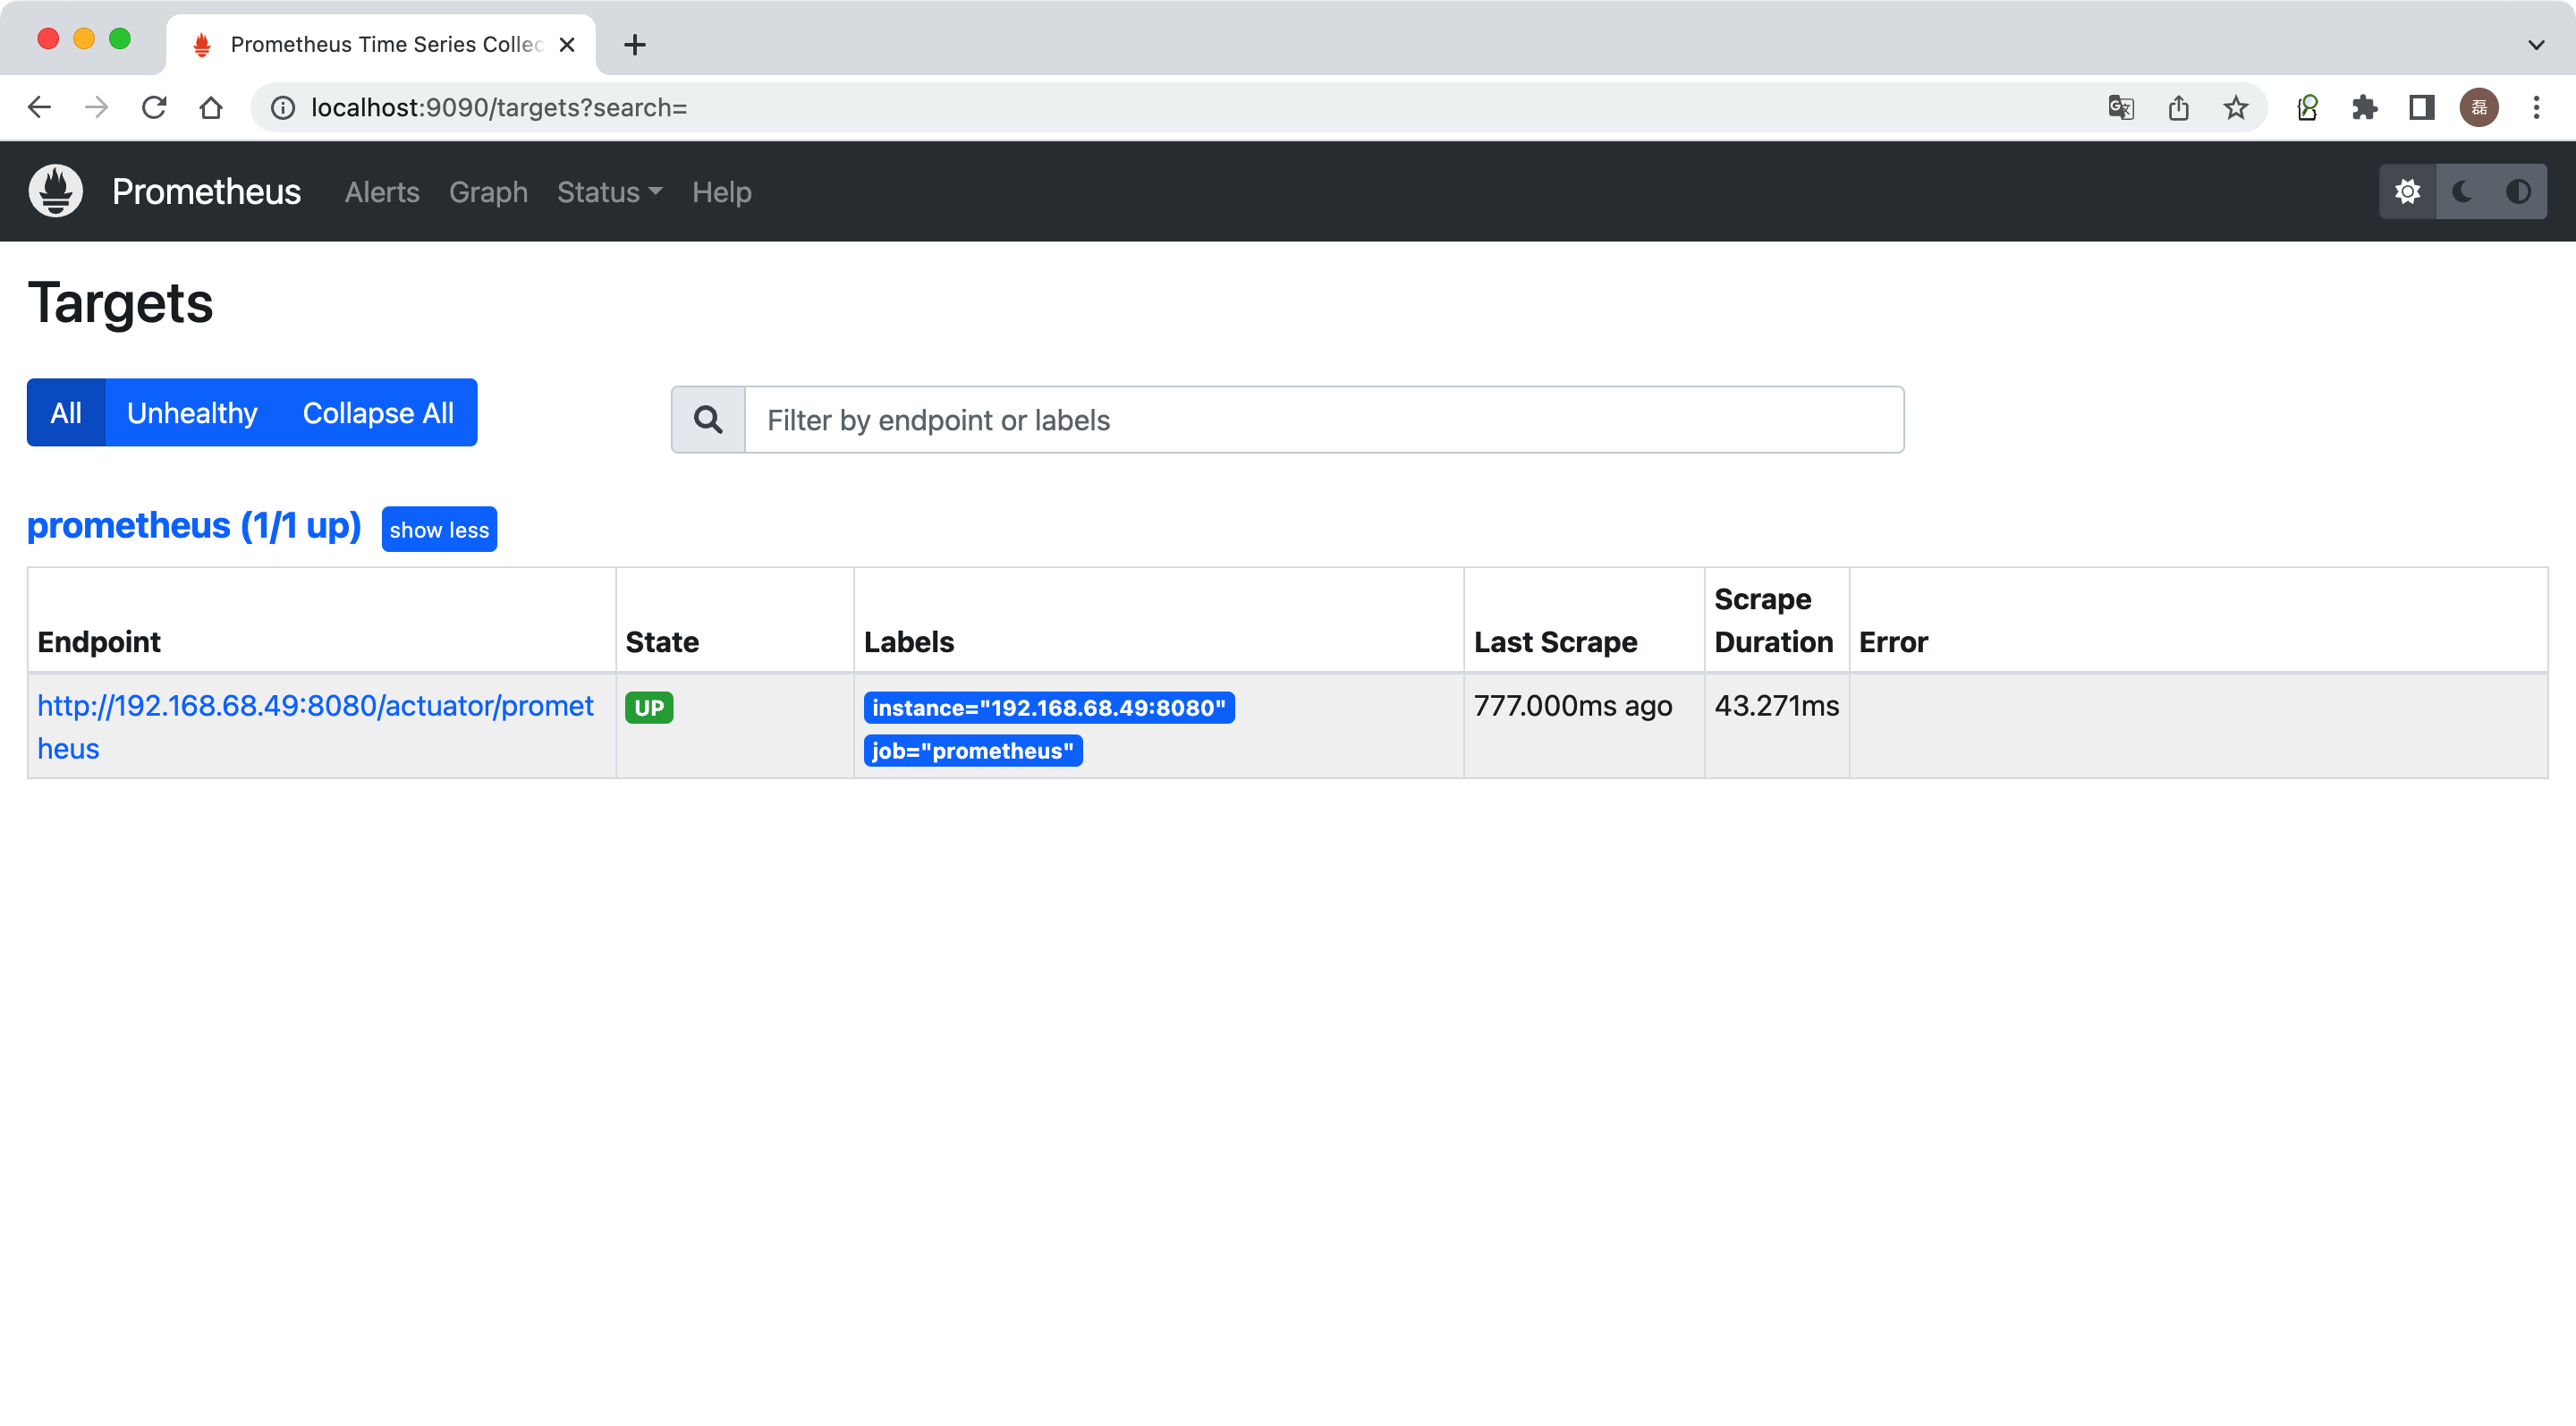
访问http://localhost:9090/targets,检查应用采集状态是否正常。
3、Grafana可视化监控数据
使用docker安装Grafana
docker pull grafana/grafana
启动Grafana
docker run --name grafana -d -p 3000:3000 grafana/grafana
访问http://localhost:3000
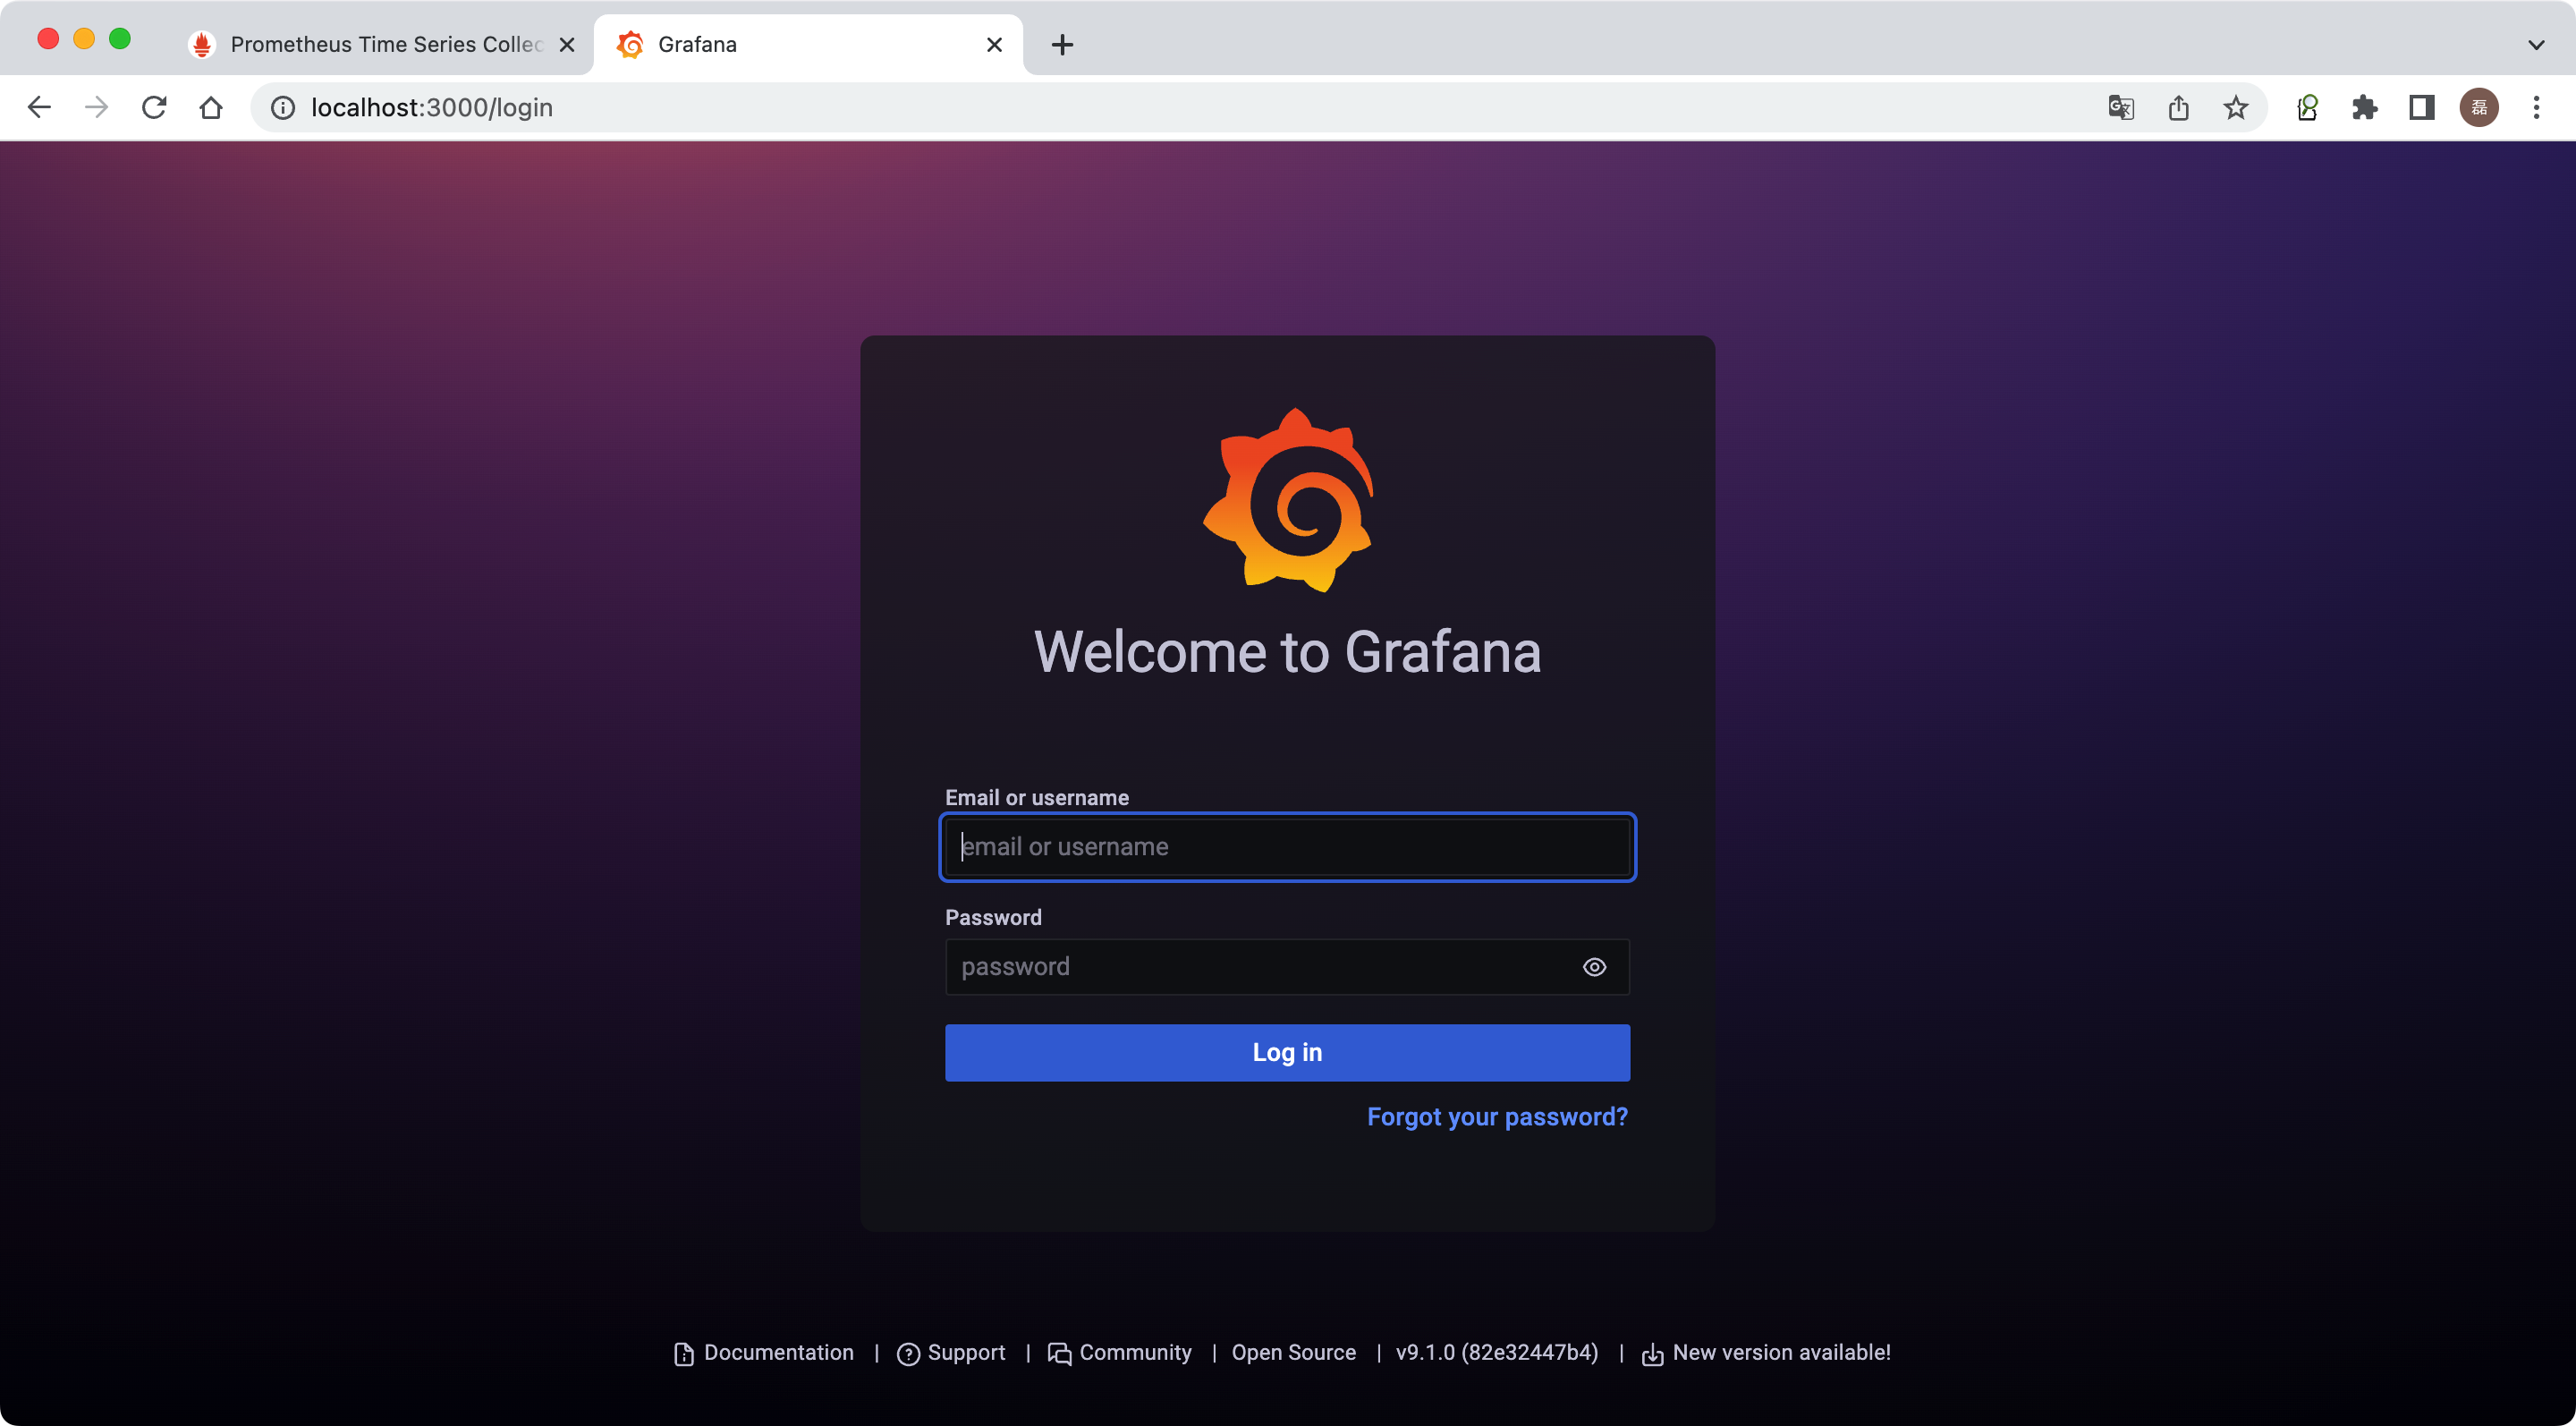
登录Grafana,用户名密码默认:admin/admin
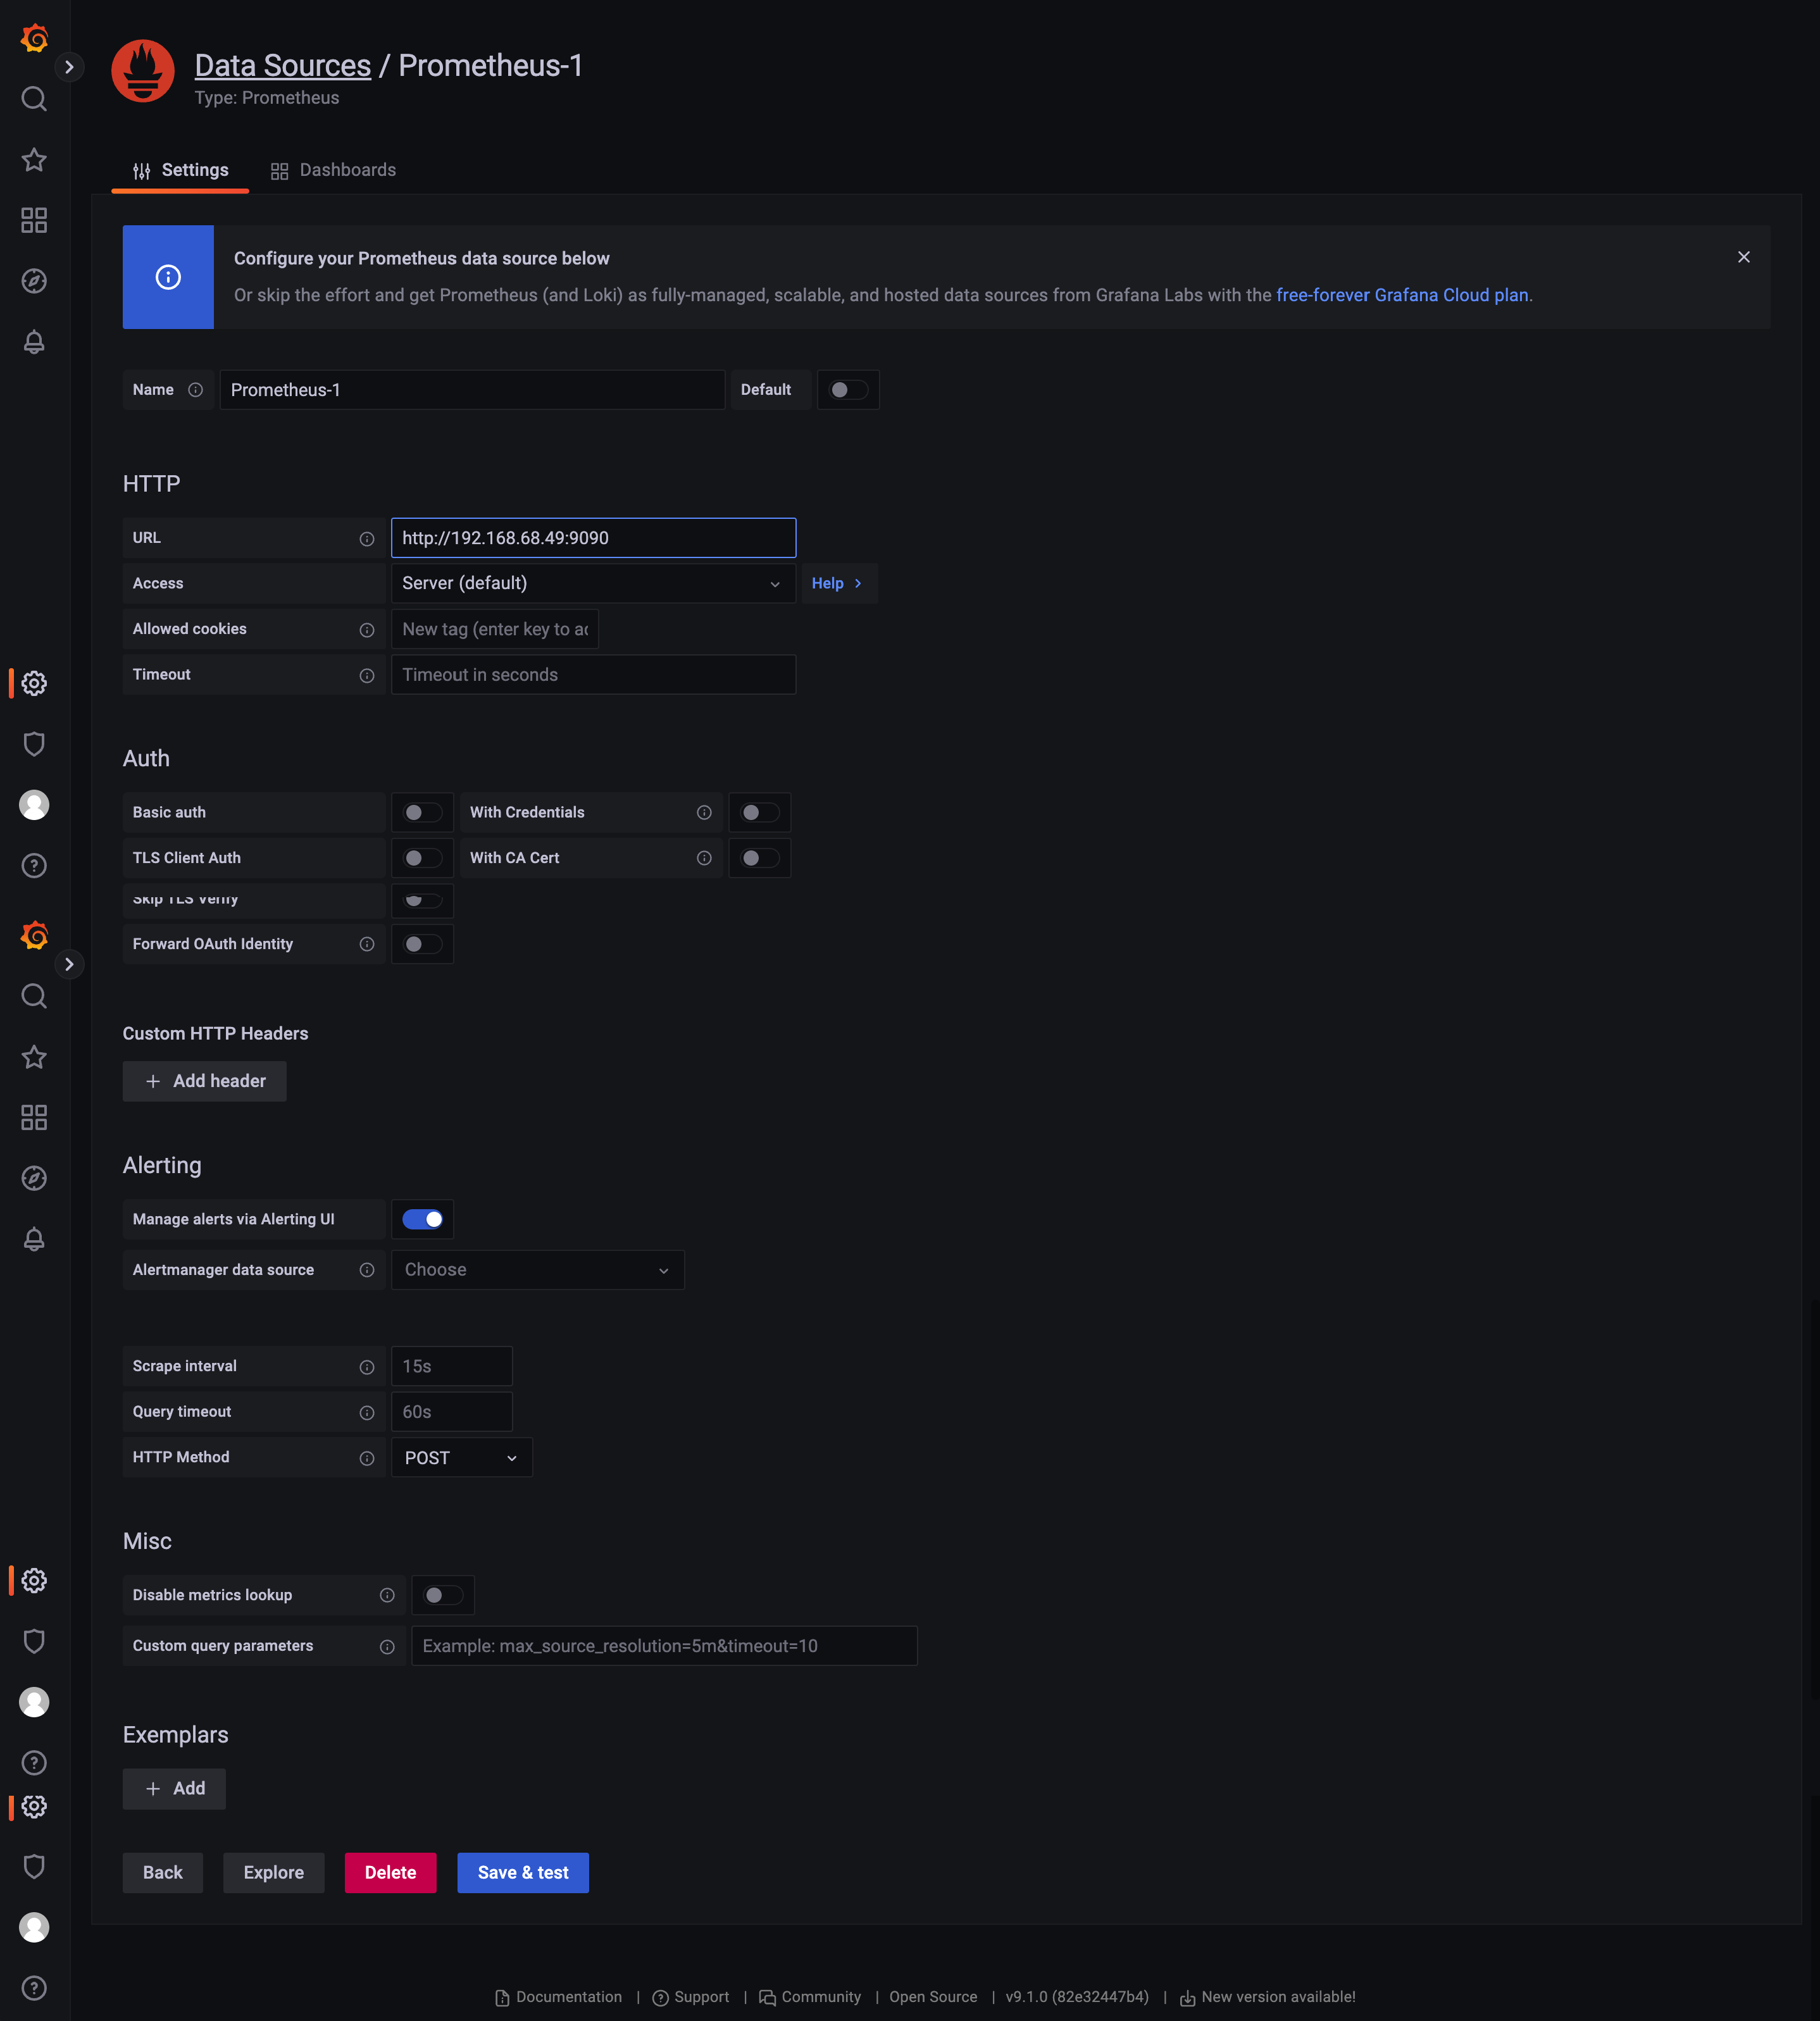
配置数据源
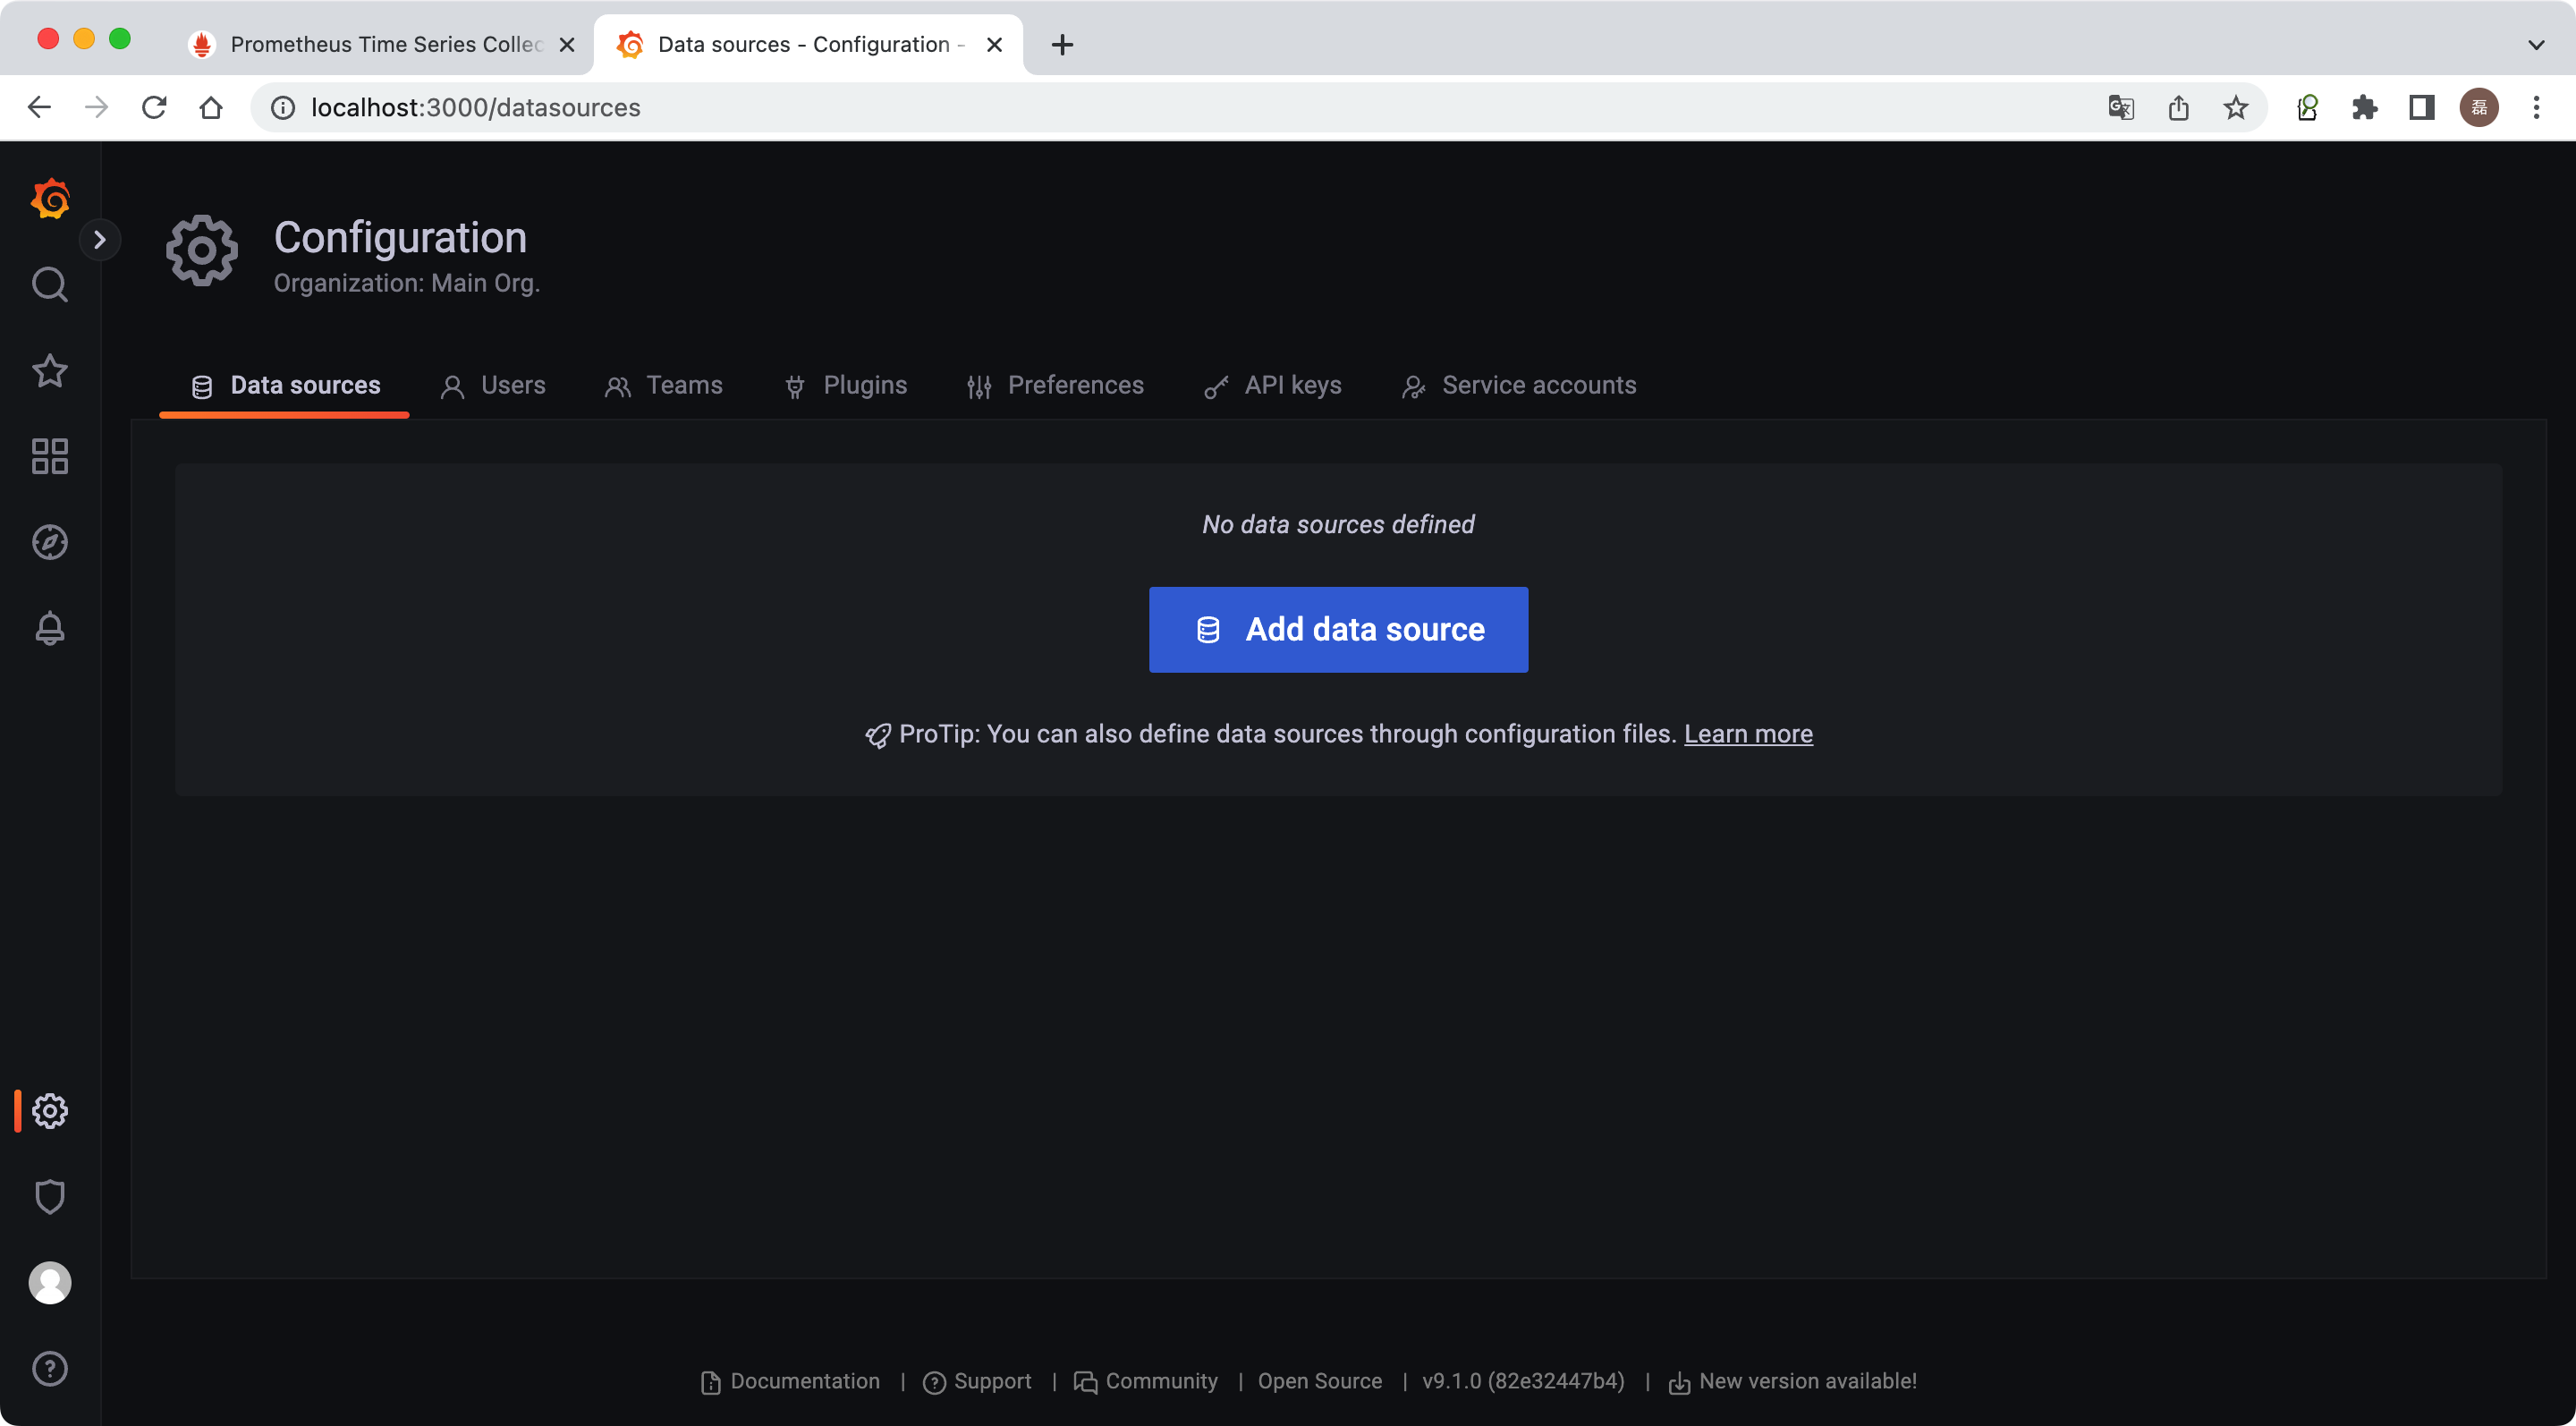
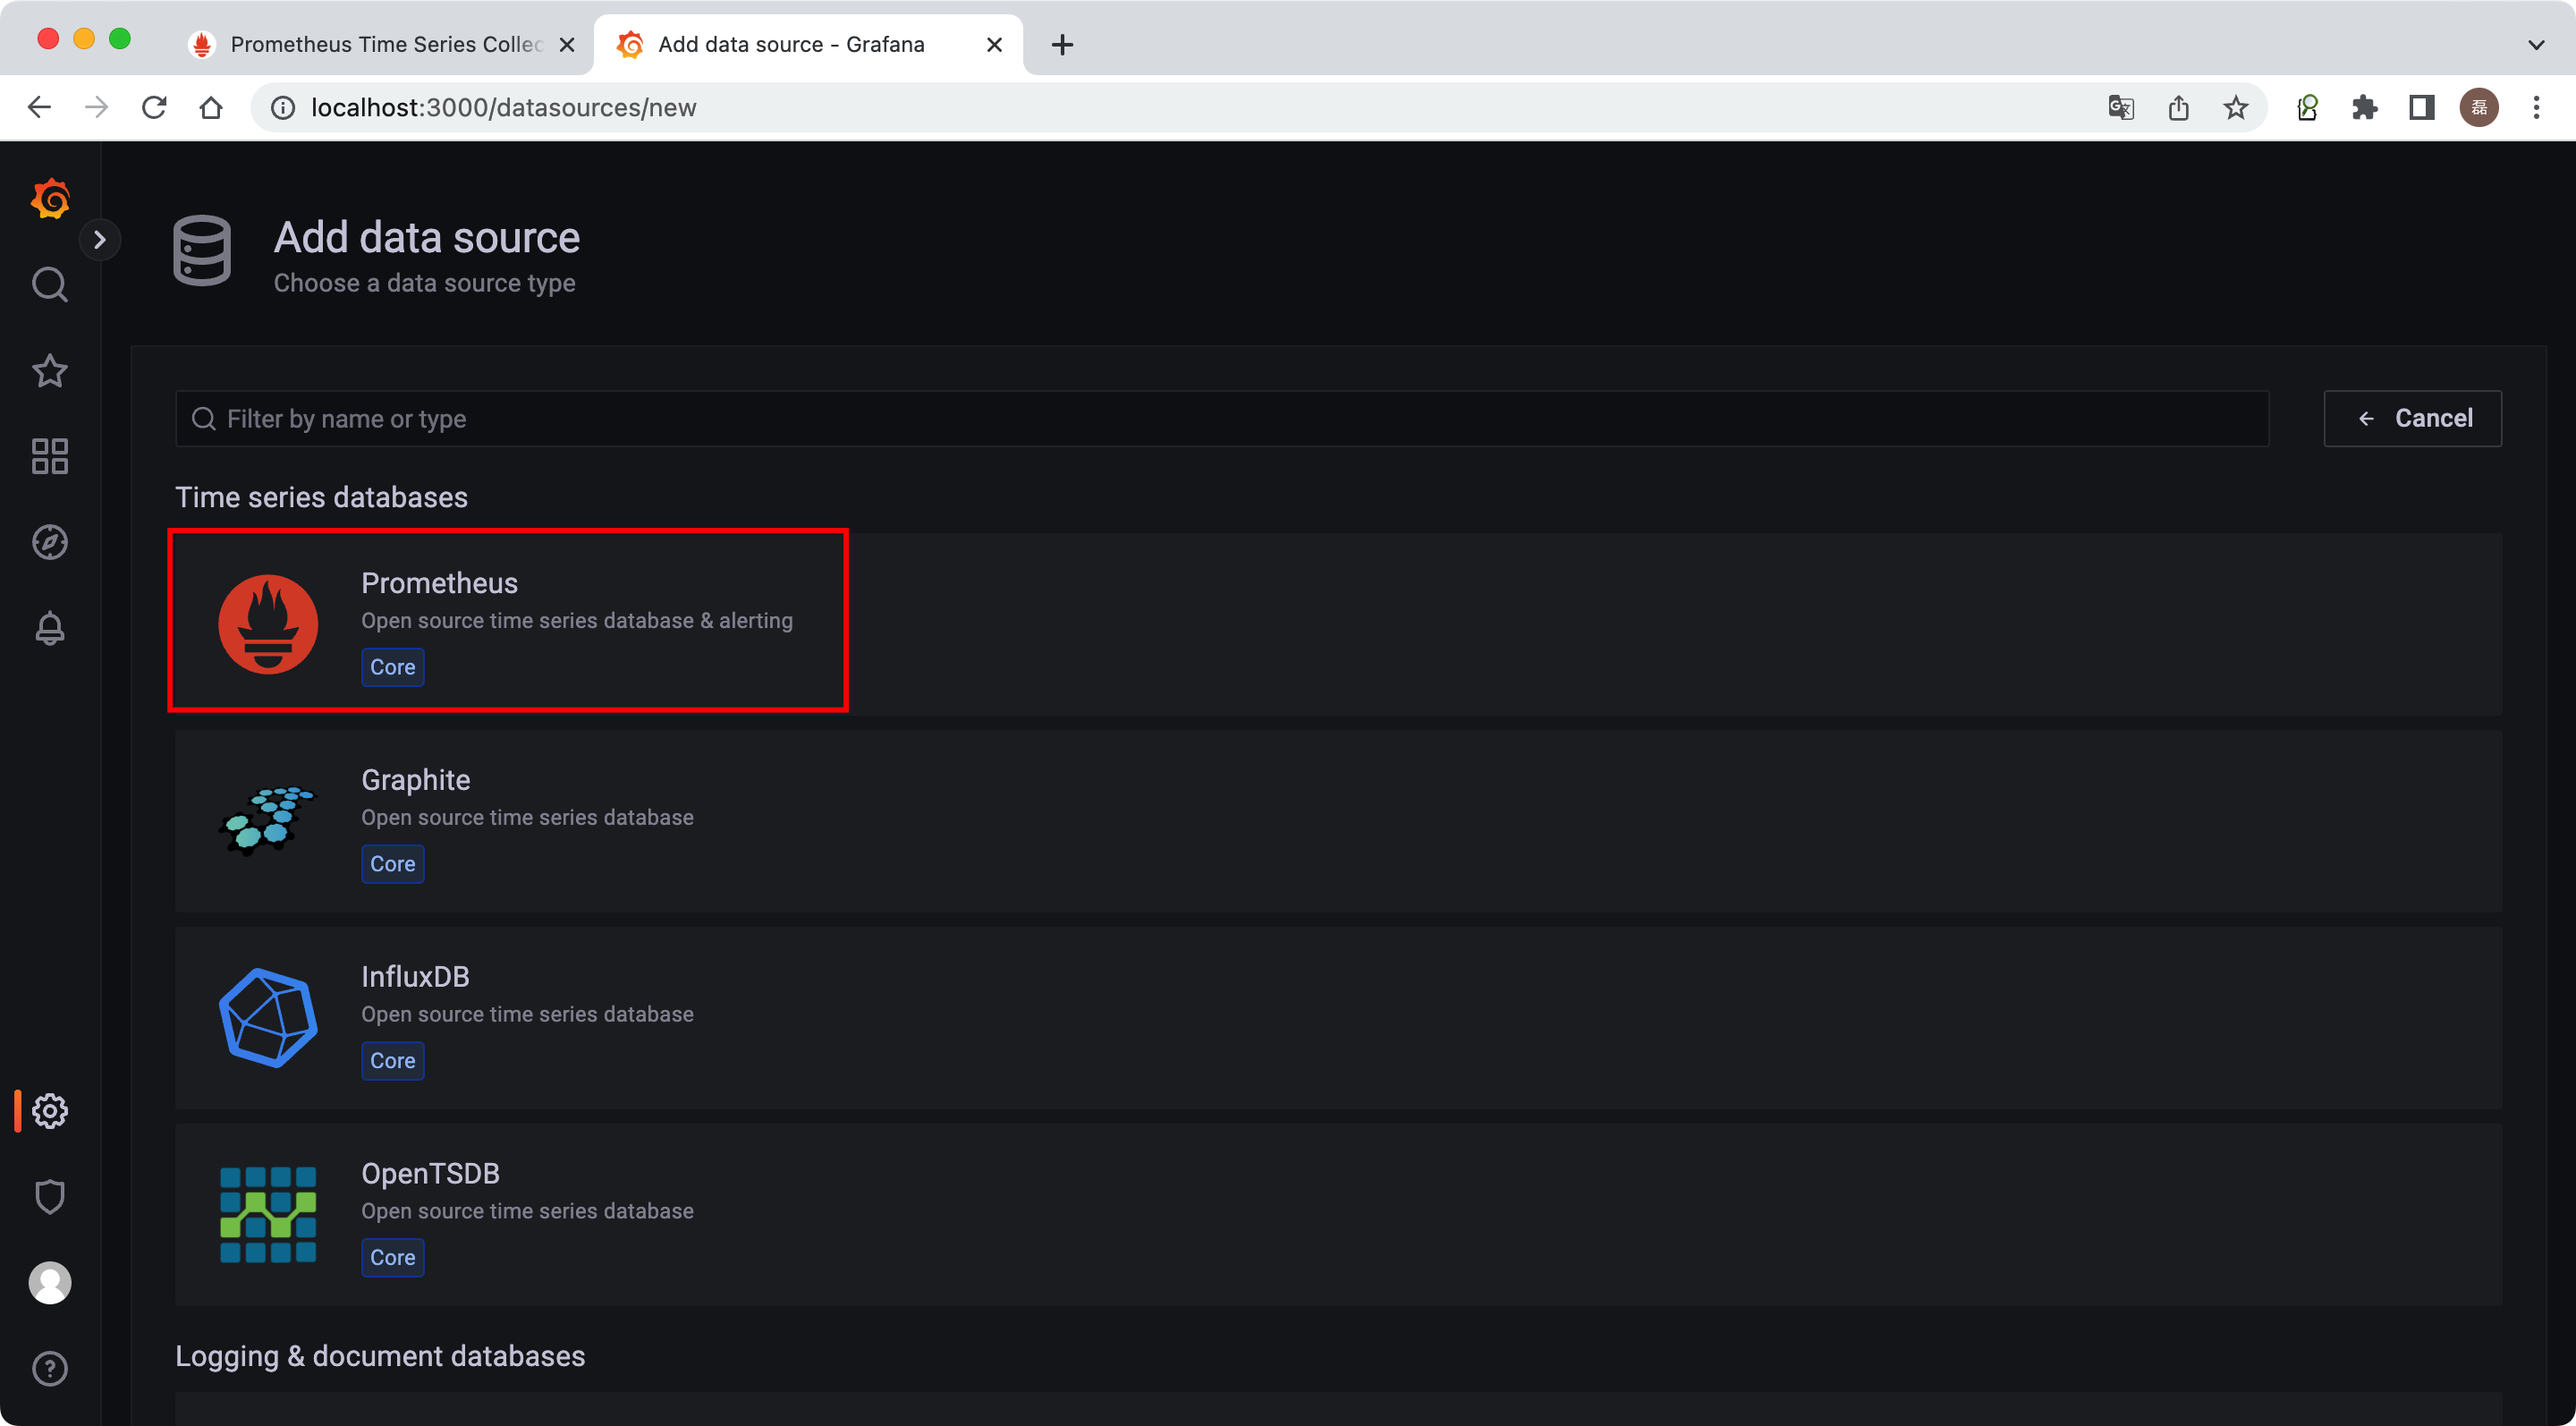
保存并测试
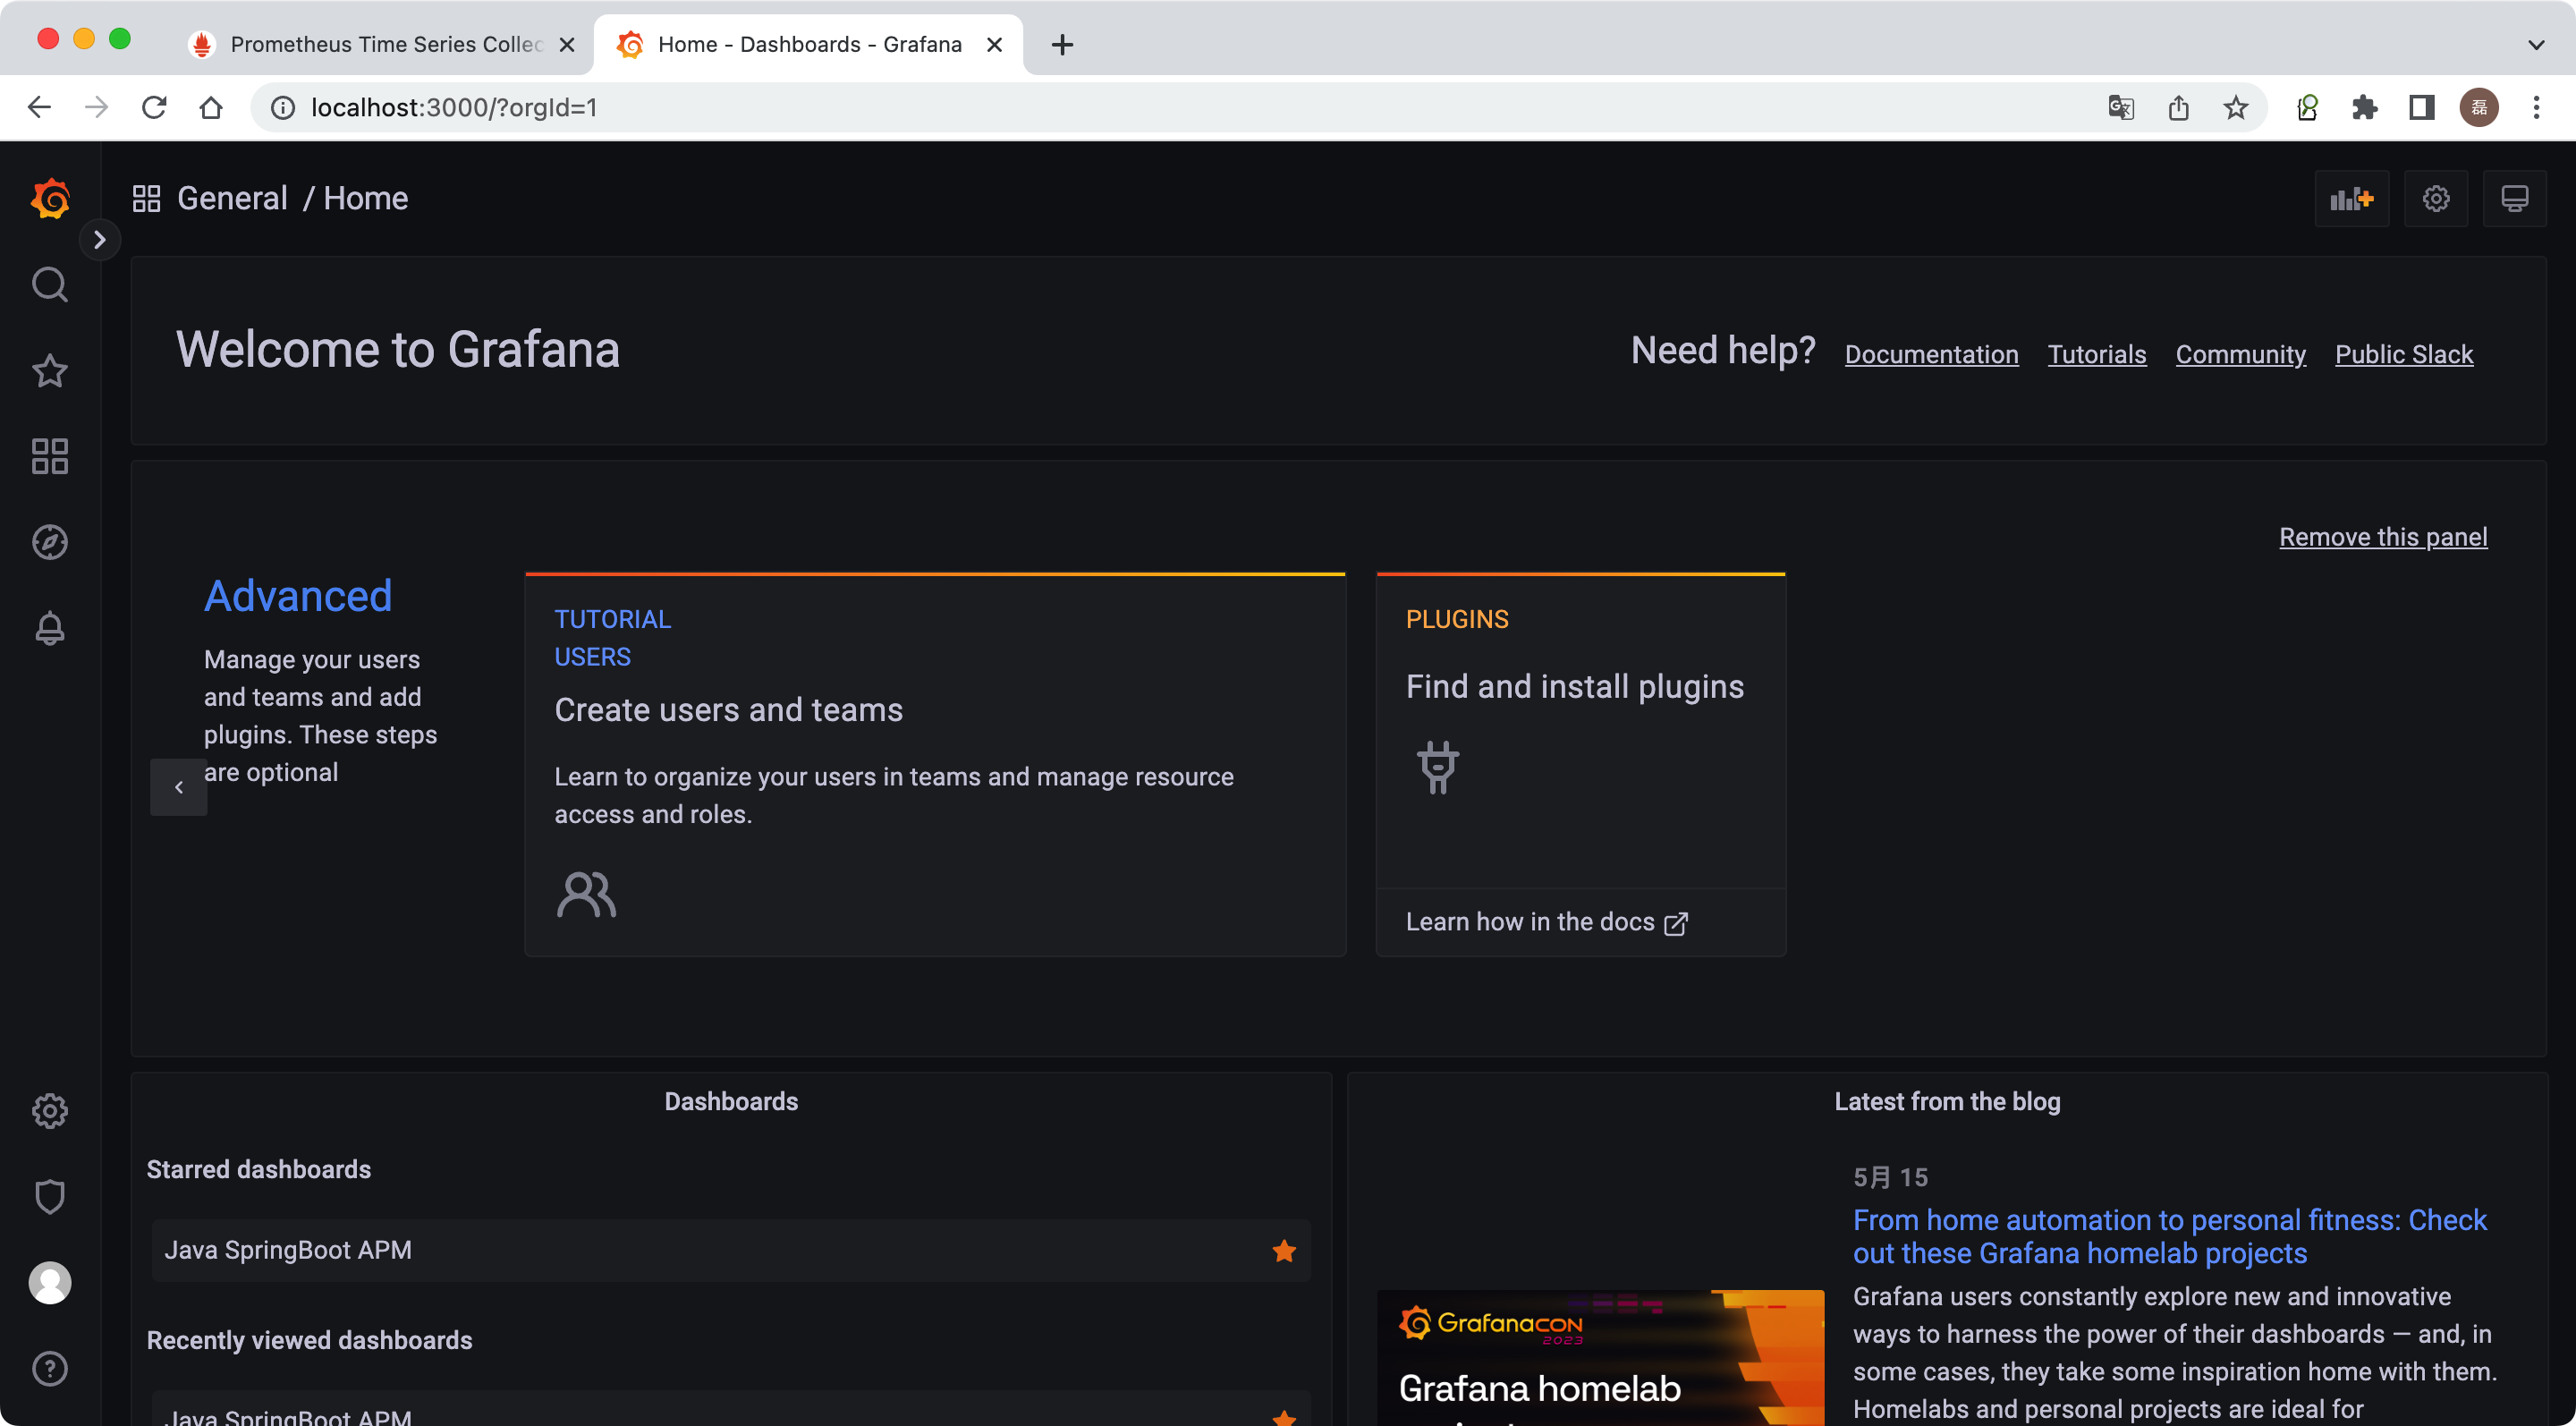
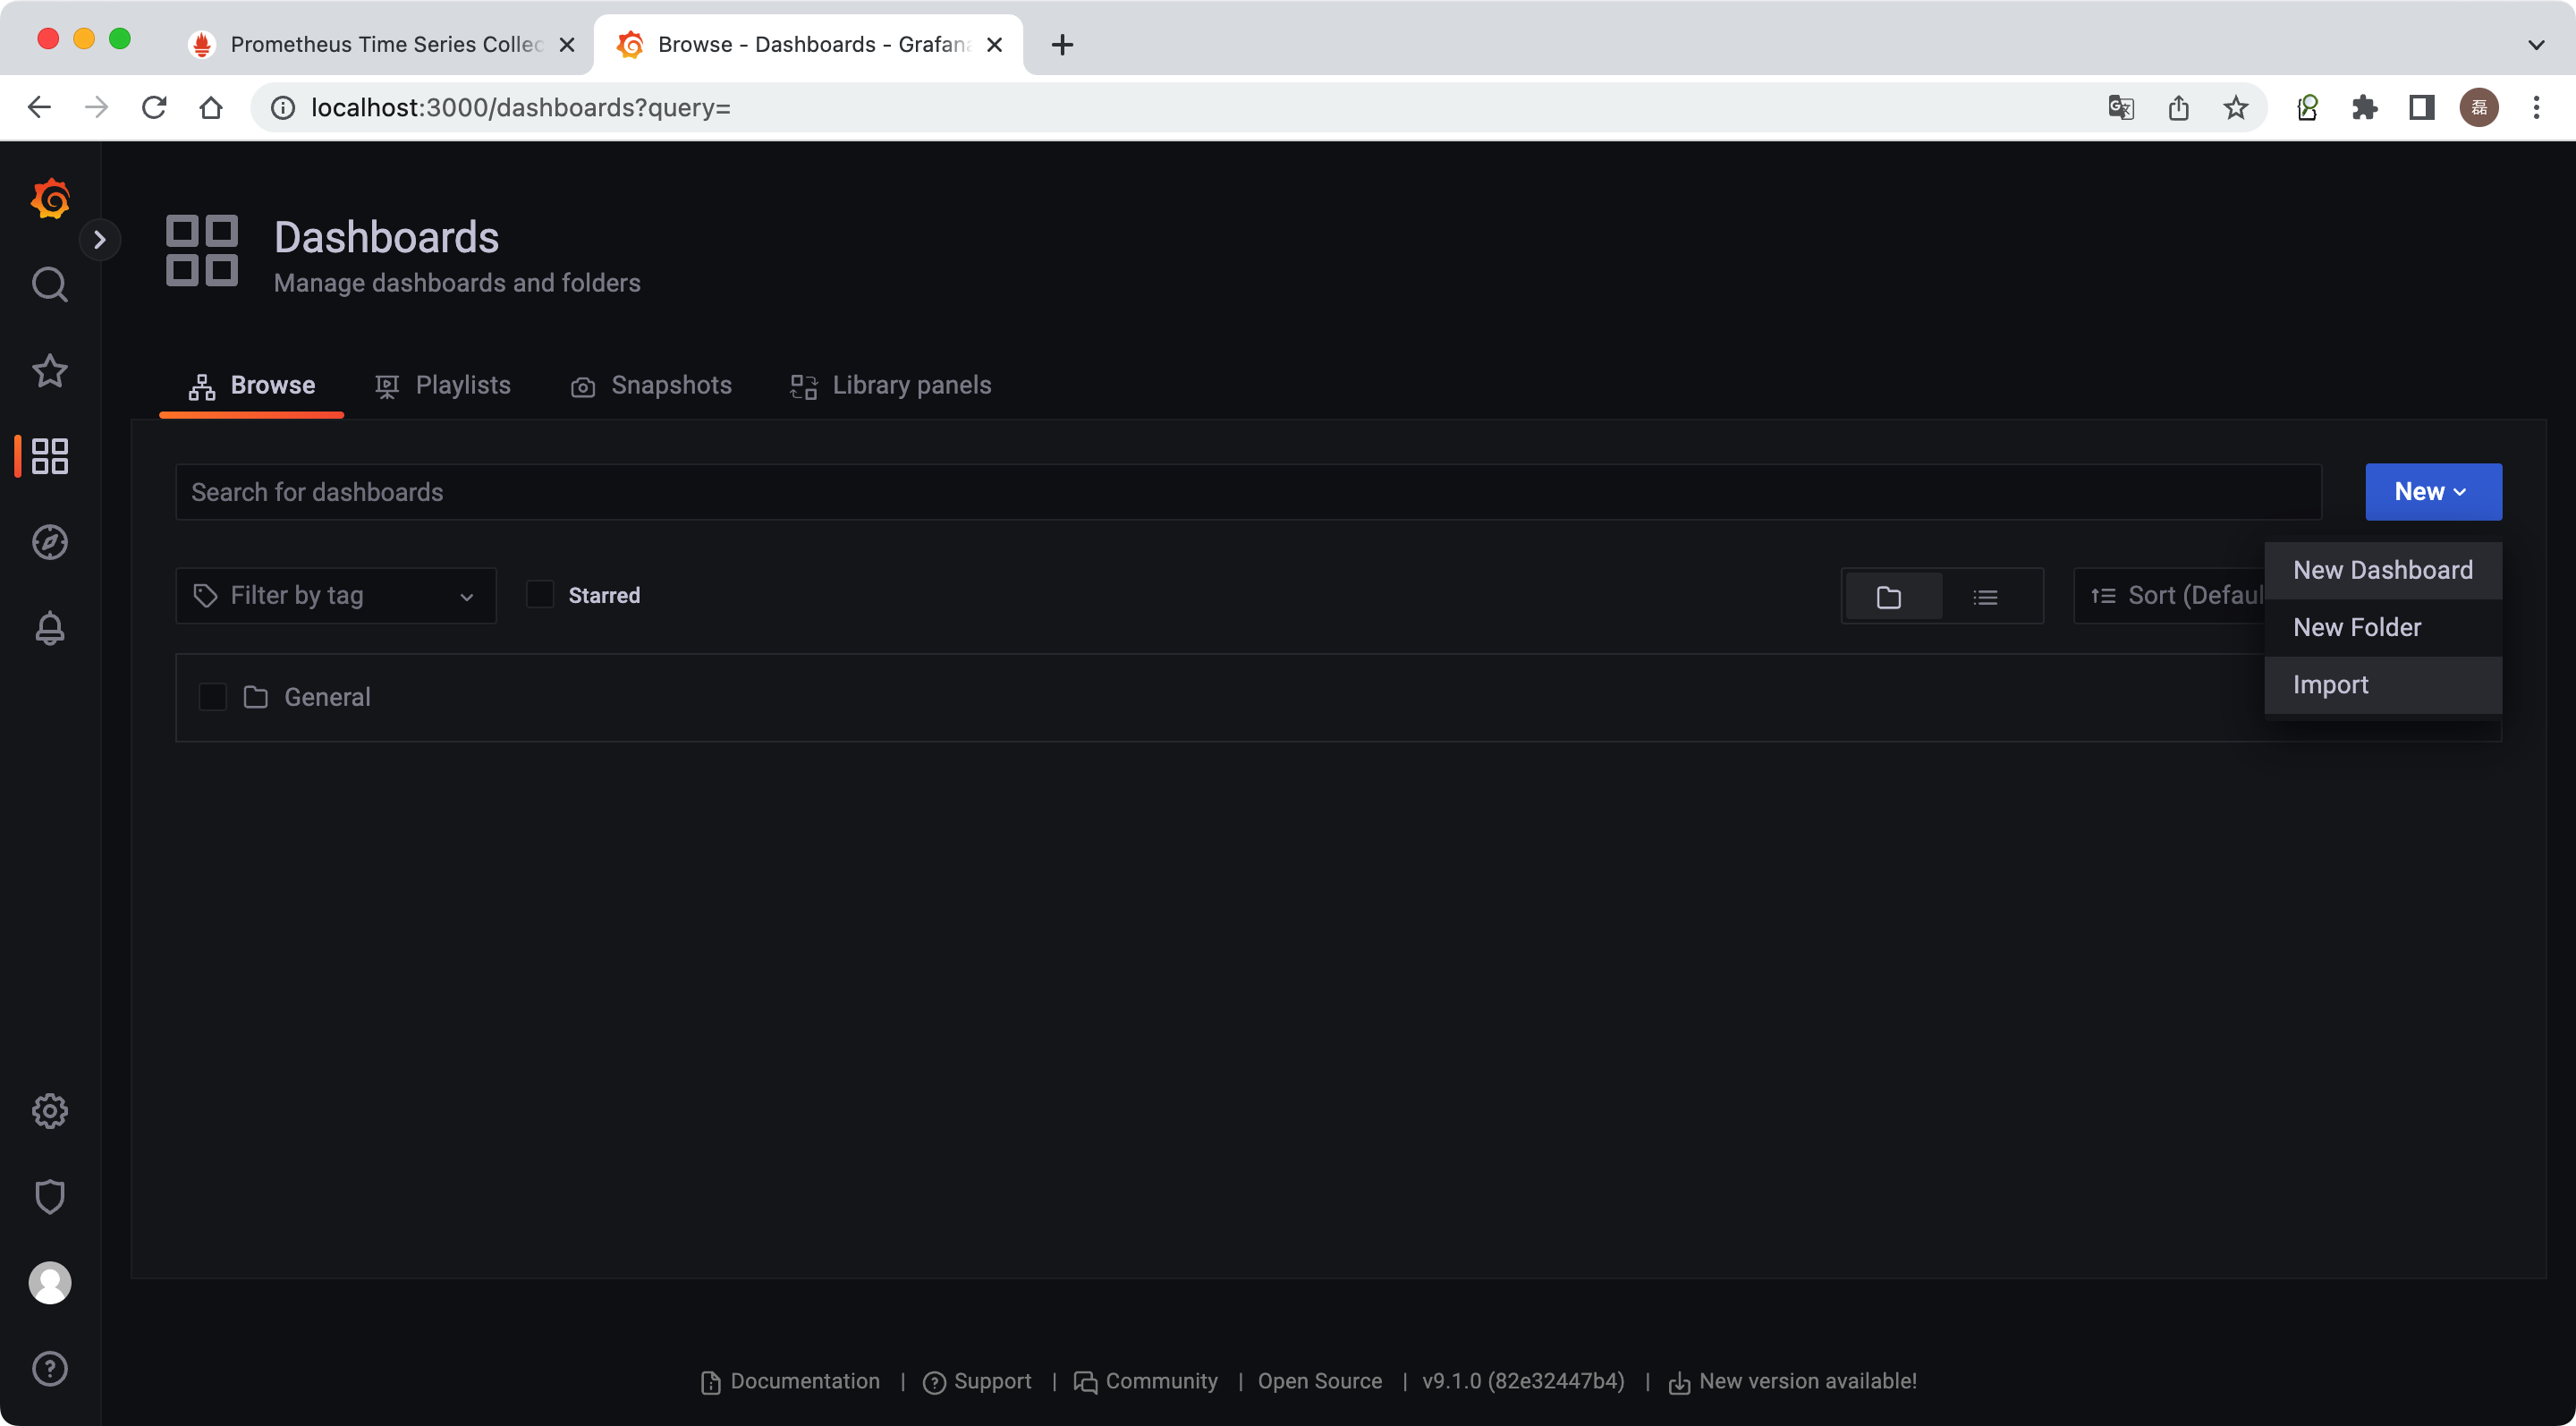
进入Dashboards
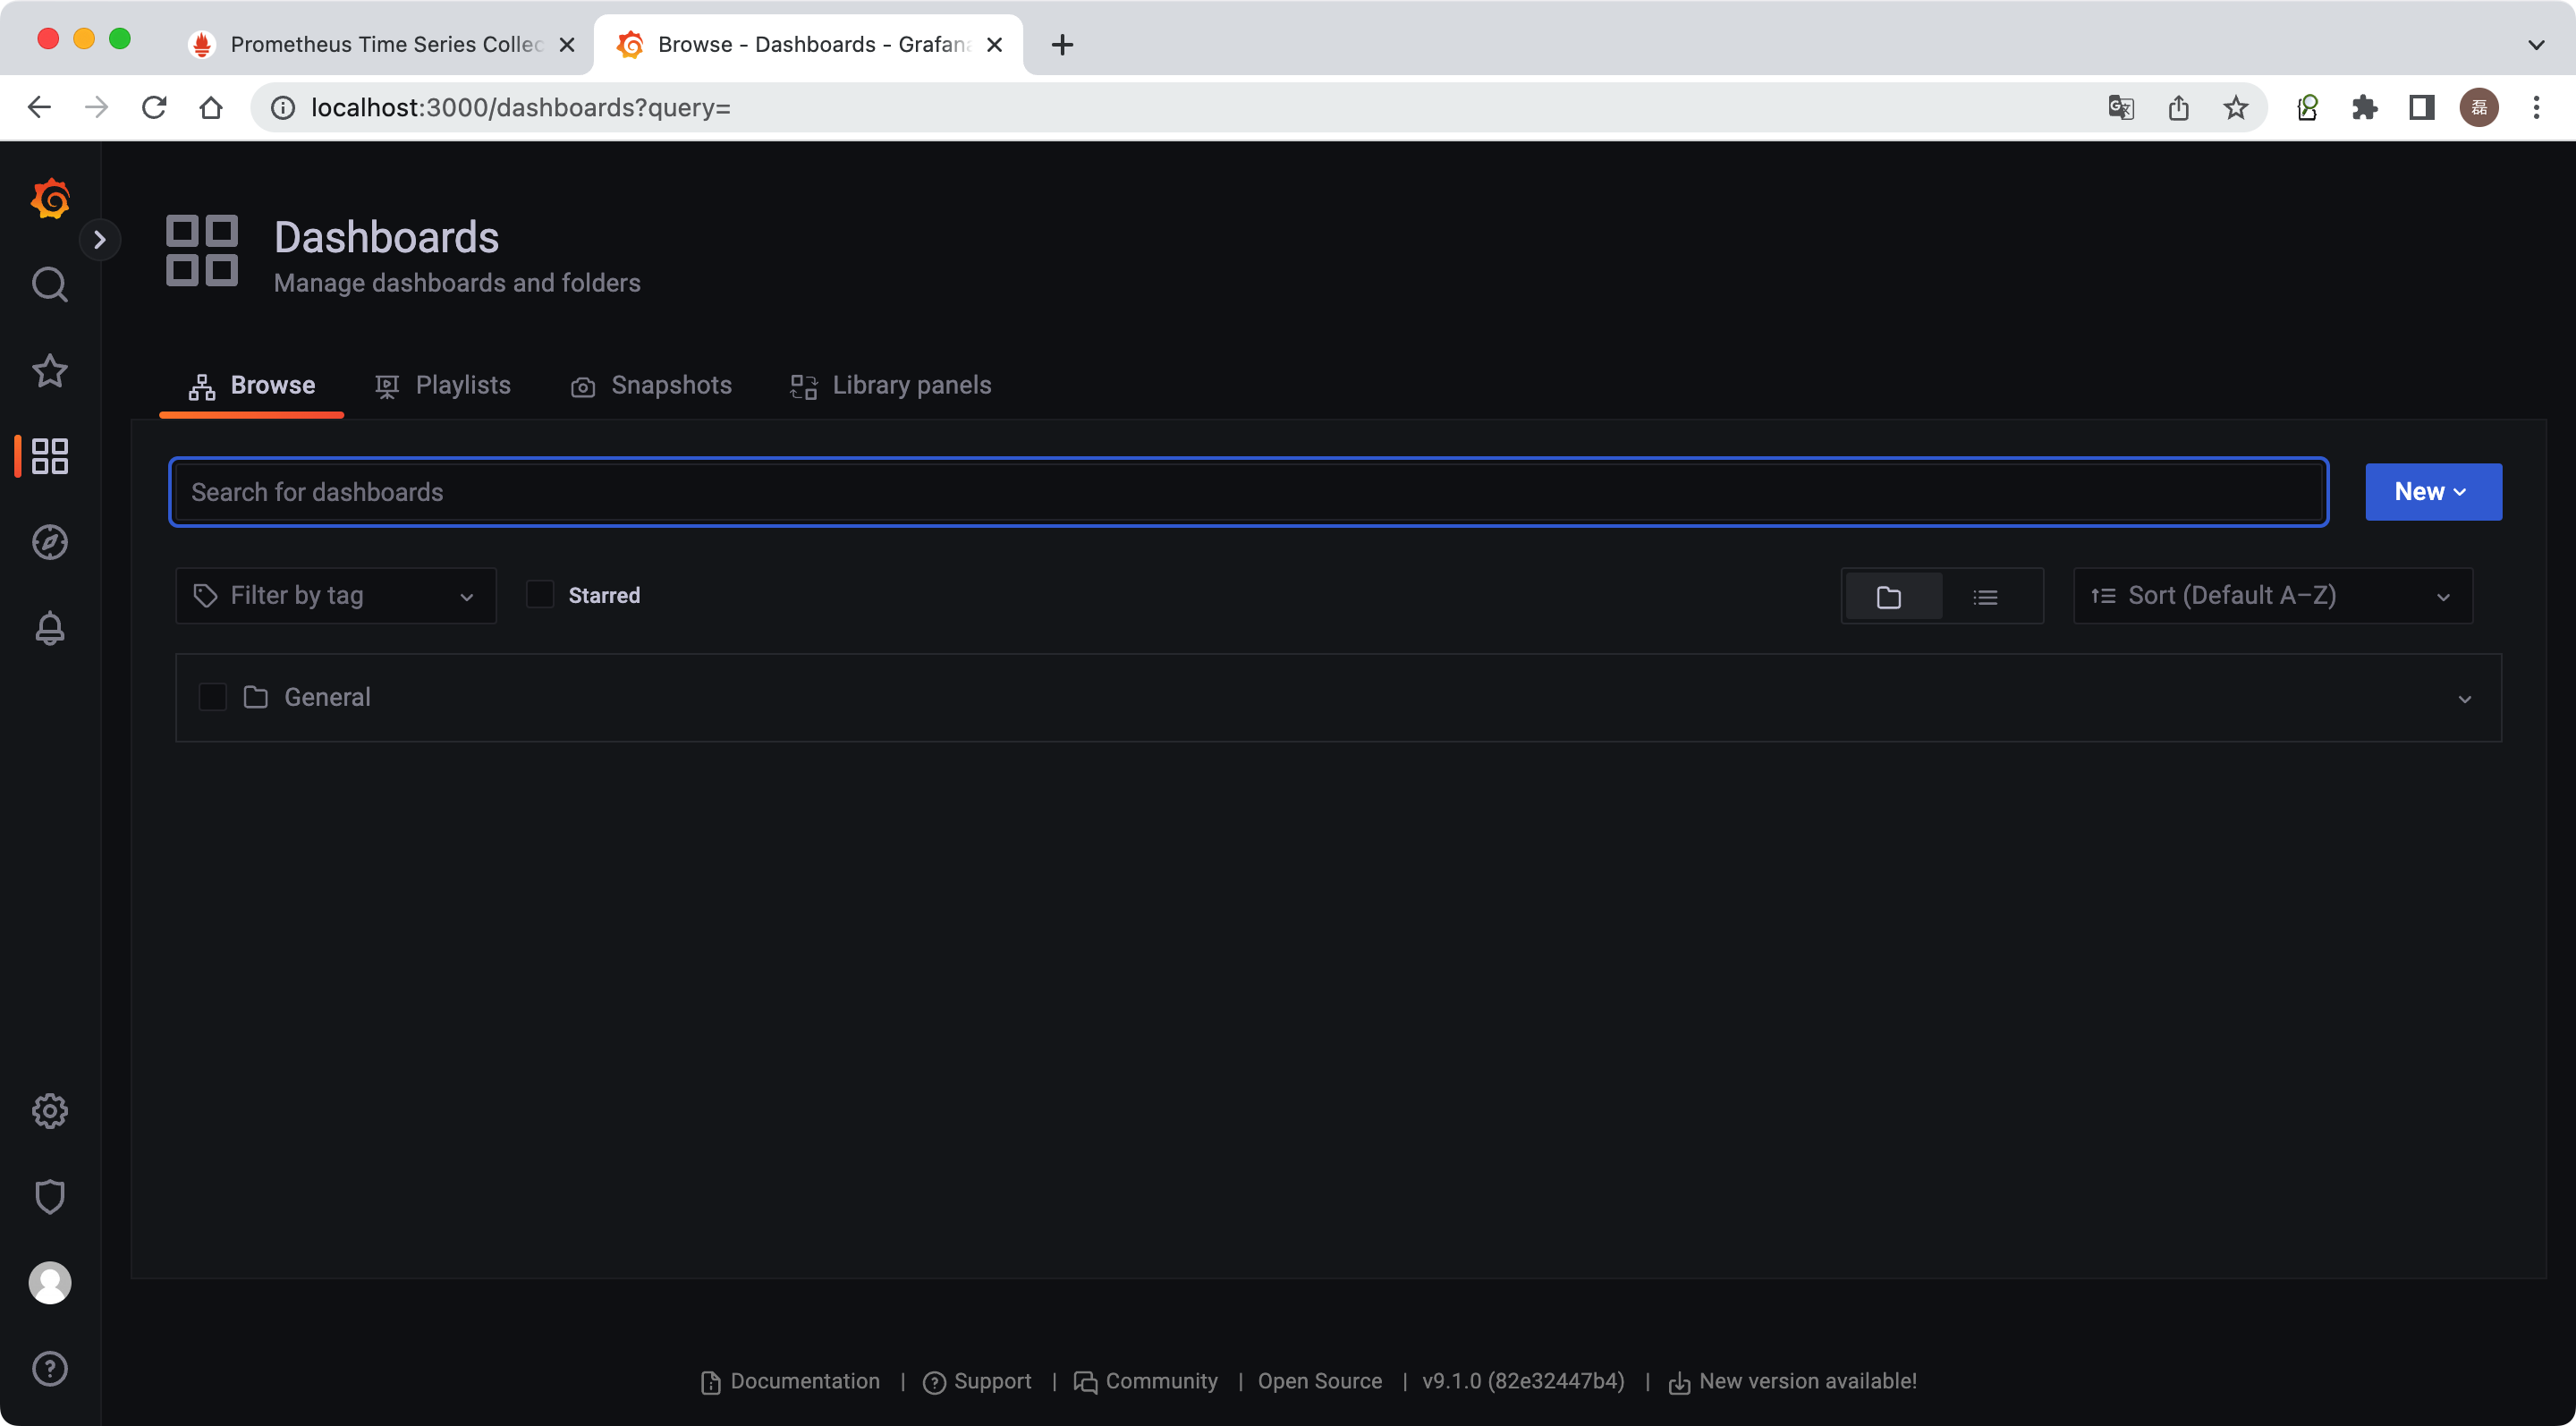
监控面板可以自行新建,也可以进行导入,这里选择导入。
访问https://grafana.com/grafana/dashboards/进行搜索
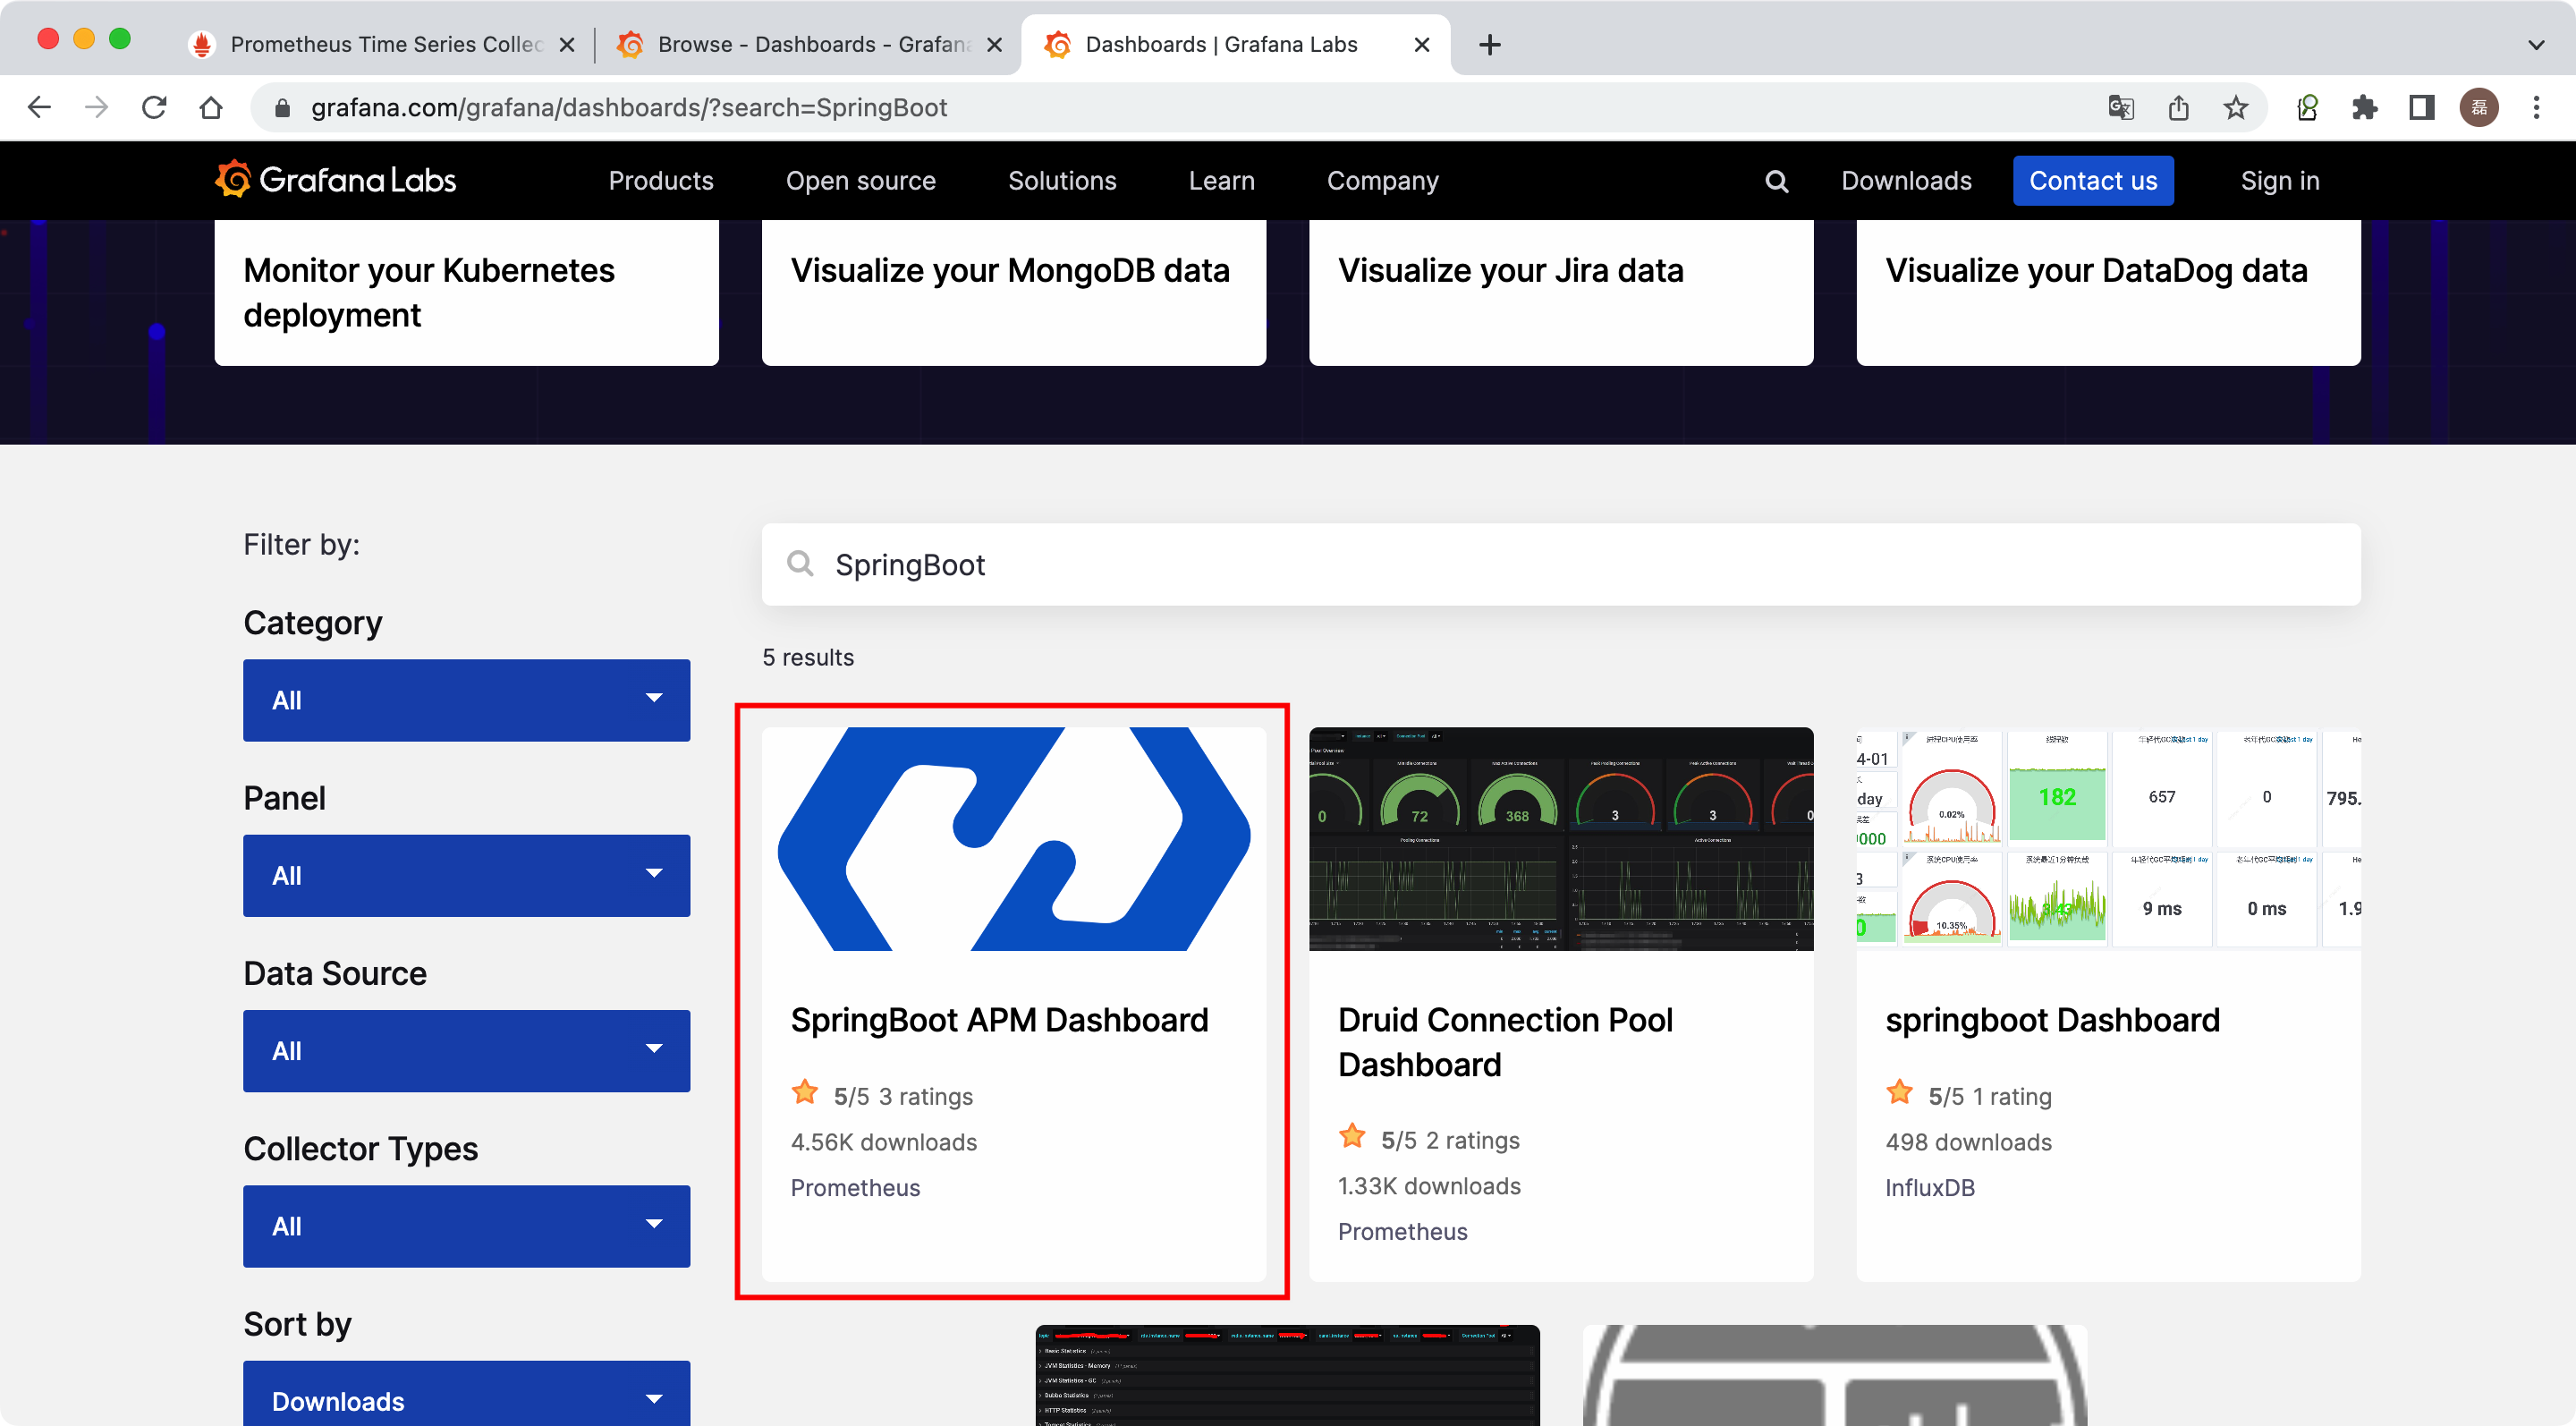
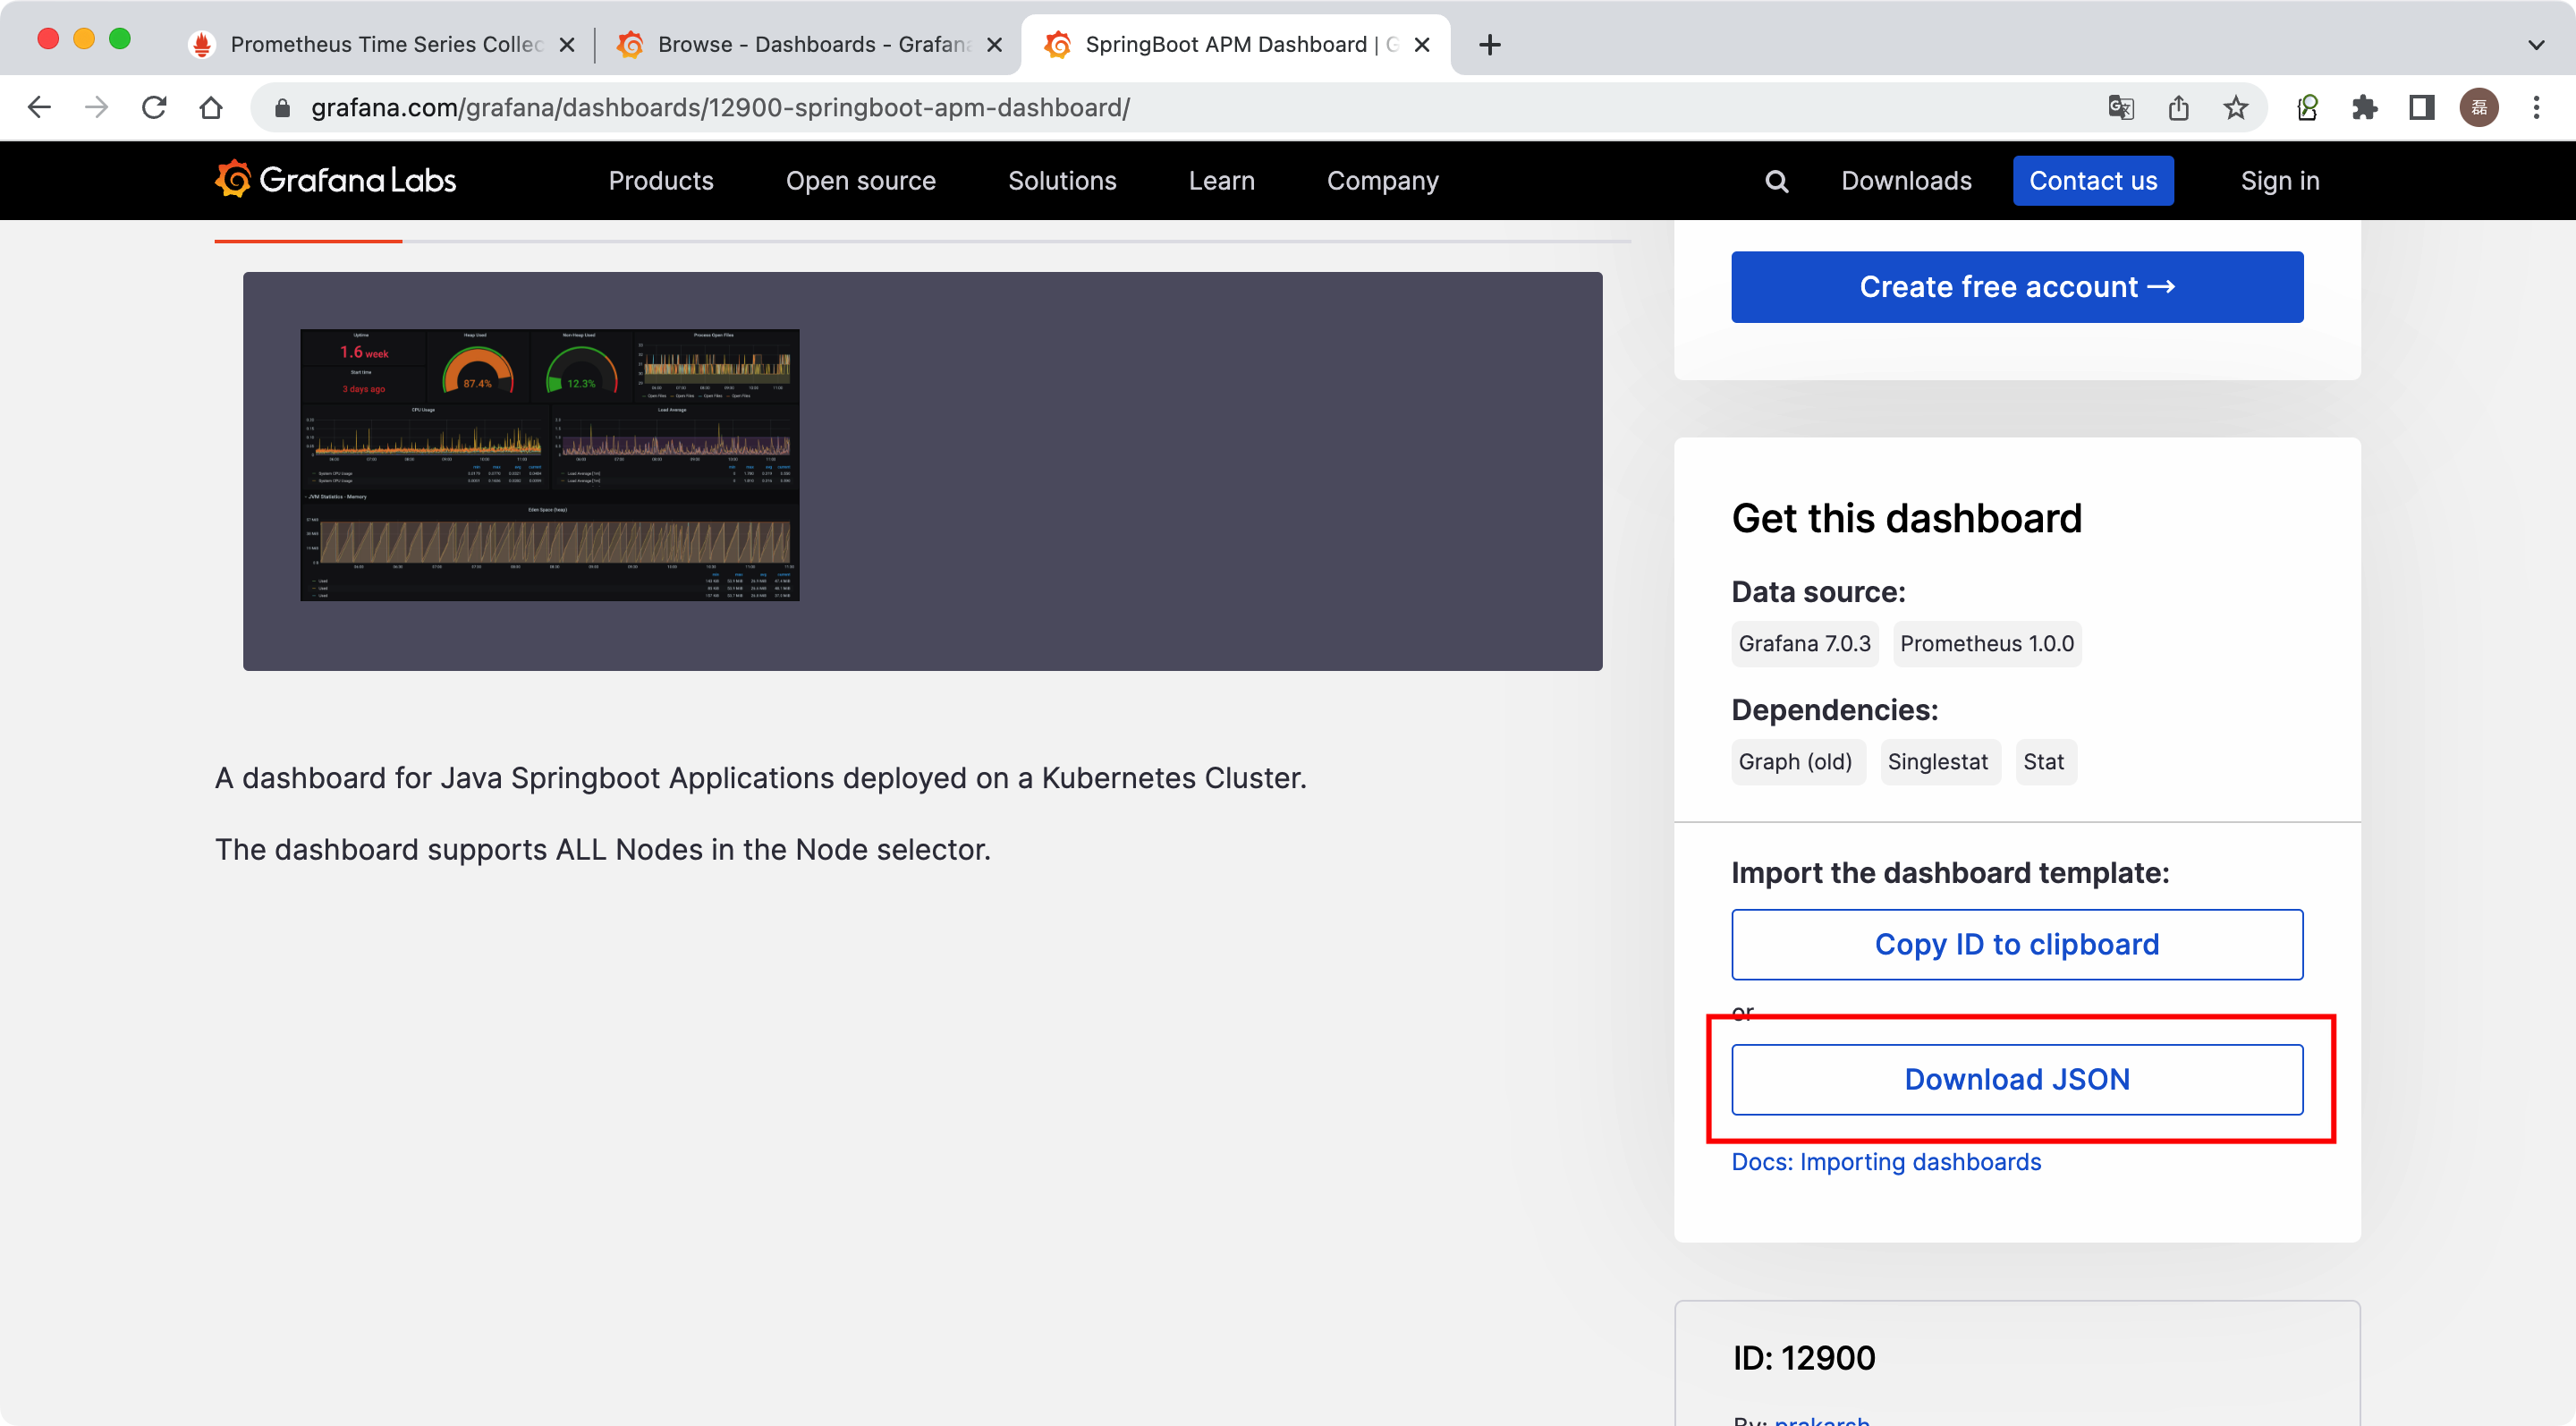
下载完成后进行导入
选择数据源导入
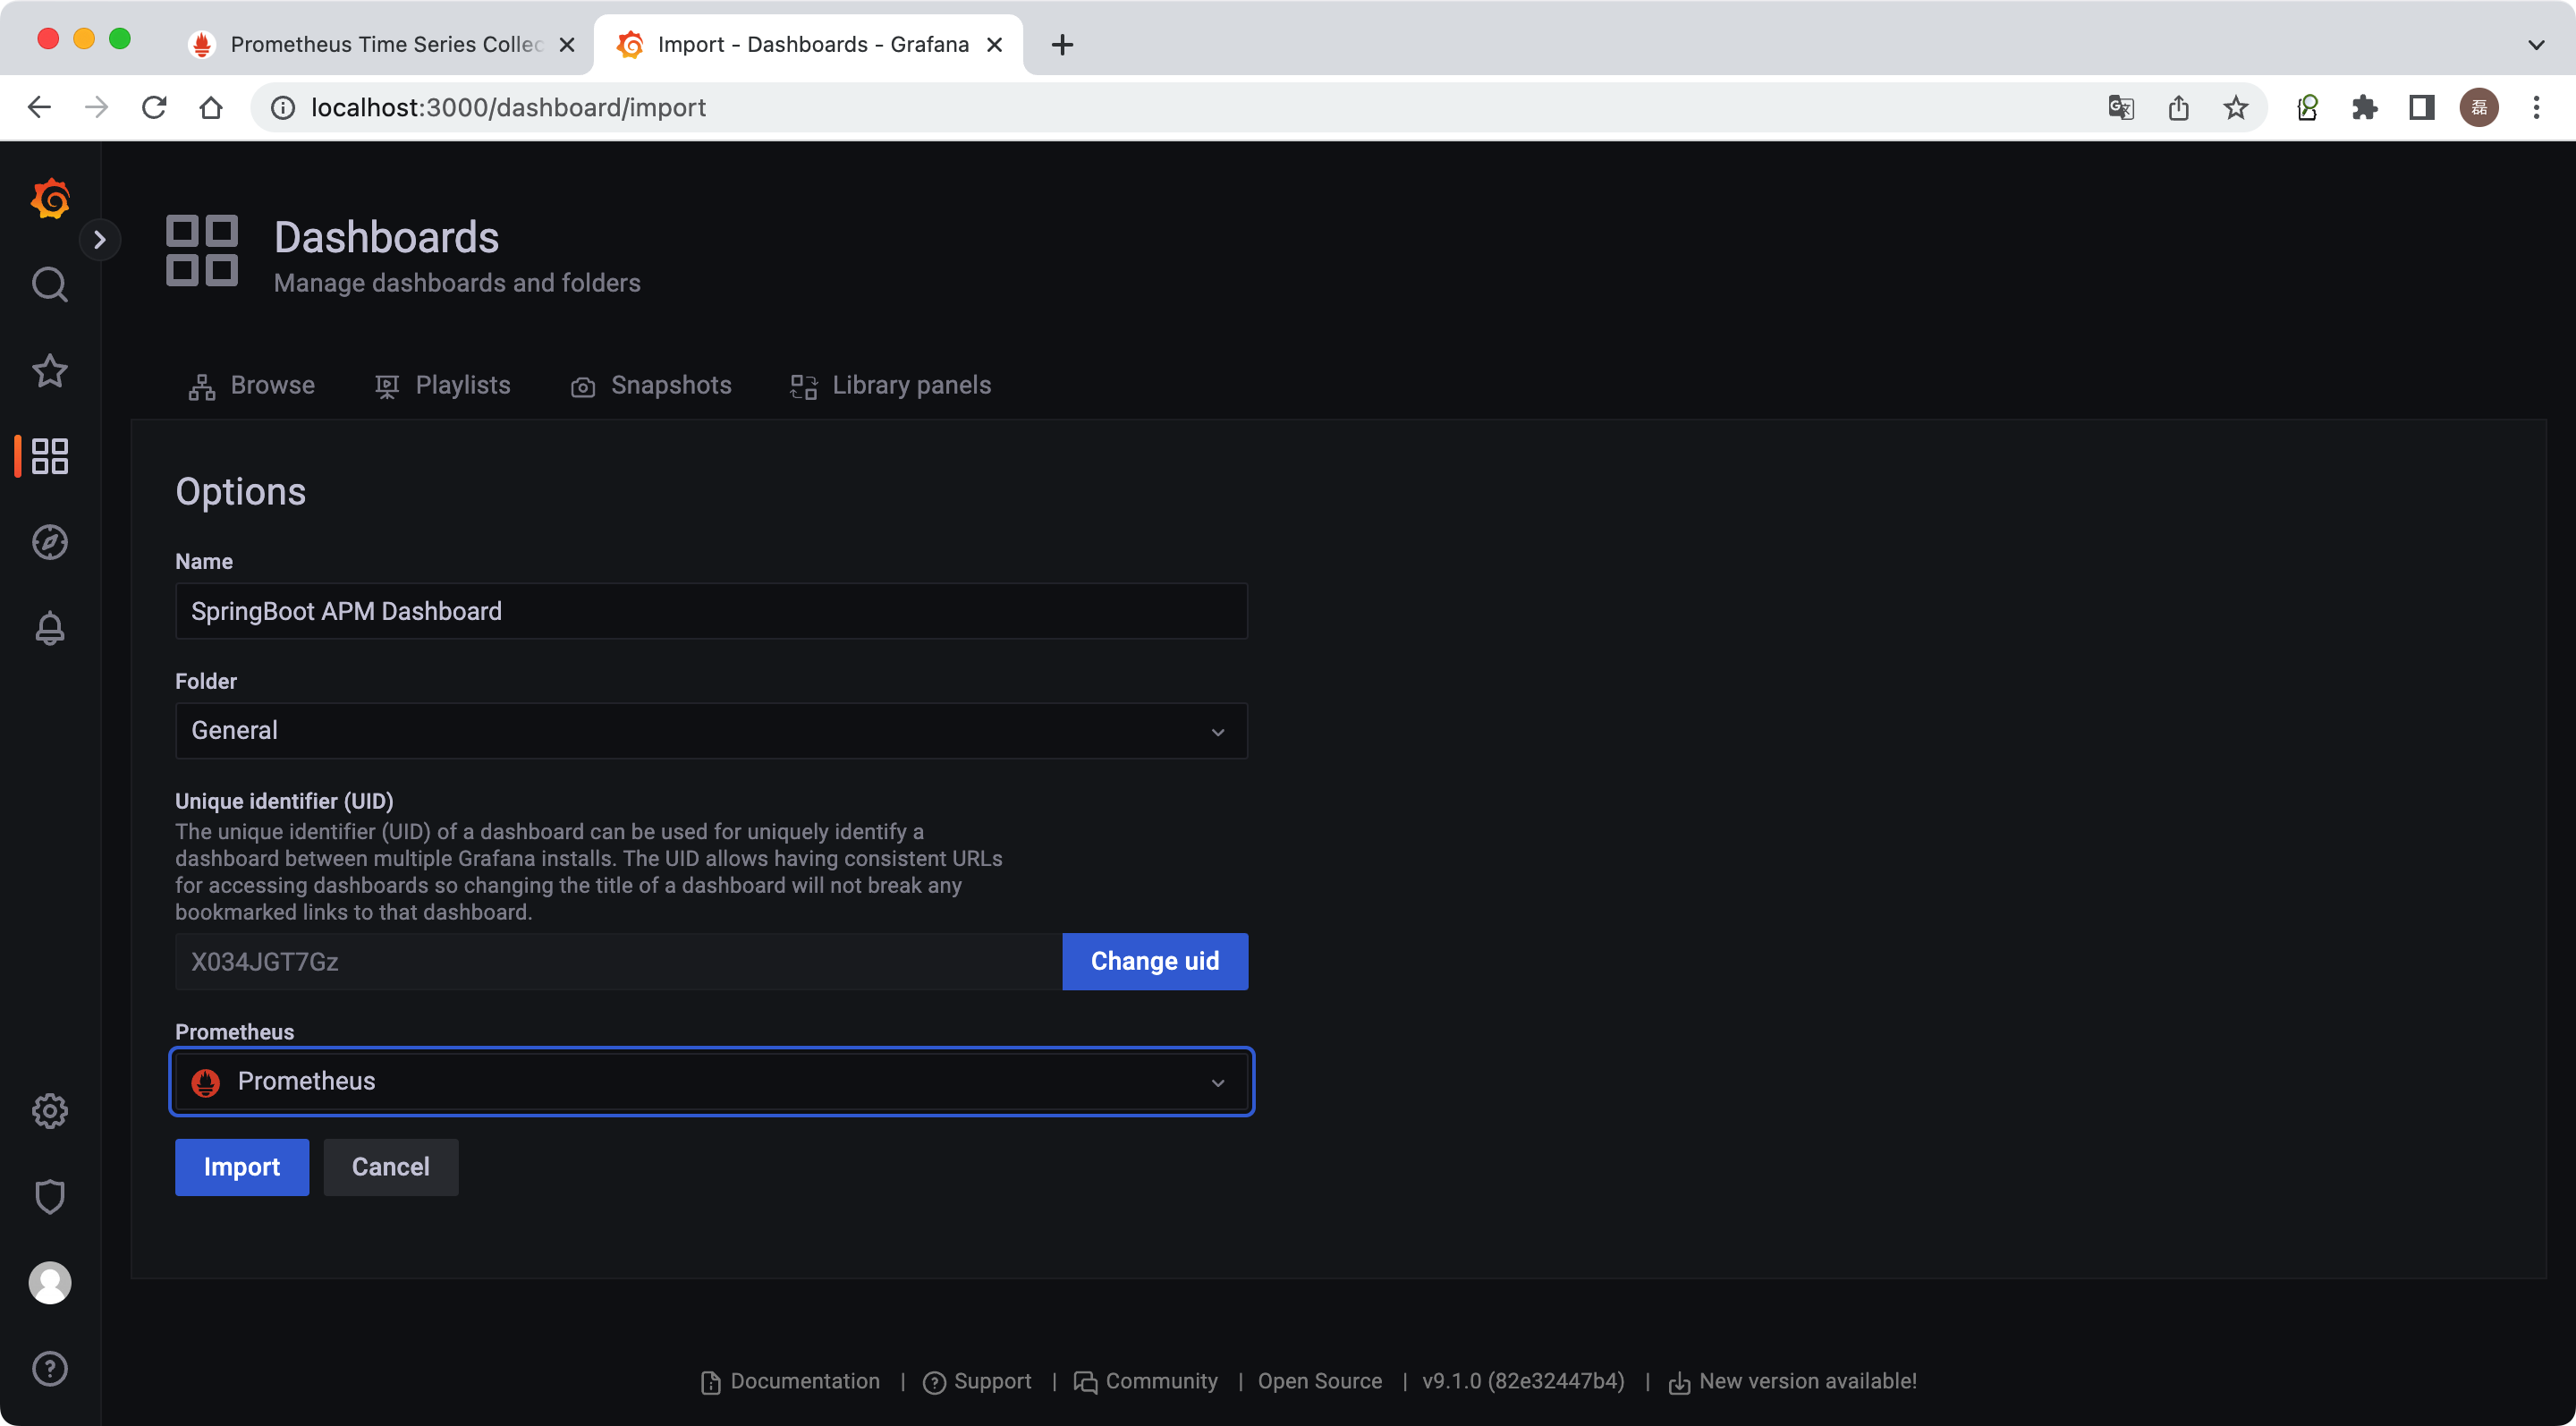
导入成功

以上。
- 应用程序 SpringBoot Prometheus Grafana 程序springboot prometheus actuator grafana springboot prometheus grafana系统 springboot prometheus grafana prometheus grafana prometheus模板grafana prometheus grafana docker alertmanager prometheus grafana prometheus windows grafana jmeter node-exporter prometheus exporter grafana node_exporter prometheus exporter grafana