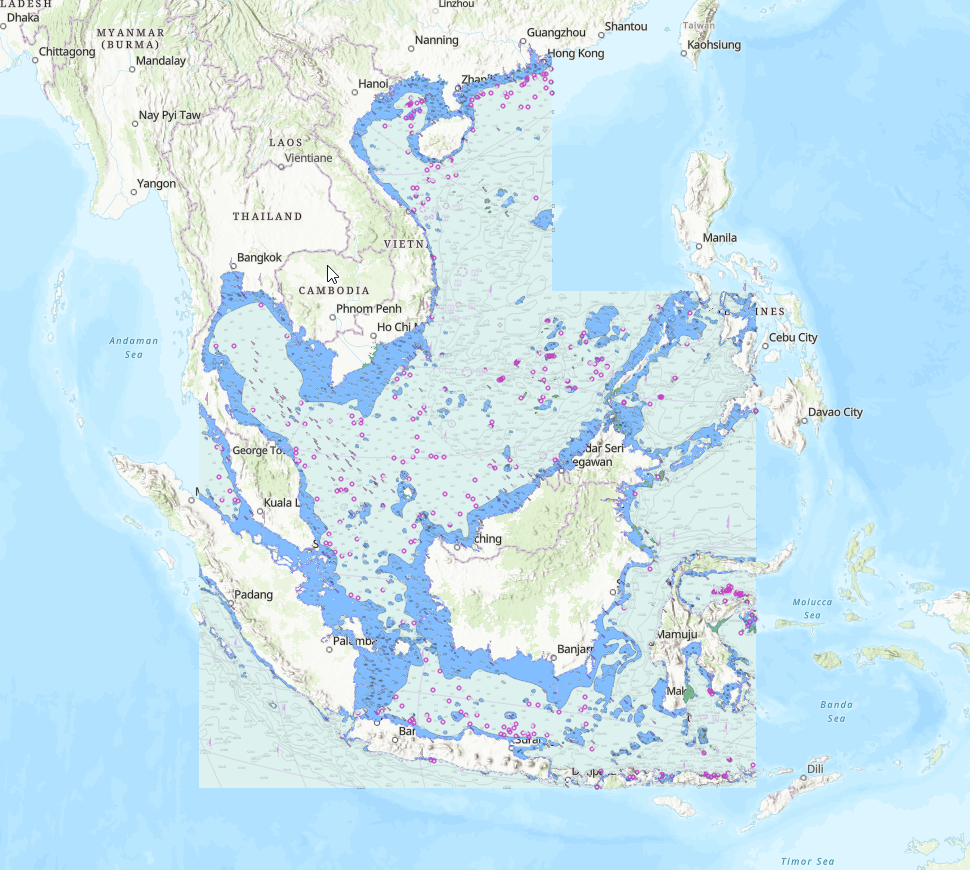
默认情况下,在海岸周边的海图数据,是具备陆地信息,因此在发布服务之后,是能够看到陆地要素的,如下
而在某些业务场景,我们需要的隐藏陆地要素,通常有两种做法
- 自己具备陆地要素的地图服务,那么将海图服务放在底层,陆地地图服务放在上层即可
- 如本身不具备完整的陆地地图服务,那么以上做法则无法满足要求,则需要对海图MCS服务进行控制,本文介绍这种处理方式
MCS服务端控制
海图数据本身是分物标对象存储,不以GIS常规的图层方式进行数据存储,在ArcGIS Maritime Server中进行数据的抽取以及图层重构,并以S52规范进行显示控制,图层配置信息写在S52DisplayProperties.xml文件,如下13个可控制图层,修改一下value值,可后台固定化配置,修改完成后,重启相应服务即可
<Parameter name="0" type="E" default="2" value="2"
           range="11000-11999,21010-21029,21031-21999,31000-31009,31012-31029,31032-31999">
    <Description>Information about the chart display</Description>
    <ExpectedInput code="1" value="False" />
    <ExpectedInput code="2" value="True" />
</Parameter>
<Parameter name="1" type="E" default="2" value="2"
           range="12000-12999,22000-22999,32000-32999">
    <Description>Natural and man-made features, port features</Description>
    <ExpectedInput code="1" value="False" />
    <ExpectedInput code="2" value="True" />
</Parameter>
<Parameter name="2" type="E" default="2" value="2"
           range="13000-13999,23000-23009,23011-23999,33000-33999">
    <Description>Depths, currents, etc</Description>
    <ExpectedInput code="1" value="False" />
    <ExpectedInput code="2" value="True" />
</Parameter>
<Parameter name="3" type="E" default="2" value="2"
           range="14000-14999,24000-24999,34000-34999">
    <Description>Seabed, obstructions, pipelines</Description>
    <ExpectedInput code="1" value="False" />
    <ExpectedInput code="2" value="True" />
</Parameter>
<Parameter name="4" type="E" default="2" value="2"
           range="15000-15999,25000-25999,35000-35999">
    <Description>Traffic routes</Description>
    <ExpectedInput code="1" value="False" />
    <ExpectedInput code="2" value="True" />
</Parameter>
<Parameter name="5" type="E" default="2" value="2"
           range="16000-16999,26000-26999,36000-36999">
    <Description>Special areas</Description>
    <ExpectedInput code="1" value="False" />
    <ExpectedInput code="2" value="True" />
</Parameter>
<Parameter name="6" type="E" default="2" value="2"
           range="17000-17999,27000-27999,37000-37999">
    <Description>Buoys, beacons, lights, fog signals, radar</Description>
    <ExpectedInput code="1" value="False" />
    <ExpectedInput code="2" value="True" />
</Parameter>
<Parameter name="7" type="E" default="2" value="2"
           range="18000-18999,28000-28999,38000-38999">
    <Description>Services and small craft facilities</Description>
    <ExpectedInput code="1" value="False" />
    <ExpectedInput code="2" value="True" />
</Parameter>
<Parameter name="8" type="E" default="2" value="1" range="31010">
    <Description>Data quality</Description>
    <ExpectedInput code="1" value="False" />
    <ExpectedInput code="2" value="True" />
</Parameter>
<Parameter name="9" type="E" default="2" value="1" range="31011">
    <Description>Low accuracy</Description>
    <ExpectedInput code="1" value="False" />
    <ExpectedInput code="2" value="True" />
</Parameter>
<Parameter name="10" type="E" default="2" value="1" range="31030,31031">
    <Description>Additional chart information</Description>
    <ExpectedInput code="1" value="False" />
    <ExpectedInput code="2" value="True" />
</Parameter>
<Parameter name="11" type="E" default="2" value="1" range="23010">
    <Description>Shallow water pattern</Description>
    <ExpectedInput code="1" value="False" />
    <ExpectedInput code="2" value="True" />
</Parameter>
<Parameter name="12" type="E" default="2" value="1" range="21030">
    <Description>Overscale warning</Description>
    <ExpectedInput code="1" value="False" />
    <ExpectedInput code="2" value="True" />
</Parameter>
图层对应关系表
| id | Description | 备注 | |
|---|---|---|---|
| 0 | Information about the chart display | 图表信息 | |
| 1 | Natural and man-made features, port features | 路地区和人造区、港口、陆地 | |
| 2 | Depths, currents, etc | 等深区、水流 | |
| 3 | Seabed, obstructions, pipelines | 海底、障碍物、管道 | |
| 4 | Traffic routes | 航路 | |
| 5 | Special areas | 特殊区域 | |
| 6 | Buoys, beacons, lights, fog signals, radar | 浮标、信标、灯光、雾灯、雷达 | |
| 7 | Services and small craft facilities | 服务设施、小船 | |
| 8 | Data quality | 数据质量 | |
| 9 | Low accuracy | 低精度模式 | |
| 10 | Additional chart information | 图表信息 | |
| 11 | Shallow water pattern | 浅水模式 | |
| 12 | Overscale warning | 超标警告 |
MCS浏览器端控制
观察海图MCS服务,其中请求返回的元数据信息如下,其中layers对象与S52DisplayProperties.xml文件中的图层对象信息一致,因此可以使用MapServer服务export接口的layers参数进行图层绘制的控制。
{
    "currentVersion": 10.9,
    "serviceDescription": "ArcGIS for Maritime Server's Maritime Chart Service capability is a Server Object Extension that provides both OGC WMS and Esri REST services to quickly view and query your S-57 or S-63 encrypted datasets.",
    "mapName": "Maritime Chart Service",
    "description": "",
    "copyrightText": "",
    "layers": [
        {
            "id": 0,
            "name": "Information about the chart display",
            "defaultVisibility": true,
            "parentLayerId": -1,
            "subLayerIds": null,
            "minScale": 0,
            "maxScale": 0
        },
        {
            "id": 1,
            "name": "Natural and man-made features, port features",
            "defaultVisibility": true,
            "parentLayerId": -1,
            "subLayerIds": null,
            "minScale": 0,
            "maxScale": 0
        },
        {
            "id": 2,
            "name": "Depths, currents, etc",
            "defaultVisibility": true,
            "parentLayerId": -1,
            "subLayerIds": null,
            "minScale": 0,
            "maxScale": 0
        },
        {
            "id": 3,
            "name": "Seabed, obstructions, pipelines",
            "defaultVisibility": true,
            "parentLayerId": -1,
            "subLayerIds": null,
            "minScale": 0,
            "maxScale": 0
        },
        {
            "id": 4,
            "name": "Traffic routes",
            "defaultVisibility": true,
            "parentLayerId": -1,
            "subLayerIds": null,
            "minScale": 0,
            "maxScale": 0
        },
        {
            "id": 5,
            "name": "Special areas",
            "defaultVisibility": true,
            "parentLayerId": -1,
            "subLayerIds": null,
            "minScale": 0,
            "maxScale": 0
        },
        {
            "id": 6,
            "name": "Buoys, beacons, lights, fog signals, radar",
            "defaultVisibility": true,
            "parentLayerId": -1,
            "subLayerIds": null,
            "minScale": 0,
            "maxScale": 0
        },
        {
            "id": 7,
            "name": "Services and small craft facilities",
            "defaultVisibility": true,
            "parentLayerId": -1,
            "subLayerIds": null,
            "minScale": 0,
            "maxScale": 0
        },
        {
            "id": 8,
            "name": "Data quality",
            "defaultVisibility": false,
            "parentLayerId": -1,
            "subLayerIds": null,
            "minScale": 0,
            "maxScale": 0
        },
        {
            "id": 9,
            "name": "Low accuracy",
            "defaultVisibility": false,
            "parentLayerId": -1,
            "subLayerIds": null,
            "minScale": 0,
            "maxScale": 0
        },
        {
            "id": 10,
            "name": "Additional chart information",
            "defaultVisibility": false,
            "parentLayerId": -1,
            "subLayerIds": null,
            "minScale": 0,
            "maxScale": 0
        },
        {
            "id": 11,
            "name": "Shallow water pattern",
            "defaultVisibility": false,
            "parentLayerId": -1,
            "subLayerIds": null,
            "minScale": 0,
            "maxScale": 0
        },
        {
            "id": 12,
            "name": "Overscale warning",
            "defaultVisibility": false,
            "parentLayerId": -1,
            "subLayerIds": null,
            "minScale": 0,
            "maxScale": 0
        }
    ],
    "tables": [

    ],
    "spatialReference": {
        "wkid": 102100
    },
    "singleFusedMapCache": false,
    "initialExtent": {
        "xmin": 11020629.5885340851,
        "ymin": -1006021.06275513361,
        "xmax": 13747957.1129692867,
        "ymax": 2937284.43742384249,
        "spatialReference": {
            "wkid": 102100
        }
    },
    "fullExtent": {
        "xmin": -19926188.8519959711,
        "ymin": -30240971.9583862536,
        "xmax": 19926188.8519959711,
        "ymax": 30240971.9583862051,
        "spatialReference": {
            "wkid": 102100
        }
    },
    "units": "esriMeters",
    "supportedImageFormatTypes": "PNG, PDF",
    "capabilities": "Map,Query",
    "documentInfo": {
        "title": "Maritime Chart Service",
        "author": "ArcGIS for Maritime Server",
        "comments": "Not to be used for navigation.",
        "subject": "S-57 Web Services",
        "category": "S-57",
        "keywords": "S-57"
    }
}
export接口layers参数
Determines which layers appear on the exported map. There are four ways to specify which layers are shown:
- show—Only the layers specified in this list will be exported.
- hide—All layers except those specified in this list will be exported.
- include—In addition to the layers exported by default, the layers specified in this list will be exported.
- exclude—The layers exported by default excluding those specified in this list will be exported.
Syntax
//Where layerId1 and layerId2 are the layer ids returned by the  map service resource
[show | hide | include | exclude]:layerId1,layerId2
Example
layers=show:2,4,7
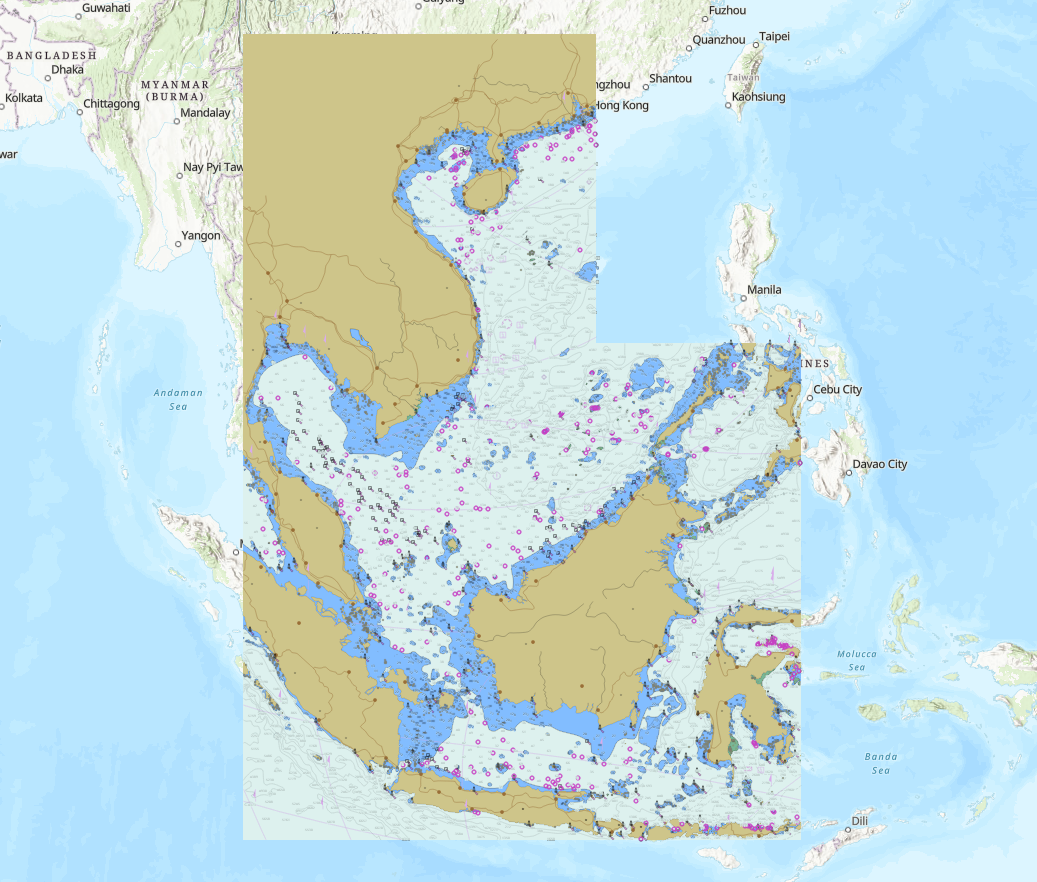
前端请求方式
通过defaultVisibility可以观察到,在默认请求下,id为8、9、10、11、12图层为关闭绘制状态,一般情况下不需要显示。
综合以上信息,只需额外关闭id为1的图层即可,但需注意,默认关闭的图层,如无特殊需要,也请关闭
let layer = new MapImageLayer({
    url: url,
    customParameters: {
        "layers": "show:0,2,3,4,5,6,7",
    }
});
完整demo如下
<html>

<head>
    <meta charset="utf-8" />
    <meta name="viewport" content="initial-scale=1,maximum-scale=1,user-scalable=no" />
    <title>
        Intro to ENC Layer
    </title>
    <style>
        html,
        body,
        #viewDiv {
            margin: 0;
            padding: 0;
            width: 100%;
            height: 100%;
        }
    </style>

    <link rel="stylesheet" href="https://js.arcgis.com/4.27/esri/themes/light/main.css" />
    <script src="https://js.arcgis.com/4.27/"></script>

    <script>
        require(["esri/Map", "esri/views/MapView", "esri/layers/MapImageLayer"], (Map, MapView, MapImageLayer) => {

            const map = new Map({
                basemap: "topo-vector"
            });


            let layer = new MapImageLayer({
                url: "https://192.168.1.34:6443/arcgis/rest/services/SampleWorldCities/MapServer/exts/MaritimeChartService/MapServer",
                customParameters: {
                    "layers": "show:0,2,3,4,5,6,7"
                }
            });

            map.add(layer);
            const view = new MapView({
                container: "viewDiv",
                map: map,
                zoom: 4,
                center:[113,23]
            });

        });
    </script>
</head>

<body>
    <div id="viewDiv"></div>
</body>

</html>
效果如下