Kafka学习之四_Grafana监控相关的学习
背景
想一并学习一下kafaka的监控.
又重新开始学习grafana了:
下载地址:
https://grafana.com/grafana/download
https://prometheus.io/download/
https://github.com/danielqsj/kafka_exporter

利用这三个网站下载较新的资源,然后进行测试与安装使用.

之前写过很多rpm还有docker的方式方法,想着这次使用一下二进制方式安装.
在某些机器上面可能更加方便一点

这次主要是想在 鲲鹏上面验证, 所以下载的文件如下:

alertmanager-0.25.0.linux-arm64.tar.gz
grafana-enterprise-10.0.1.linux-arm64.tar.gz
kafka_exporter-1.7.0.linux-arm64.tar.gz
prometheus-2.44.0.linux-arm64.tar.gz
安装-grafana
解压缩 grafana的压缩包
然后查看部分命令的帮助信息

./grafana server -h
NAME:
   grafana server - run the grafana server

USAGE:
   grafana server [command options] [arguments...]

OPTIONS:
   --config value           Path to config file
   --homepath value         Path to Grafana install/home path, defaults to working directory
   --pidfile value          Path to Grafana pid file
   --packaging value        describes the way Grafana was installed (default: "unknown")
   --configOverrides value  Configuration options to override defaults as a string. e.g. cfg:default.paths.log=/dev/null
   --version, -v            print the version
   --vv                     prints current version, all dependencies and exits (default: false)
   --profile                Turn on pprof profiling (default: false)
   --profile-addr value     Define custom address for profiling (default: "localhost")
   --profile-port value     Define custom port for profiling (default: 6060)
   --tracing                Turn on tracing (default: false)
   --tracing-file value     Define tracing output file (default: "trace.out")
   --help, -h               show help

最简单的启动脚本为
cd /grafana-xx-xx/bin
nohup ./grafana server --config ../conf/defaults.ini 2>&1 >/devnull &

注意可以修改 ../conf/defaults.ini 内的文件制定很多配置.

默认密码是 admin/admin 第一次登录需要修改密码
安装kafka-exporter
启动脚本为:
nohup ./kafka_exporter --sasl.enabled --web.listen-address=":9308" --sasl.username="admin" --sasl.password="Test20131127" --sasl.mechanism="plain" --kafka.server=127.0.0.1:9093 2>&1 >/devnull &
解压缩先查看帮助然后根据帮助进行处理

Flags:
  -h, --[no-]help                Show context-sensitive help (also try --help-long and --help-man).
      --web.listen-address=":9308"
                                 Address to listen on for web interface and telemetry.
      --web.telemetry-path="/metrics"
                                 Path under which to expose metrics.
      --topic.filter=".*"        Regex that determines which topics to collect.
      --topic.exclude="^$"       Regex that determines which topics to exclude.
      --group.filter=".*"        Regex that determines which consumer groups to collect.
      --group.exclude="^$"       Regex that determines which consumer groups to exclude.
      --[no-]log.enable-sarama   Turn on Sarama logging, default is false.
      --kafka.server=kafka:9092 ...
                                 Address (host:port) of Kafka server.
      --[no-]sasl.enabled        Connect using SASL/PLAIN, default is false.
      --[no-]sasl.handshake      Only set this to false if using a non-Kafka SASL proxy, default is true.
      --sasl.username=""         SASL user name.
      --sasl.password=""         SASL user password.
      --sasl.mechanism=""        The SASL SCRAM SHA algorithm sha256 or sha512 or gssapi as mechanism
      --sasl.service-name=""     Service name when using kerberos Auth
      --sasl.kerberos-config-path=""
                                 Kerberos config path
      --sasl.realm=""            Kerberos realm
      --sasl.kerberos-auth-type=""
                                 Kerberos auth type. Either 'keytabAuth' or 'userAuth'
      --sasl.keytab-path=""      Kerberos keytab file path
      --[no-]sasl.disable-PA-FX-FAST
                                 Configure the Kerberos client to not use PA_FX_FAST, default is false.
      --[no-]tls.enabled         Connect to Kafka using TLS, default is false.
      --tls.server-name=""       Used to verify the hostname on the returned certificates unless tls.insecure-skip-tls-verify is given. The kafka server's name
                                 should be given.
      --tls.ca-file=""           The optional certificate authority file for Kafka TLS client authentication.
      --tls.cert-file=""         The optional certificate file for Kafka client authentication.
      --tls.key-file=""          The optional key file for Kafka client authentication.
      --[no-]server.tls.enabled  Enable TLS for web server, default is false.
      --[no-]server.tls.mutual-auth-enabled
                                 Enable TLS client mutual authentication, default is false.
      --server.tls.ca-file=""    The certificate authority file for the web server.
      --server.tls.cert-file=""  The certificate file for the web server.
      --server.tls.key-file=""   The key file for the web server.
      --[no-]tls.insecure-skip-tls-verify
                                 If true, the server's certificate will not be checked for validity. This will make your HTTPS connections insecure. Default is
                                 false
      --kafka.version="2.0.0"    Kafka broker version
      --[no-]use.consumelag.zookeeper
                                 if you need to use a group from zookeeper, default is false
      --zookeeper.server=localhost:2181 ...
                                 Address (hosts) of zookeeper server.
      --kafka.labels=""          Kafka cluster name
      --refresh.metadata="30s"   Metadata refresh interval
      --[no-]offset.show-all     Whether show the offset/lag for all consumer group, otherwise, only show connected consumer groups, default is true
      --[no-]concurrent.enable   If true, all scrapes will trigger kafka operations otherwise, they will share results. WARN: This should be disabled on large
                                 clusters. Default is false
      --topic.workers=100        Number of topic workers
      --[no-]kafka.allow-auto-topic-creation
                                 If true, the broker may auto-create topics that we requested which do not already exist, default is false.
      --verbosity=0              Verbosity log level
      --log.level=info           Only log messages with the given severity or above. One of: [debug, info, warn, error]
      --log.format=logfmt        Output format of log messages. One of: [logfmt, json]
      --[no-]version             Show application version.
安装以及监控kafaka-prometheus
1. prometheus的日志留存时间和大小限制
 --storage.tsdb.retention.time=15d
其实默认值就是 15天, 可以根据情况适当进行调整.

2. 存放目录
--storage.tsdb.path="/prometheusdata/"

3.大小
--storage.tsdb.retention.size=15GB

4. 修改端口
--web.listen-address="0.0.0.0:9095"

5. 设置监控kafka

    scrape_configs:
      # 监控业务kafka
      - job_name: 'kafka'
        static_configs:
        - targets:
          - 127.0.0.1:9308

整体命令为:
nohup ./prometheus --storage.tsdb.retention.time=15d  --storage.tsdb.path="/prometheusdata/"  --storage.tsdb.retention.size=15GB --web.listen-address="0.0.0.0:9095" 2>&1 >/dev/null &
增加数据源
增加prometheus的数据源
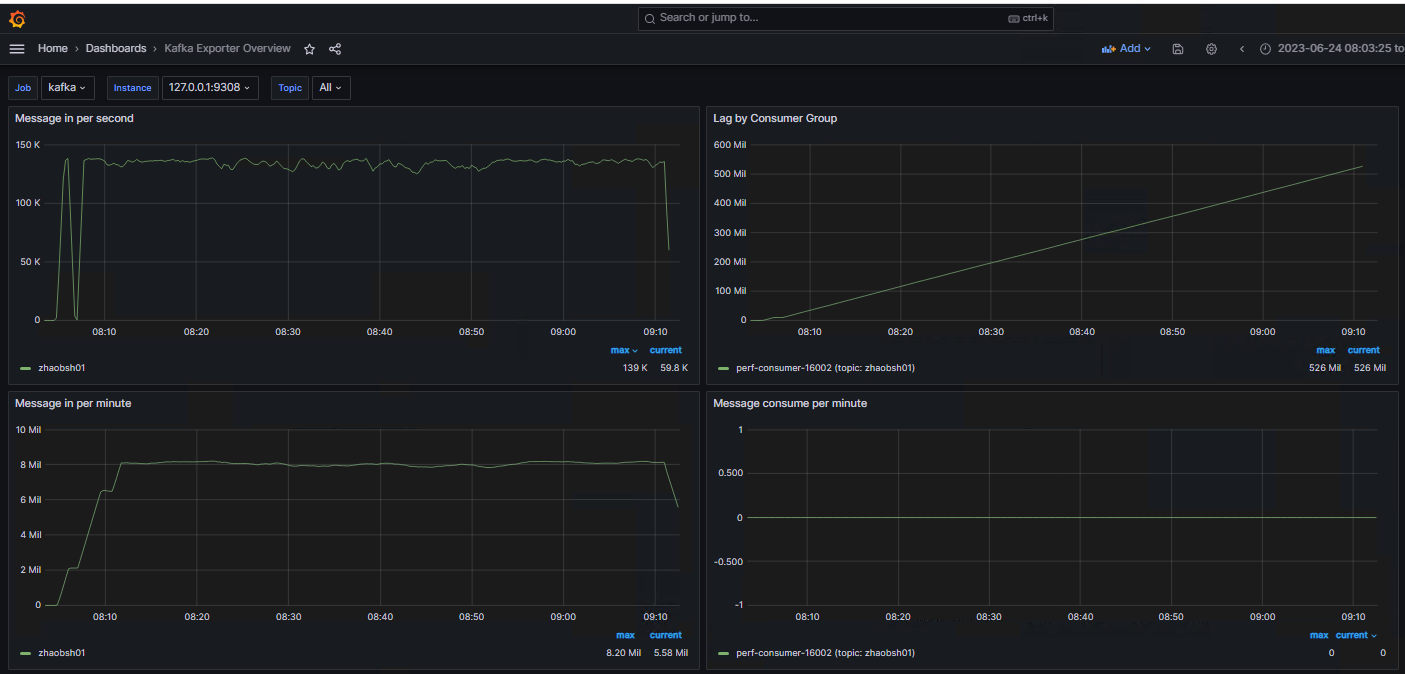
然后grafana导入: 7589 监控就可以了.
结果展示