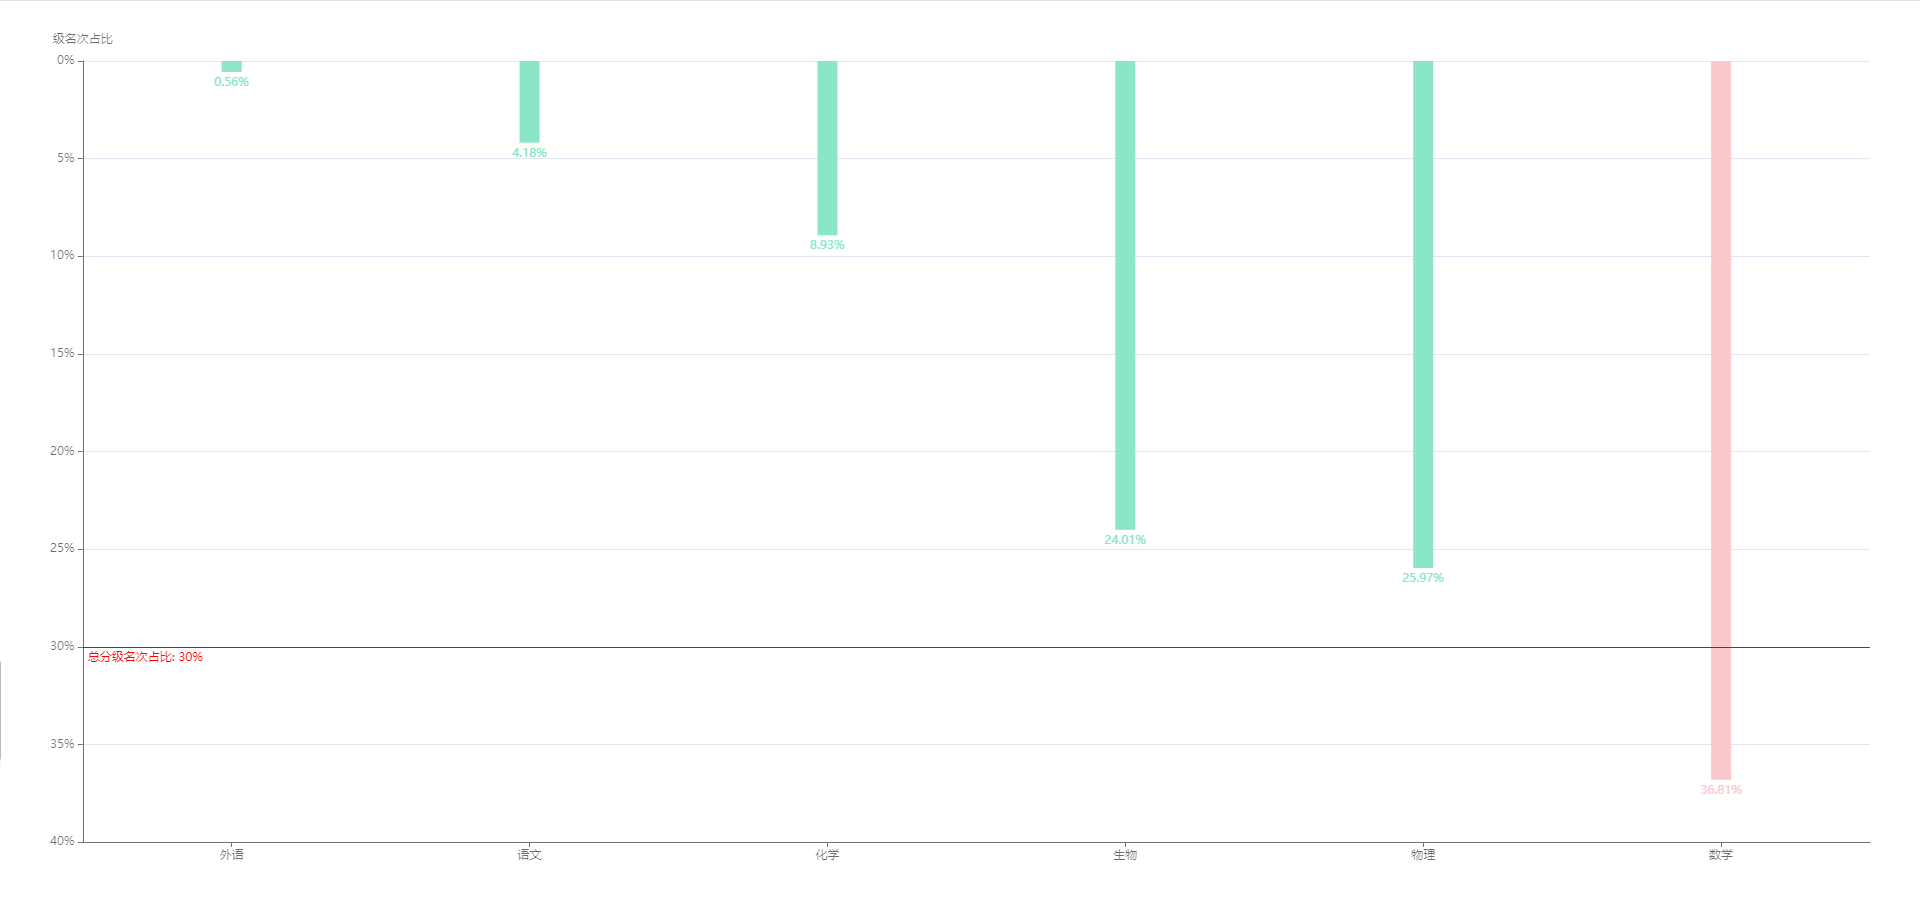
option = {
  color: '#8AE6C7',
  grid: {
    left: '50',
    right: '50',
    bottom: '50',
    containLabel: true
  },
  textStyle: {
    color: 'rgba(0,0,0,.58)'
  },
  xAxis: {
    type: 'category',
    data: ['外语', '语文', '化学', '生物', '物理', '数学'],
    axisLine: {
      onZero: false
    },
    axisTick: {
      show: true,
      alignWithLabel: true
    }
  },
  yAxis: {
    show: true,
    type: 'value',
    inverse: true,
    // interval: 10,
    splitNumber:6,
    name: '级名次占比',
    nameLocation: 'start',
    axisLine: {
      show: true
    },
    axisTick: {
      show: true,
      alignWithLabel: true
    },
    axisLabel: {
      show: true,
      formatter: (value) => {
        return value + '%';
      }
    }
  },
  series: [
    {
      type: 'bar',
      data: [0.56, 4.18, 8.93, 24.01, 25.97, 36.81],
      barWidth: 20,
      itemStyle: {
        color: (params) => {
          return params.value > 30 ? '#FAC8CC' : '#8AE6C7';
        }
      },
      label: {
        show: true,
        position: 'bottom',
        formatter: '{c}%',
        color: 'inherit'
      },
      markLine: {
        symbol: 'none',
        data: [
          {
            yAxis: 30, // 自定义下限值
            name: '总分级名次占比', // 基准线名称
            label: {
              // 不显示基准线名称
              show: true,
              color: 'red',
              position: 'insideStartBottom',
              formatter: '{b}: {c}%'
            },
            lineStyle: {
              type: 'solid', // 基准线样式为虚线
              color: '#E60012'
            }
          }
        ]
      }
    }
  ]
};