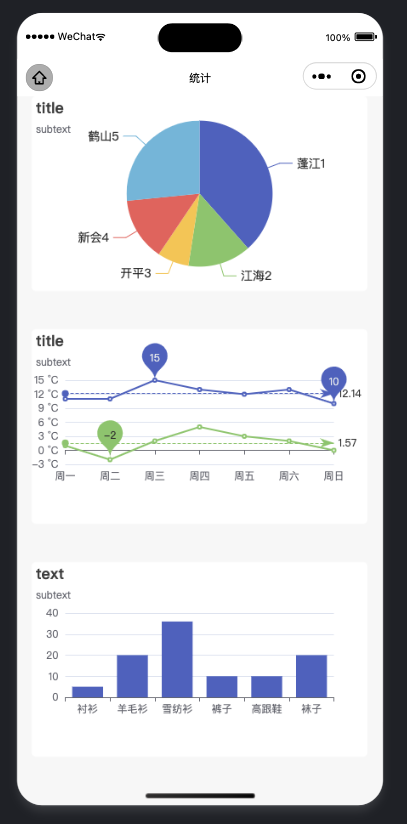
小程序使用ec-canvas实现循环动态渲染echarts表格

发布时间 2023-12-09 10:05:17作者: Mr.韦淋

小程序使用ec-canvas实现循环动态渲染echarts表格,从后题获取表格参数,小程序端动态渲染. 

需要下载ec-canvas组件,并添加引用

wxml

<view class="container" wx:for="{{ec}}" wx:key="index">
  <ec-canvas id="id_{{index}}" canvas-id="canvas_id_{{index}}" ec="{{ item }}" force-use-old-canvas="true"></ec-canvas>
</view>


js

import * as echarts from './ec-canvas/echarts'
Page({
    data: {
        key: 0,
        opt: [{
            title: {
                text: 'title',
                subtext: 'subtext'
            },
            tooltip: {},
            series: [{
                label: {
                    normal: {
                        fontSize: 14
                    }
                },
                type: 'pie',
                center: ['50%', '50%'],
                data: [{
                    value: 55,
                    name: '蓬江1'
                }, {
                    value: 20,
                    name: '江海2'
                }, {
                    value: 10,
                    name: '开平3'
                }, {
                    value: 20,
                    name: '新会4'
                }, {
                    value: 38,
                    name: '鹤山5'
                }]
            }]
        }, {
            title: {
                text: 'title',
                subtext: 'subtext'
            },
            tooltip: {},
            xAxis: [{
                type: 'category',
                boundaryGap: false,
                data: ['周一', '周二', '周三', '周四', '周五', '周六', '周日']
            }],
            yAxis: [{
                type: 'value',
                axisLabel: {
                    formatter: '{value} °C'
                }
            }],
            series: [{
                    name: '最高气温',
                    type: 'line',
                    data: [11, 11, 15, 13, 12, 13, 10],
                    markPoint: {
                        data: [{
                                type: 'max',
                                name: '最大值'
                            },
                            {
                                type: 'min',
                                name: '最小值'
                            }
                        ]
                    },
                    markLine: {
                        data: [{
                            type: 'average',
                            name: '平均值'
                        }]
                    }
                },
                {
                    name: '最低气温',
                    type: 'line',
                    data: [1, -2, 2, 5, 3, 2, 0],
                    markPoint: {
                        data: [{
                            name: '周最低',
                            value: -2,
                            xAxis: 1,
                            yAxis: -1.5
                        }]
                    },
                    markLine: {
                        data: [{
                            type: 'average',
                            name: '平均值'
                        }]
                    }
                }
            ]
        }, {
            title: {
                text: 'text',
                subtext: 'subtext'
            },
            tooltip: {},
            xAxis: {
                data: ['衬衫', '羊毛衫', '雪纺衫', '裤子', '高跟鞋', '袜子']
            },
            yAxis: {},
            series: [{
                name: '销量',
                type: 'bar',
                data: [5, 20, 36, 10, 10, 20]
            }]
        }]
    },
    onLoad: function () {
        let that = this;
        that.init();
    },
    init(){
        let that = this;
        let ec = new Object();
        that.data.opt.forEach((v, k) => {
            const key = k;
            console.log("forEach", k)
            that.setData({
                key: key
            });
            let temp = new Object();
            temp.onInit = function(canvas, width, height, dpr){
                const chart = echarts.init(canvas, null, {
                  width: width,
                  height: height,
                  devicePixelRatio: dpr // new
                });
                canvas.setChart(chart);
                chart.setOption(that.data.opt[key]);
                return chart;
              };
            ec[key] = temp;
            that.setData({
                ec: ec
            })

        });
    }
    
});

wxss

.container{
    width: 690rpx;
    margin-left: 30rpx;
    height: 600rpx;
    border-radius: 10rpx;
    background-color: #ffffff;
    margin-bottom: 80rpx;
}


效果预览