1.开启php的监控数据监控功能
# 使用部署了php-fpm的机器即可
# yum install php-fpm -y

# 1.修改参数
[root@web-7 /etc/php-fpm.d]#grep '^pm.status' /etc/php-fpm.d/www.conf
pm.status_path = /php_status


2. 设置nginx转发
[root@web-7 /etc/nginx/conf.d]#cat status.conf
server{

listen 80;
server_name localhost;
location /nginx_status {
stub_status on;
access_log off;
}


location /php_status {
    fastcgi_pass 127.0.0.1:9000;
    fastcgi_index index.php;
    fastcgi_param SCRIPT_FILENAME html$fastcgi_script_name;
    include fastcgi_params;

}


}
[root@web-7 /etc/nginx/conf.d]#


3.重启nginx,php-fpm
[root@web-7 /etc/nginx/conf.d]#systemctl restart nginx php-fpm


[root@web-7 /etc/nginx/conf.d]#netstat -tunlp|grep -E 'php|nginx'
tcp        0      0 127.0.0.1:9000          0.0.0.0:*               LISTEN      51059/php-fpm: mast
tcp        0      0 0.0.0.0:80              0.0.0.0:*               LISTEN      51076/nginx: master
tcp6       0      0 :::80                   :::*                    LISTEN      51076/nginx: master
[root@web-7 /etc/nginx/conf.d]#
2.访问测试php_status
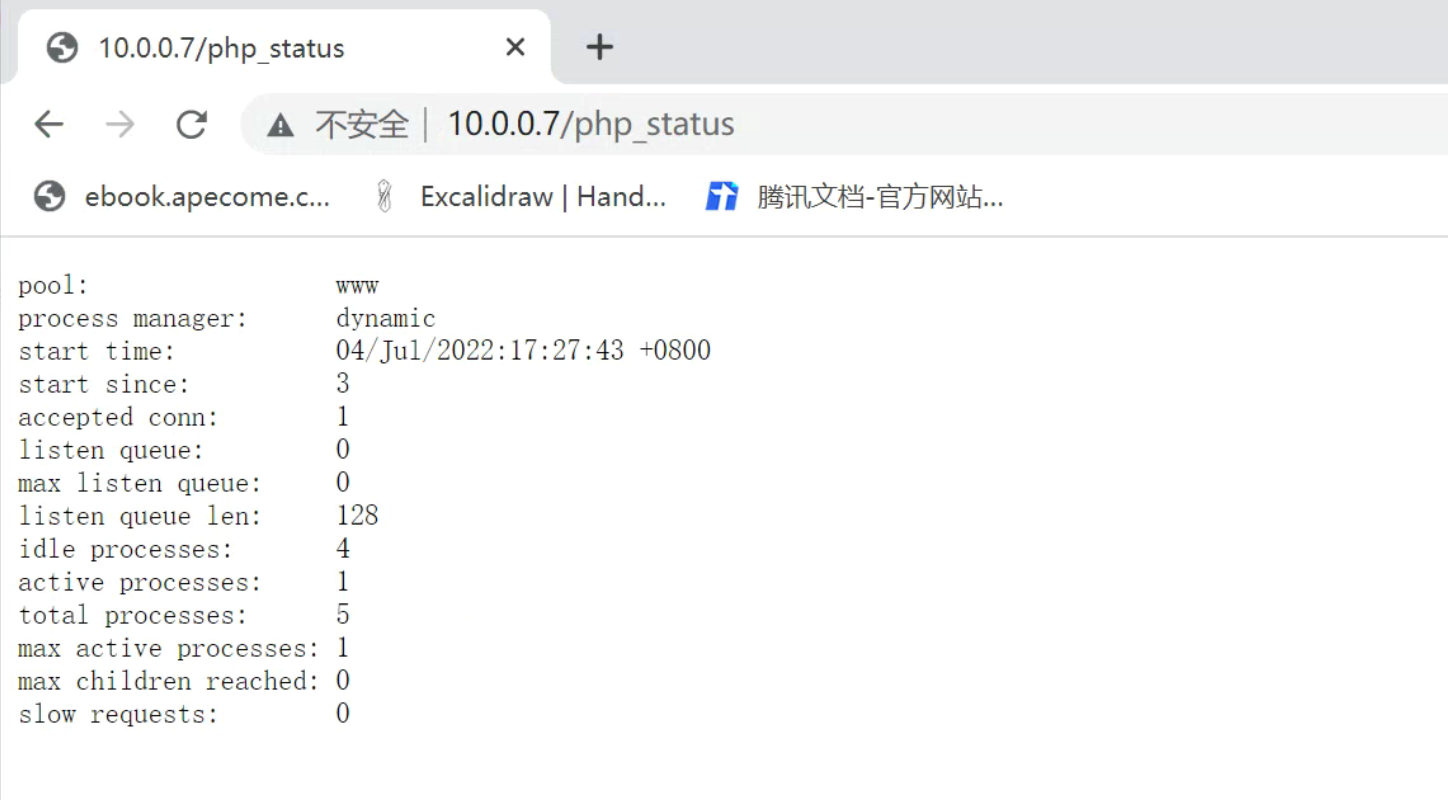
字段解释
[root@web-7 /etc/nginx/conf.d]#curl 127.0.0.1/php_status
pool:                 www
process manager:      dynamic
start time:           04/Jul/2022:17:27:43 +0800
start since:          158
accepted conn:        2
listen queue:         0
max listen queue:     0
listen queue len:     128
idle processes:       4
active processes:     1
total processes:      5
max active processes: 1
max children reached: 0
slow requests:        0
[root@web-7 /etc/nginx/conf.d]#


pool – fpm池子名称,大多数为www
process manager – 进程管理方式,值:static, dynamic or ondemand. dynamic
start time – 启动日期,如果reload了php-fpm,时间会更新
start since – 运行时长
accepted conn – 当前池子接受的请求数
listen queue – 请求等待队列,如果这个值不为0,那么要增加FPM的进程数量
max listen queue – 请求等待队列最高的数量
listen queue len – socket等待队列长度
idle processes – 空闲进程数量
active processes – 活跃进程数量
total processes – 总进程数量
max active processes – 最大的活跃进程数量(FPM启动开始算)
max children reached - 大道进程最大数量限制的次数,如果这个数量不为0,那说明你的最大进程数量太小了,请改大一点。
slow requests – 启用了php-fpm slow-log,缓慢请求的数量
3.脚本提取监控页面数据
#!/bin/bash
# 这是一个简单的监控php-fpm状态值的脚本

comm_para=$1
PHP_URL=$2
cmd="/usr/bin/curl $url"
cachefile=/tmp/php_status.txt
port=80

file_time=`stat -c %Y $cachefile`
now_time=`date +%s`
rm_file=$(($now_time-$file_time))
if [ -z $2 ];then
    url=http://127.0.0.1:$port/php_status
else
    url=$PHP_URL
fi
cmd="/usr/bin/curl $url"

if [ ! -e $cachefile ];then
    $cmd > $cachefile 2>/dev/null
fi

if [ $rm_file -gt 60 ];then
    rm -rf $cachefile
fi

if [ ! -f $cachefile ];then
    $cmd > $cachefile 2>/dev/null
fi

start_since() {
    #运行时长
    cat $cachefile | awk '/since/{print $3}'
    exit 0;
}

accepted_conn() {
    cat $cachefile | awk '/accepted/{print $3}'
    exit 0;
}

listen_queue(){
        cat $cachefile | awk '{if(NR==6){print $3}}'
    exit 0;
}

max_listen_queue(){
    cat $cachefile | awk '{if(NR==7){print $4}}'
    exit 0;
}

listen_queue_len() {
    cat $cachefile | awk '{if(NR==8){print $4}}'
    exit 0;
}

idle_processes() {
    cat $cachefile | awk '/idle/{print $3}'
    exit 0;
}

active_processes() {
    cat $cachefile | awk '{if(NR==10){print $3}}'
    exit 0;
}

total_processes() {
    cat $cachefile | awk '{if(NR==11){print $3}}'
        exit 0;
}

max_active_processes() {
    cat $cachefile | awk '{if(NR==12){print $4}}'
        exit 0;
}

max_children_reached() {
    cat $cachefile | awk '{if(NR==13){print $4}}'
        exit 0;
}

slow_requests() {
    cat $cachefile | awk '{if(NR==14){print $3}}'
        exit 0;
}

check() {
        php_pro_count=`ss -tunlp|grep php-fpm|wc -l`
        echo $php_pro_count
}

case "$comm_para" in
start_since)
    start_since
    ;;
accepted_conn)
    accepted_conn
    ;;
listen_queue)
    listen_queue
    ;;
max_listen_queue)
    max_listen_queue
    ;;
listen_queue_len)
    listen_queue_len
    ;;
idle_processes)
    idle_processes
    ;;
active_processes)
    active_processes
    ;;
total_processes)
    total_processes
    ;;
max_active_processes)
    max_active_processes
    ;;
max_children_reached)
    max_children_reached
    ;;
slow_requests)
    slow_requests
    ;;
check)
    check
    ;;
*)
    echo "invalid status"
    exit 2;
esac

# author: www.yuchaoit.cn
放入zabbix-agent目录
[root@web-7 /etc/zabbix/zabbix_agentd.d]#chmod +x php_status.sh
[root@web-7 /etc/zabbix/zabbix_agentd.d]#chown -R zabbix.zabbix ./*
[root@web-7 /etc/zabbix/zabbix_agentd.d]#ll
total 20
-rw-r--r-- 1 zabbix zabbix   87 Jul  4 13:44 nginx_status.conf
-rwxr-xr-x 1 zabbix zabbix 1706 Jul  4 13:51 nginx_status.sh
-rwxr-xr-x 1 zabbix zabbix 1095 Jul  4 17:33 php_status.sh
-rw-r--r-- 1 zabbix zabbix   52 Jun 29 19:06 tcp_status.conf
-rw-r--r-- 1 zabbix zabbix 1531 Jul 29  2019 userparameter_mysql.conf
4.准备zabbix_agent自定义key配置文件
[root@web-7 /etc/zabbix/zabbix_agentd.d]#cat php_status.conf
UserParameter=php_status[*],/etc/zabbix/zabbix_agentd.d/php_status.sh  $1


[root@web-7 /etc/zabbix/zabbix_agentd.d]#systemctl restart zabbix-agent.service
5.zabbix_get验证
[root@m-61 ~]#zabbix_get -s 10.0.0.7 -k php_status[listen_queue_len]
128
[root@m-61 ~]#zabbix_get -s 10.0.0.7 -k php_status[start_since]
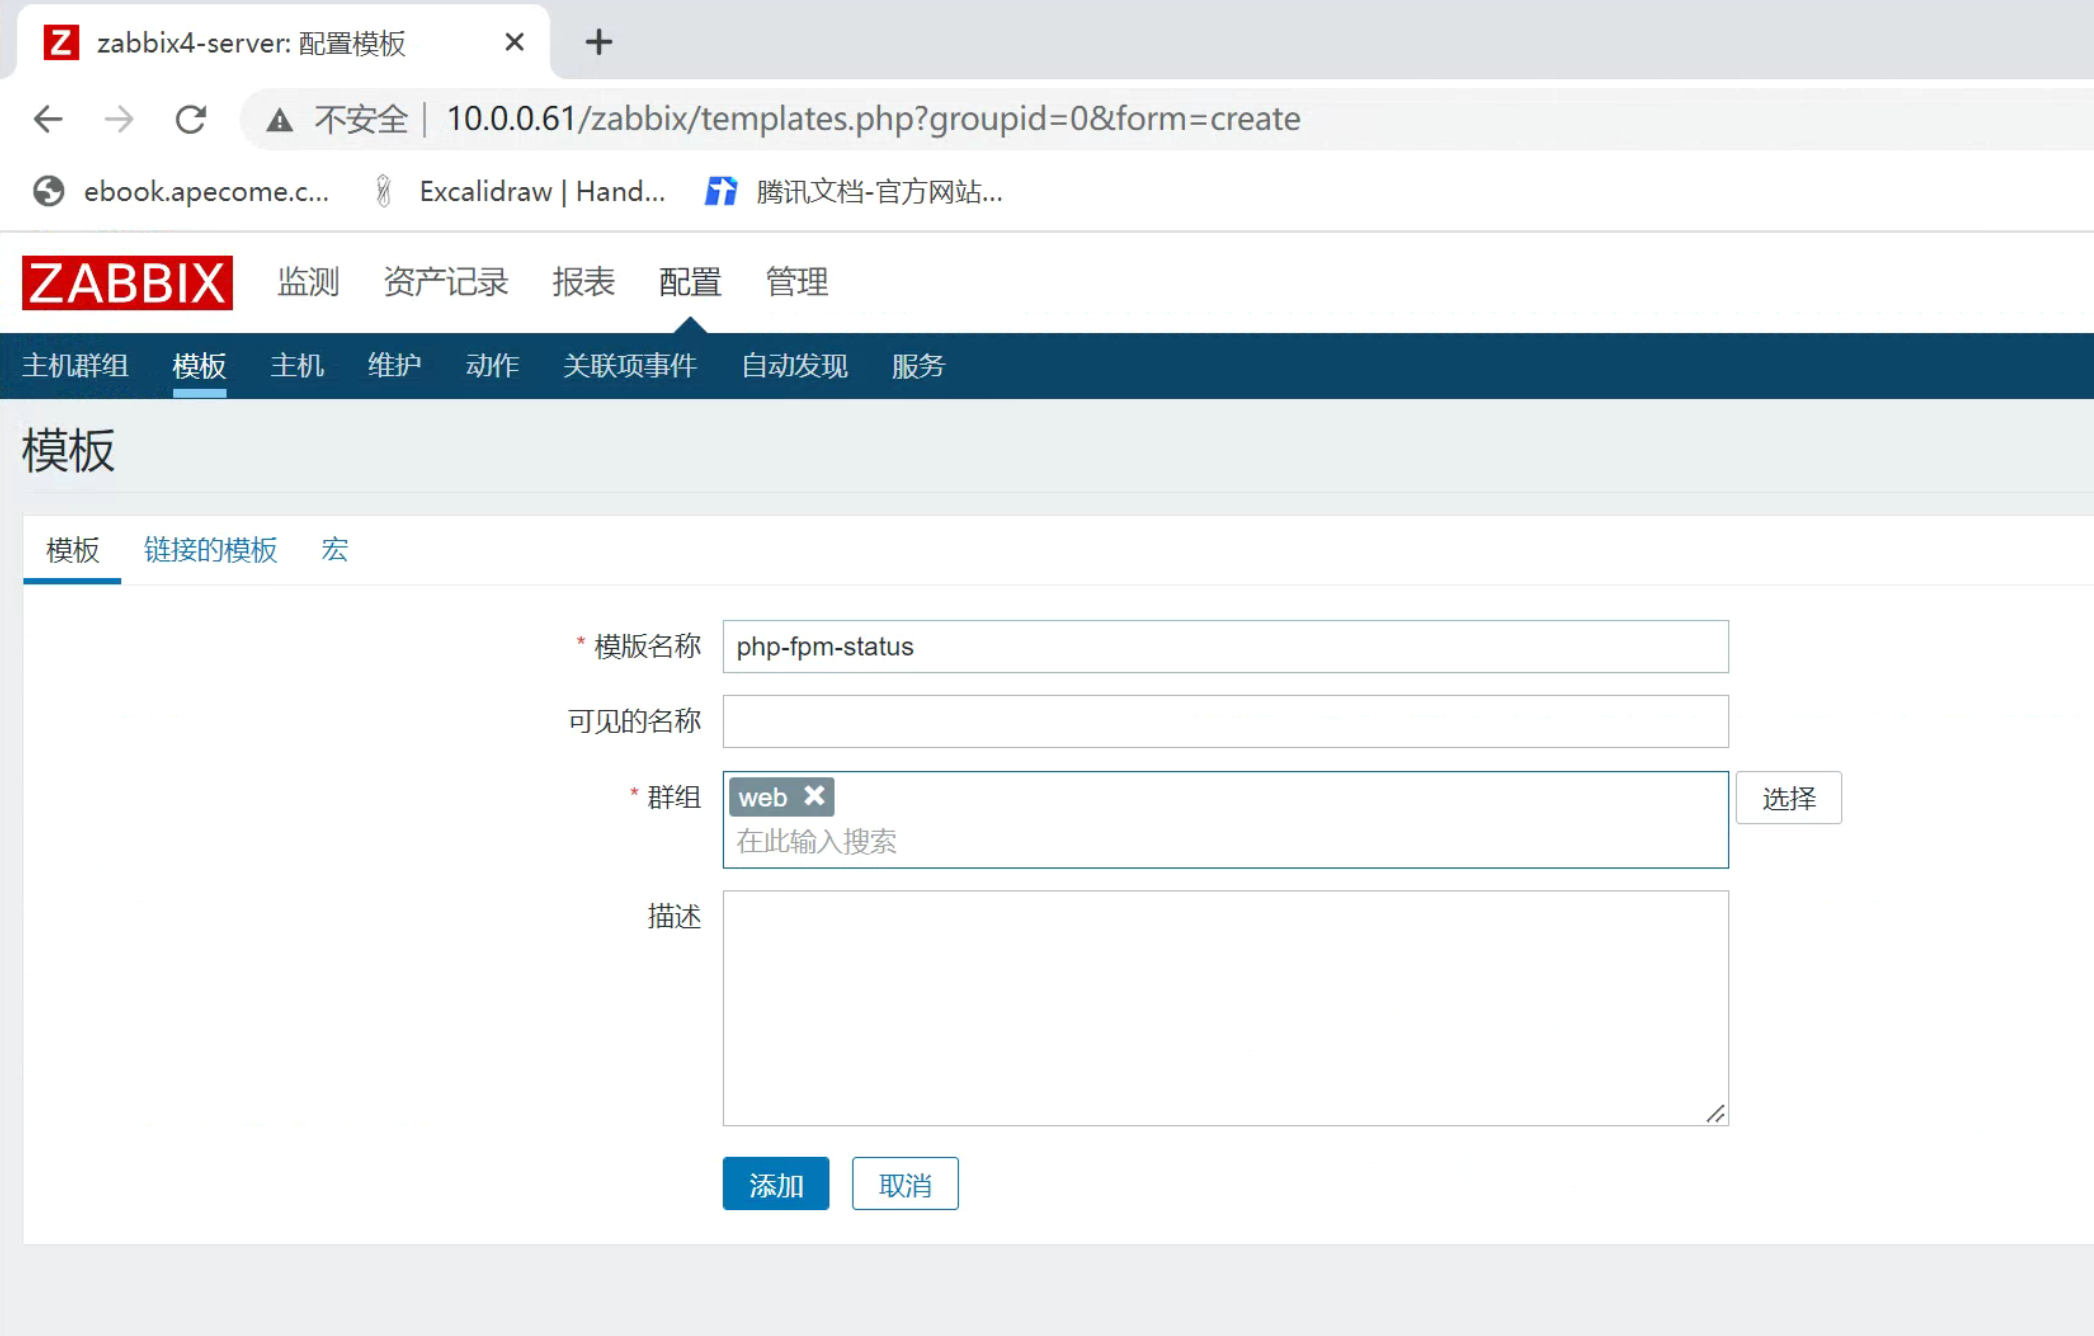
13226.配置zabbix-UI的模板
创建模板
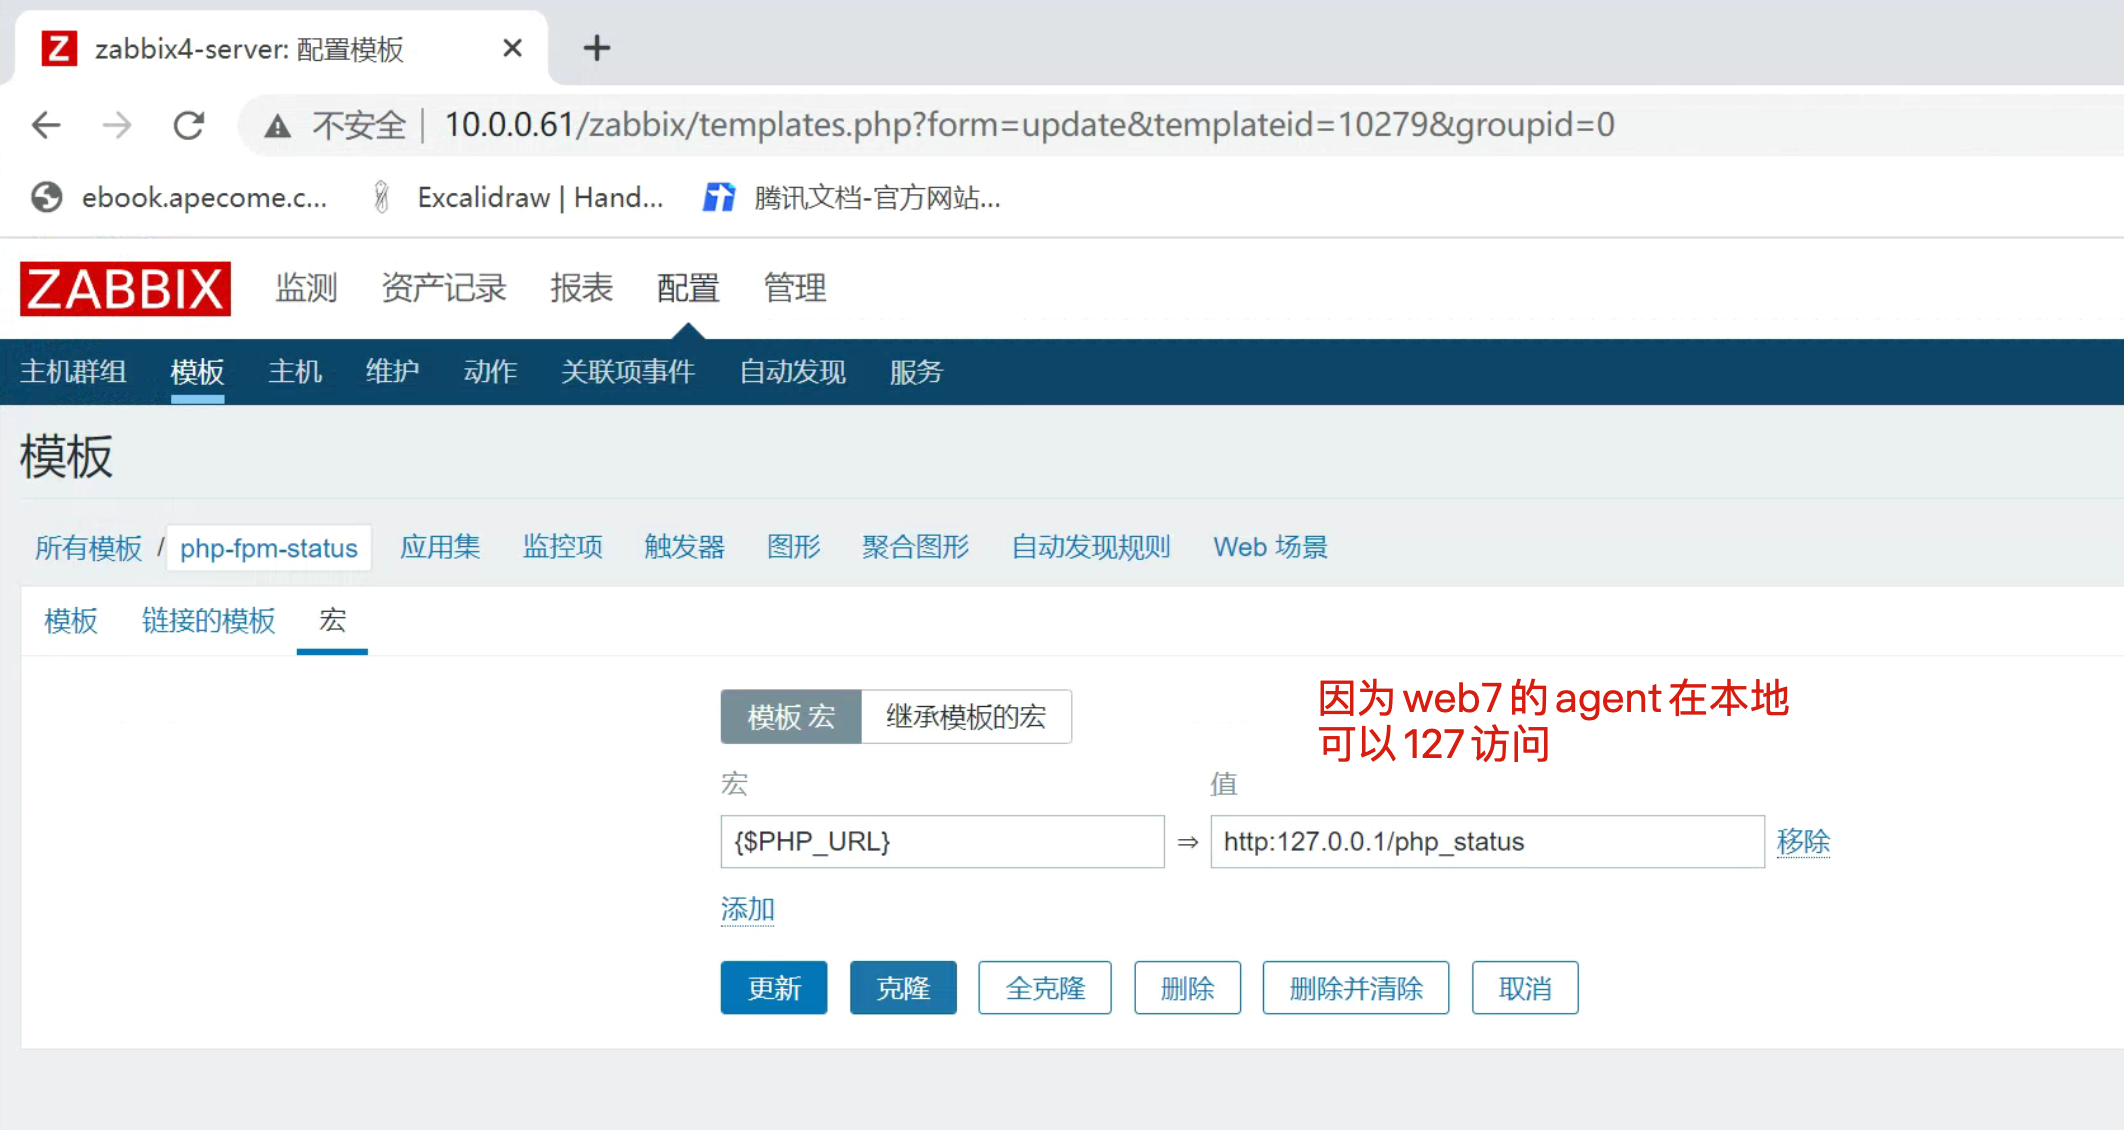
修改zabbix的宏,也就是我们自定义的status页面访问的入口url。
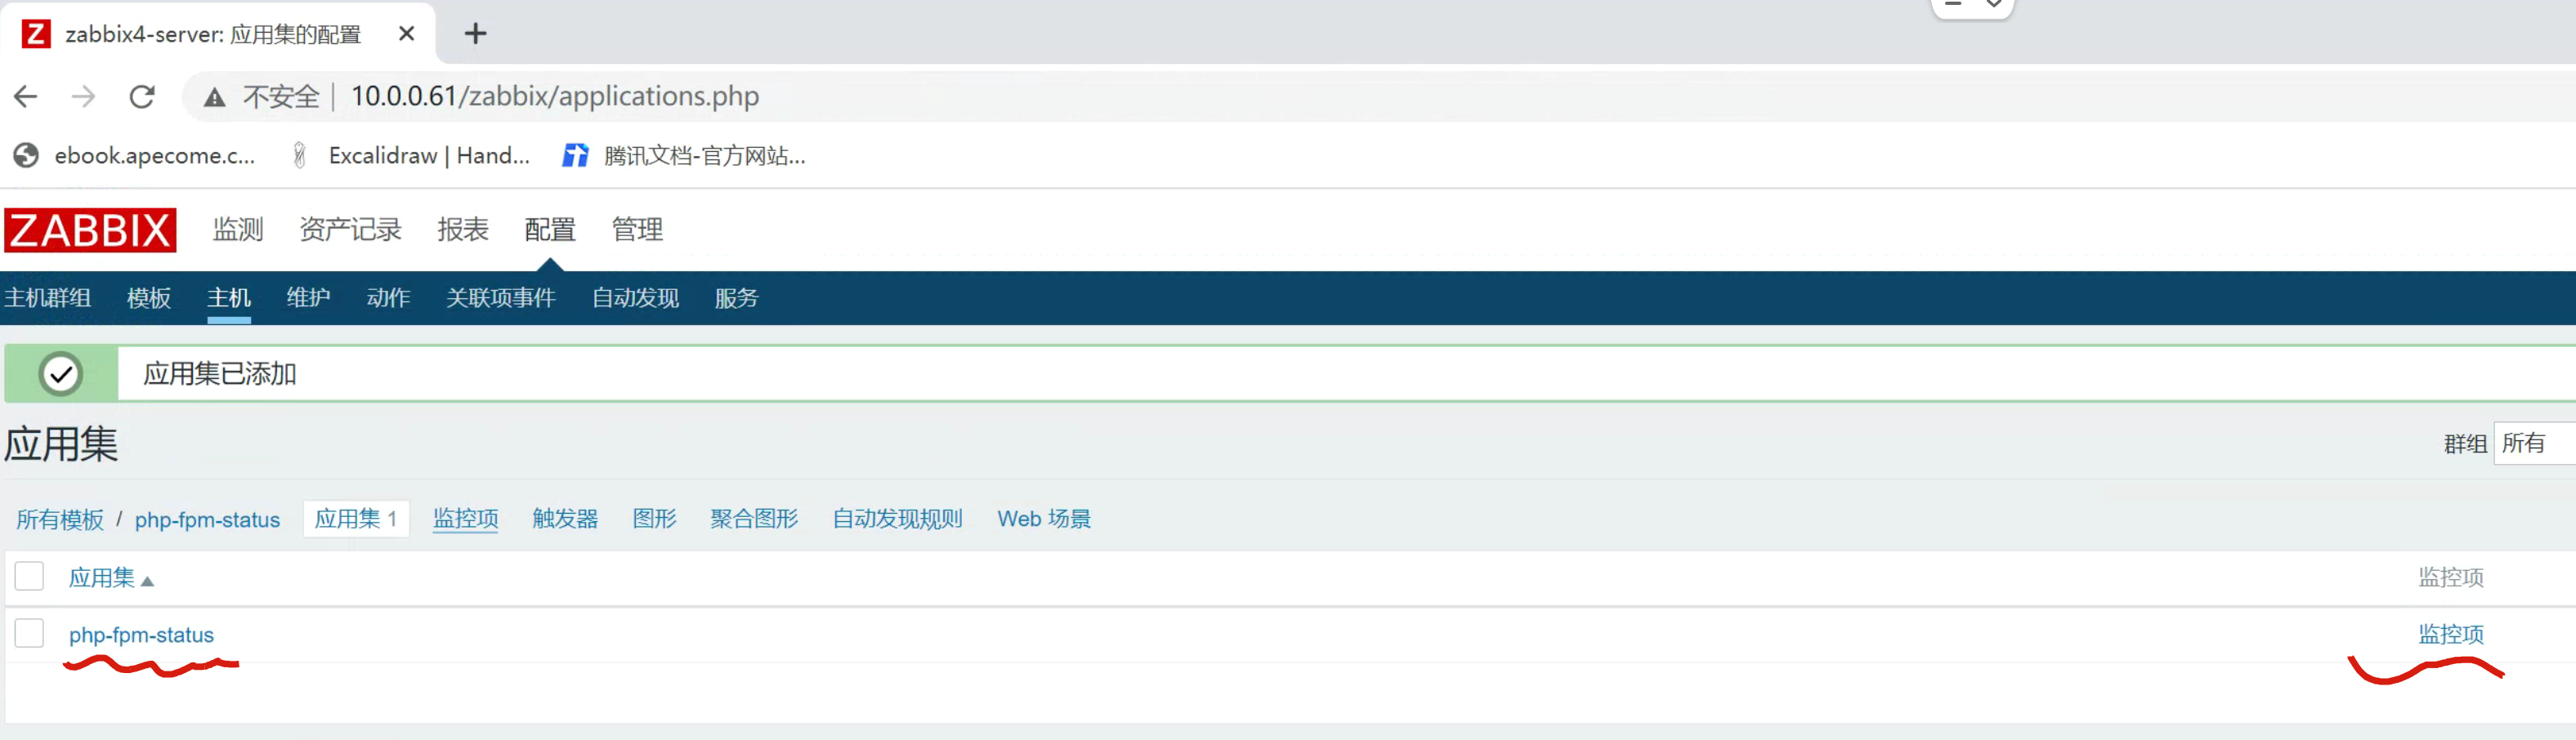
创建应用集、监控项
6.1 监控项克隆添加
克隆即可
其他监控项配置一致,只是参数key值不一样
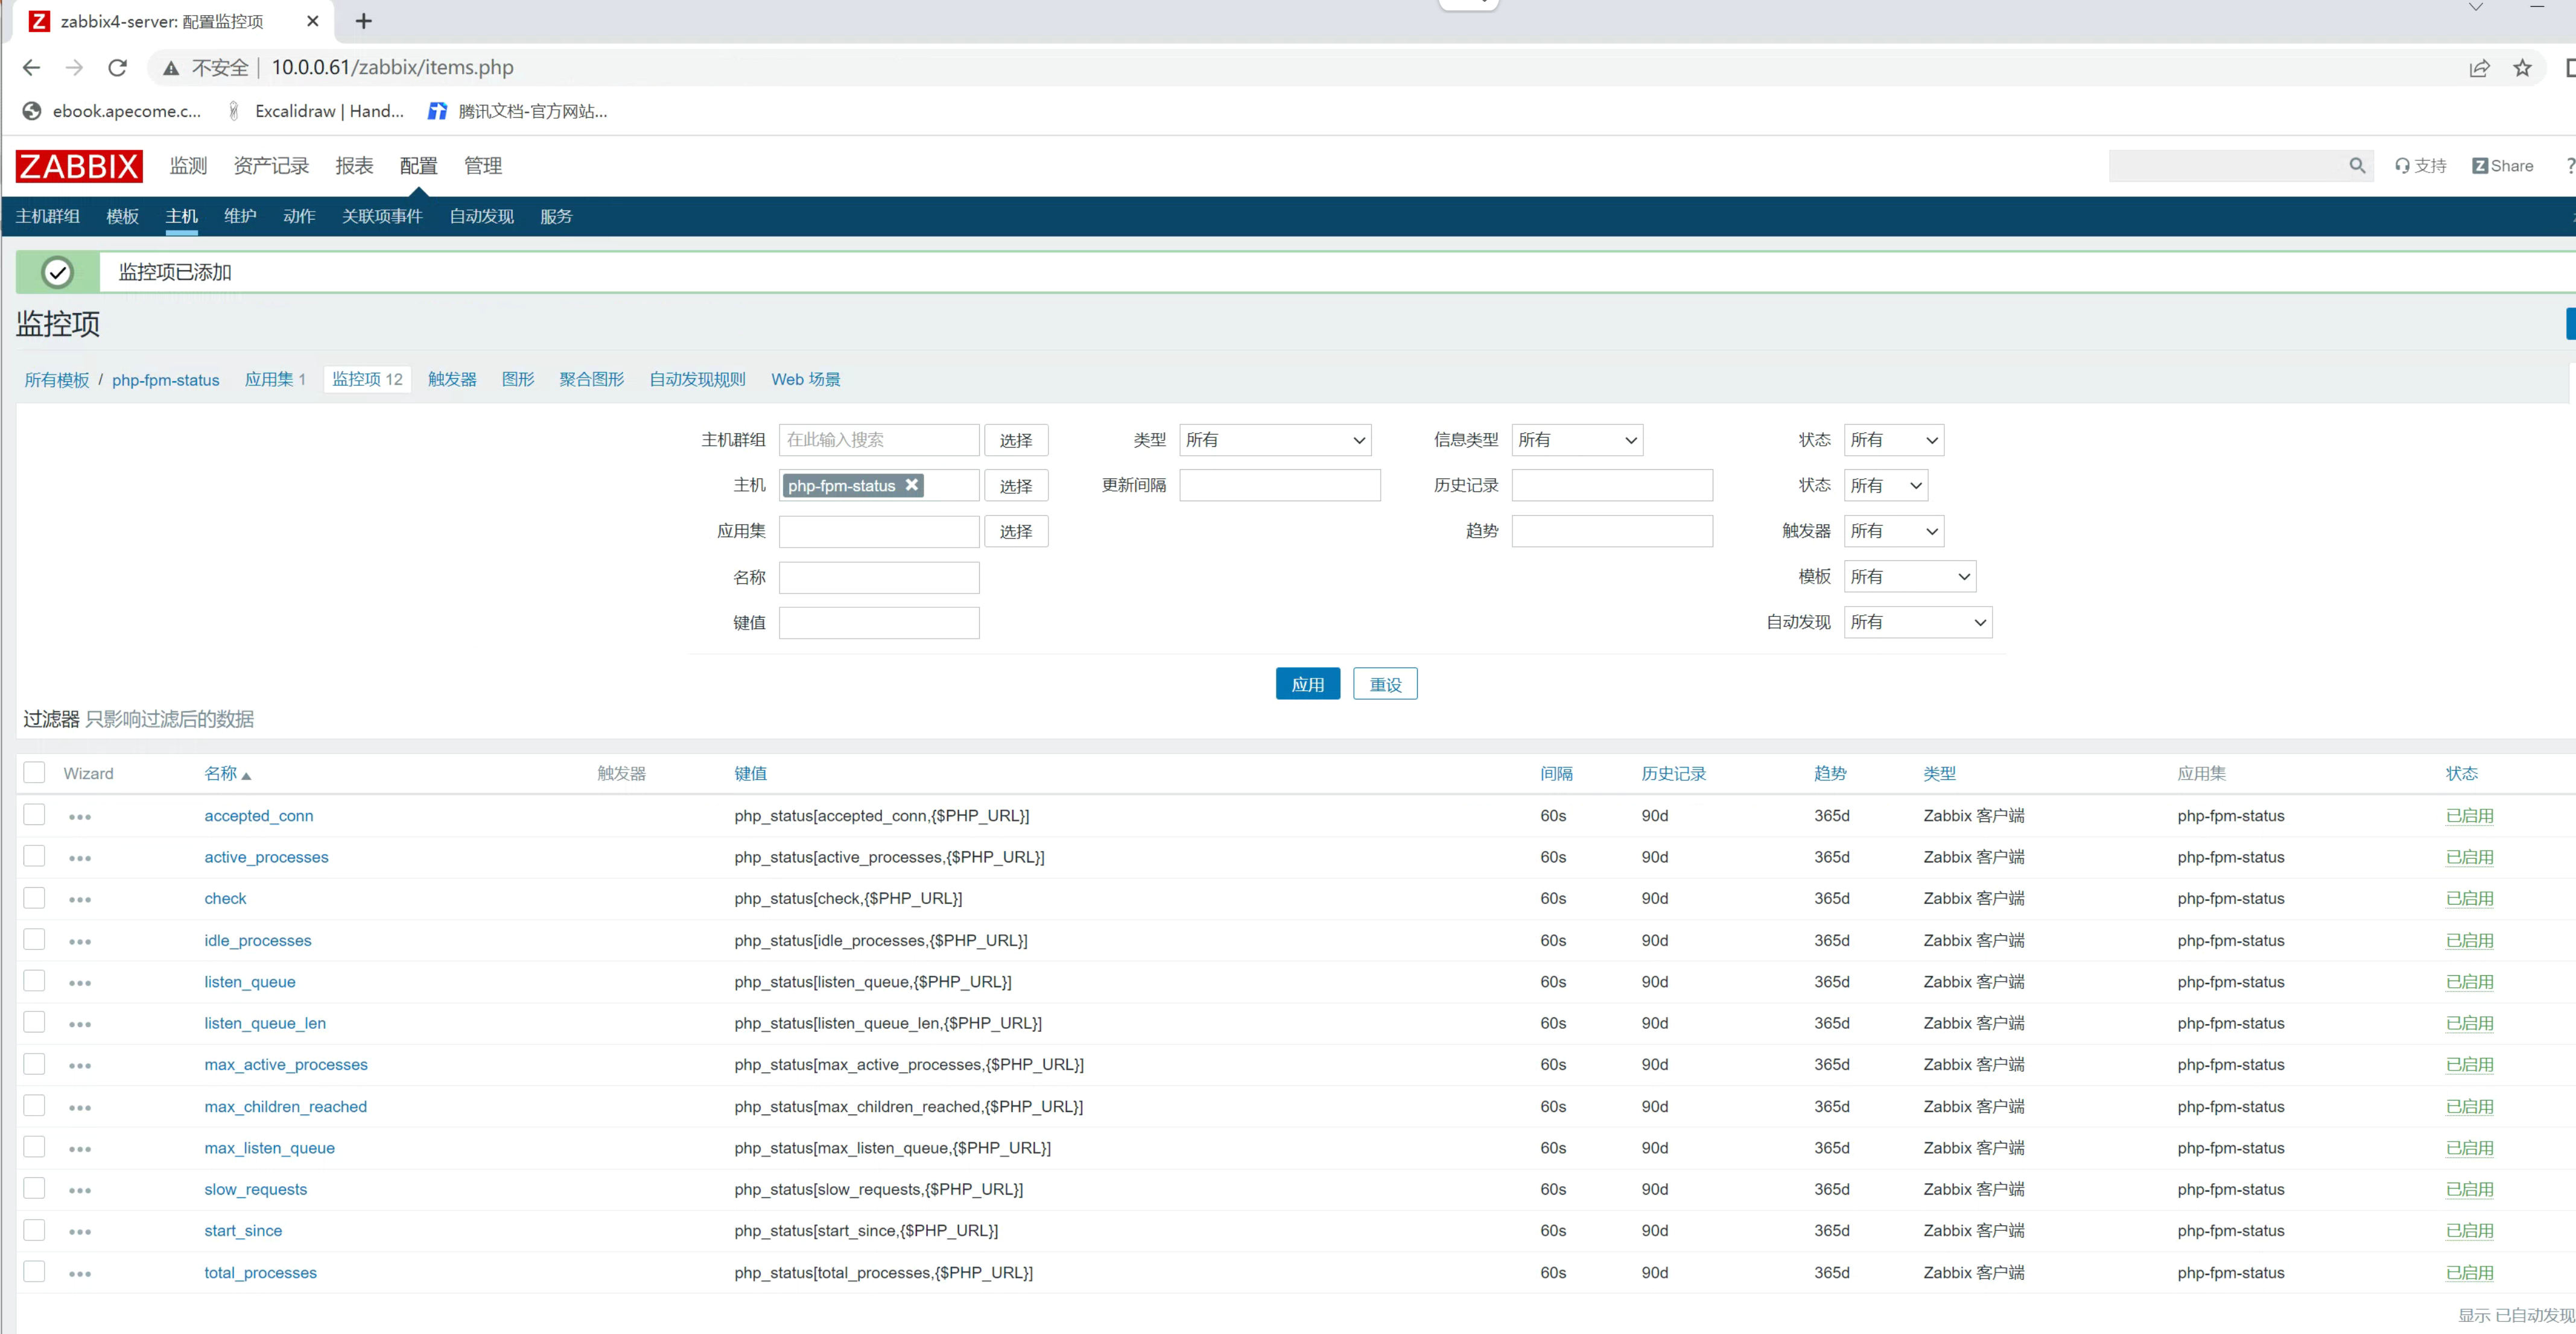
所有监控项key值
php_status[start_since,{$PHP_URL}]
php_status[accepted_conn,{$PHP_URL}]
php_status[listen_queue,{$PHP_URL}]
php_status[max_listen_queue,{$PHP_URL}]
php_status[listen_queue_len,{$PHP_URL}]
php_status[idle_processes,{$PHP_URL}]
php_status[active_processes,{$PHP_URL}]
php_status[total_processes,{$PHP_URL}]
php_status[active_processes,{$PHP_URL}]
php_status[max_active_processes,{$PHP_URL}]
php_status[max_children_reached,{$PHP_URL}]
php_status[slow_requests,{$PHP_URL}]
php_status[check,{$PHP_URL}]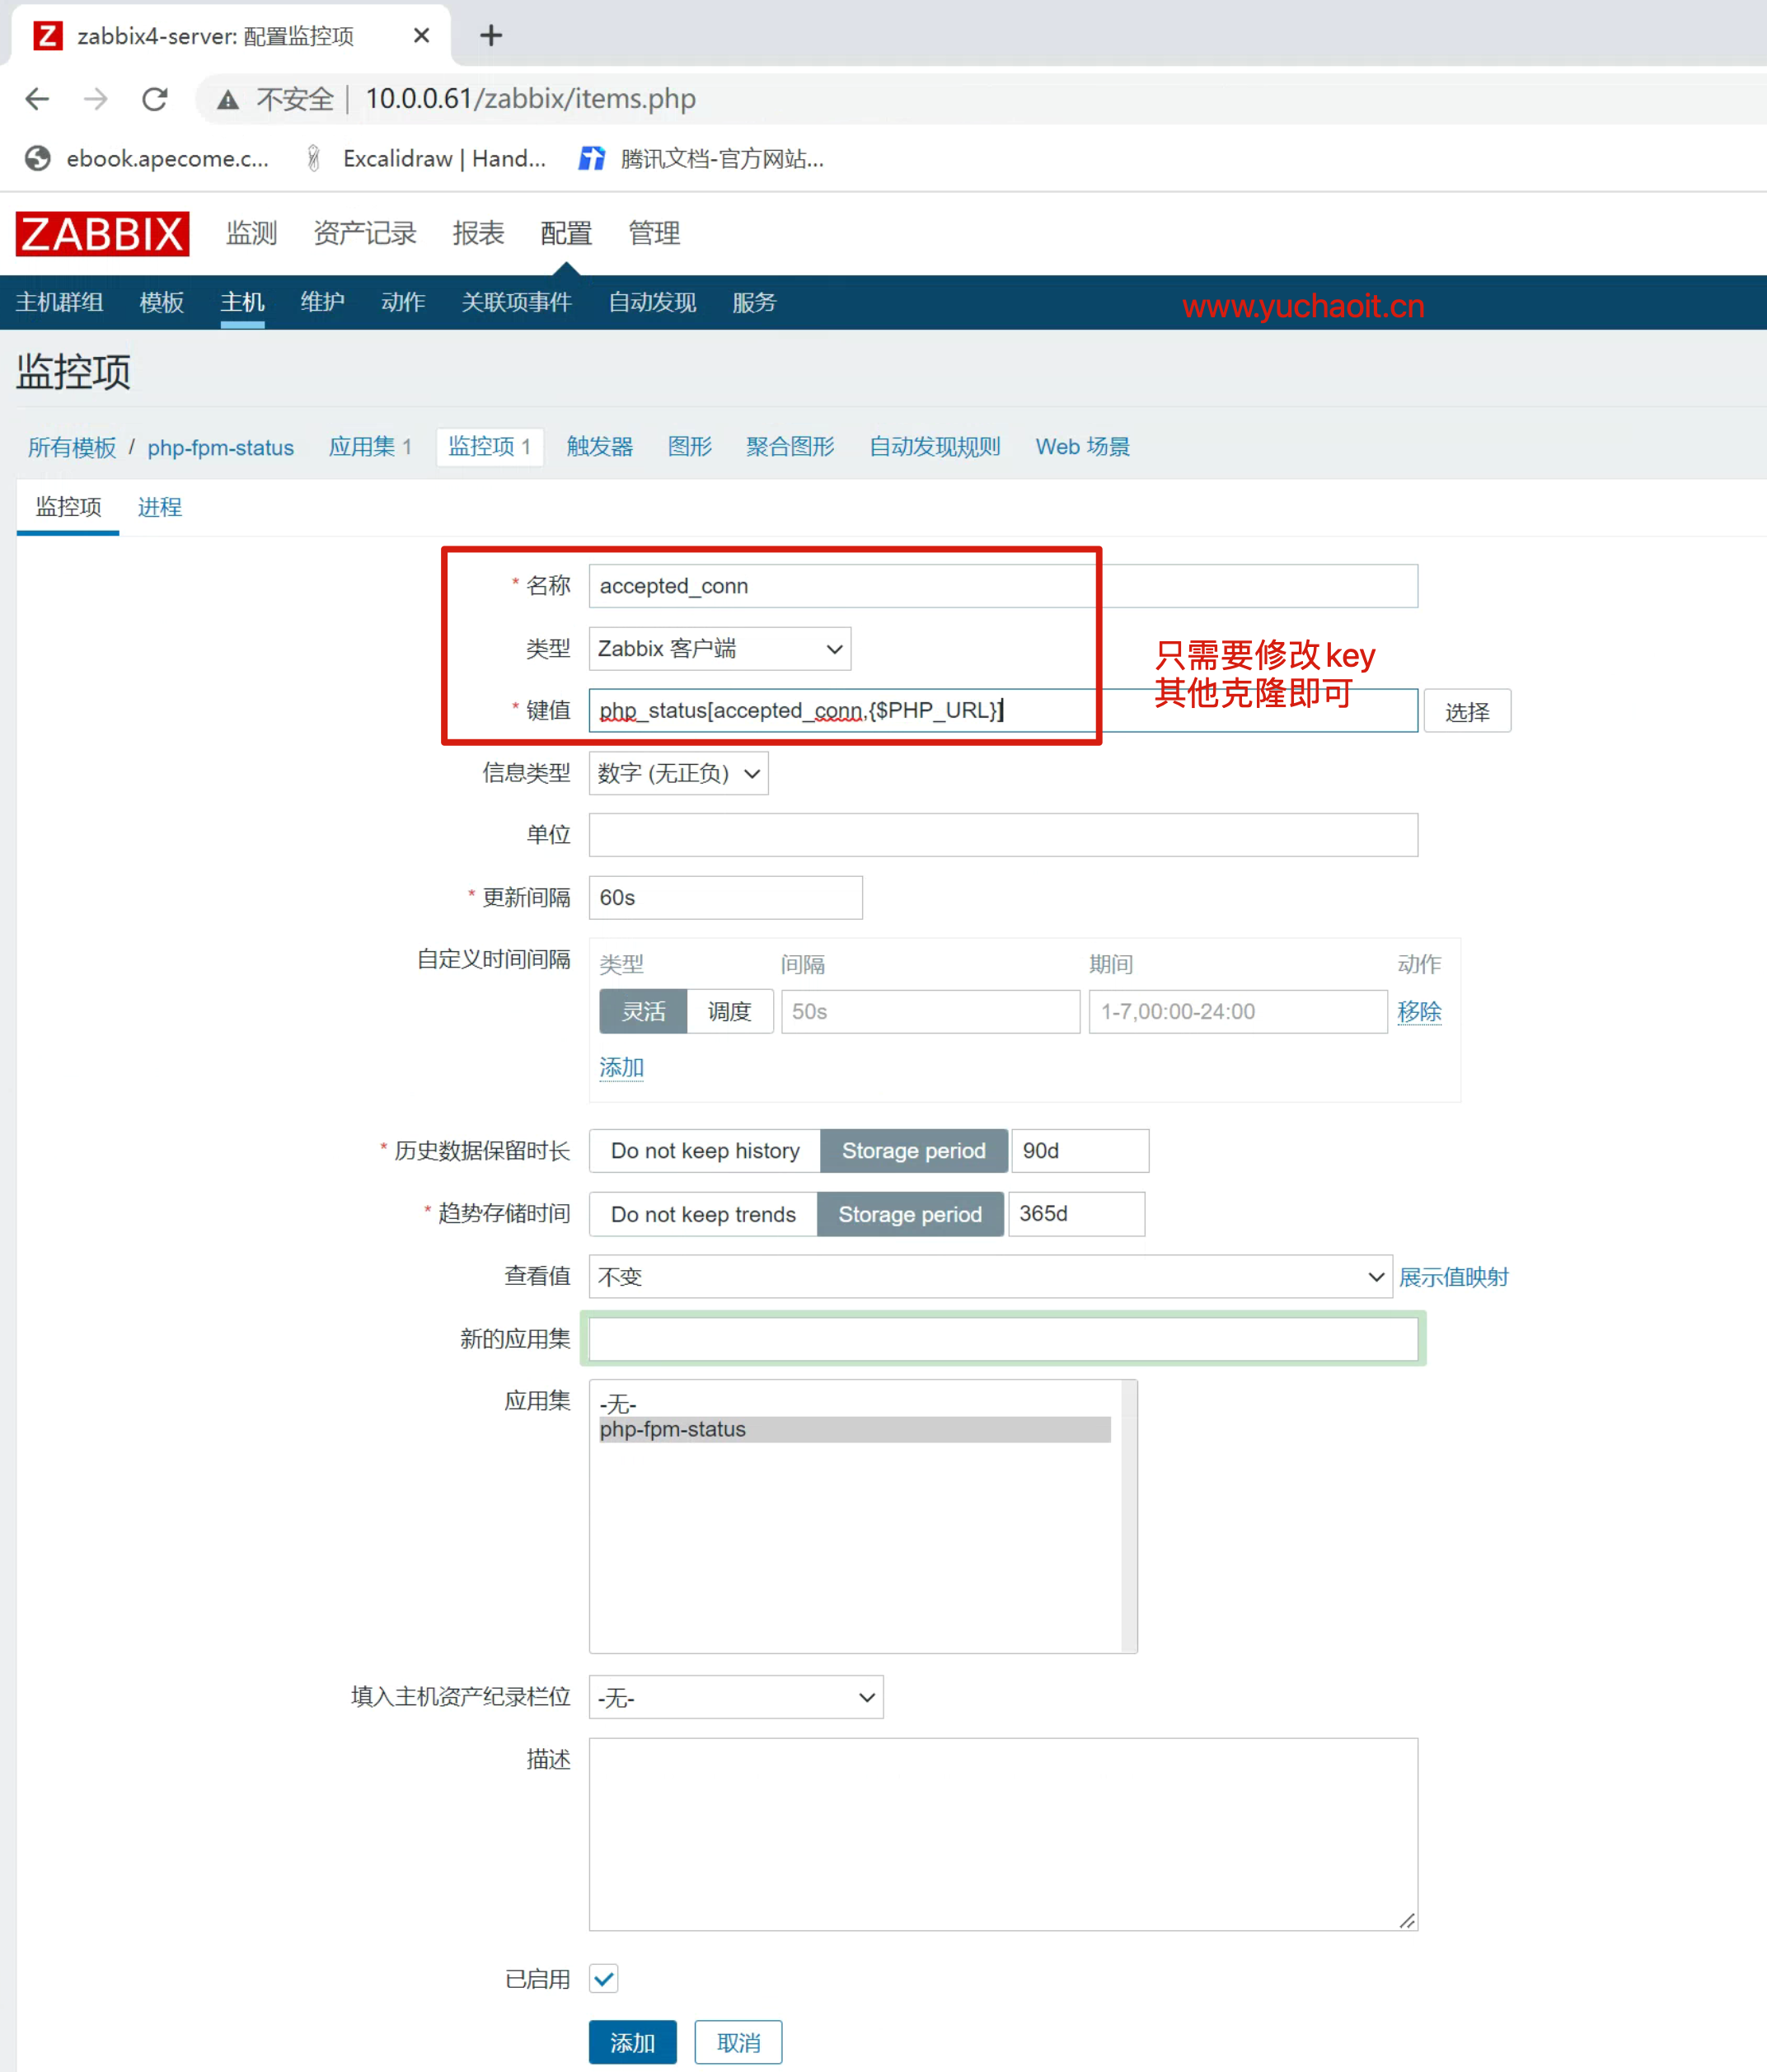
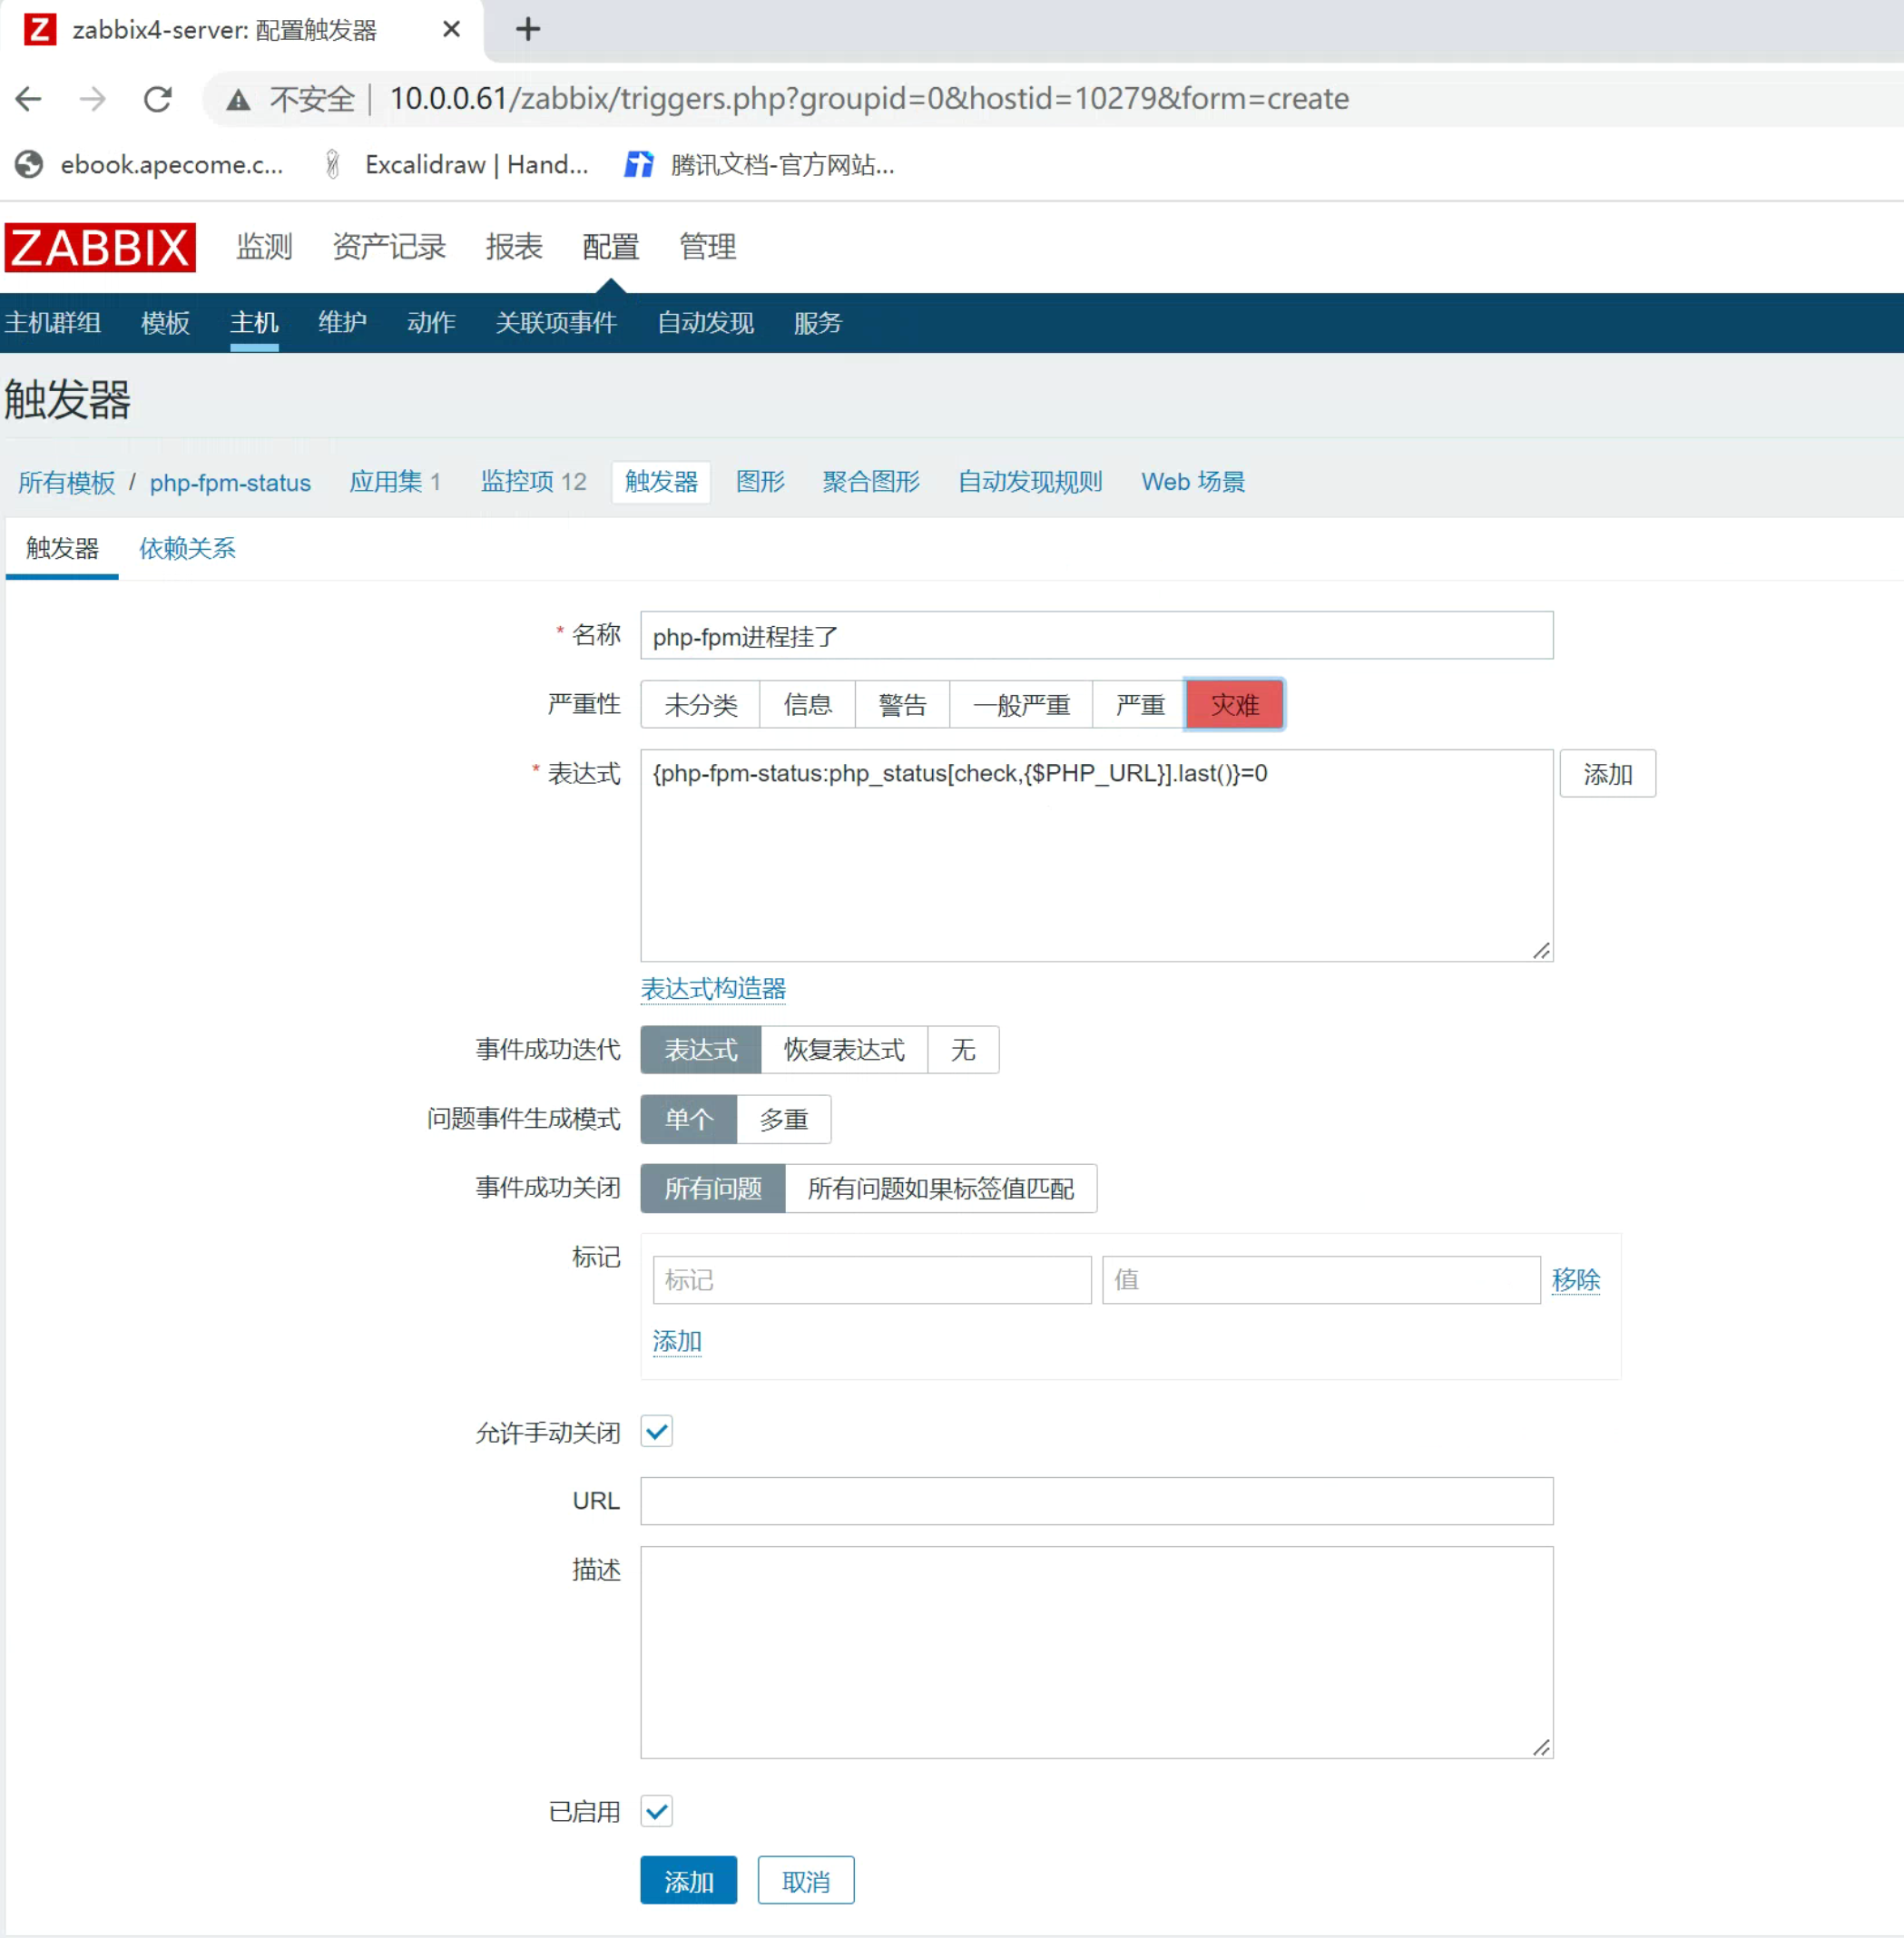
6.2 触发器添加
针对php-fpm进程状态加一个触发器,防止该进程挂了
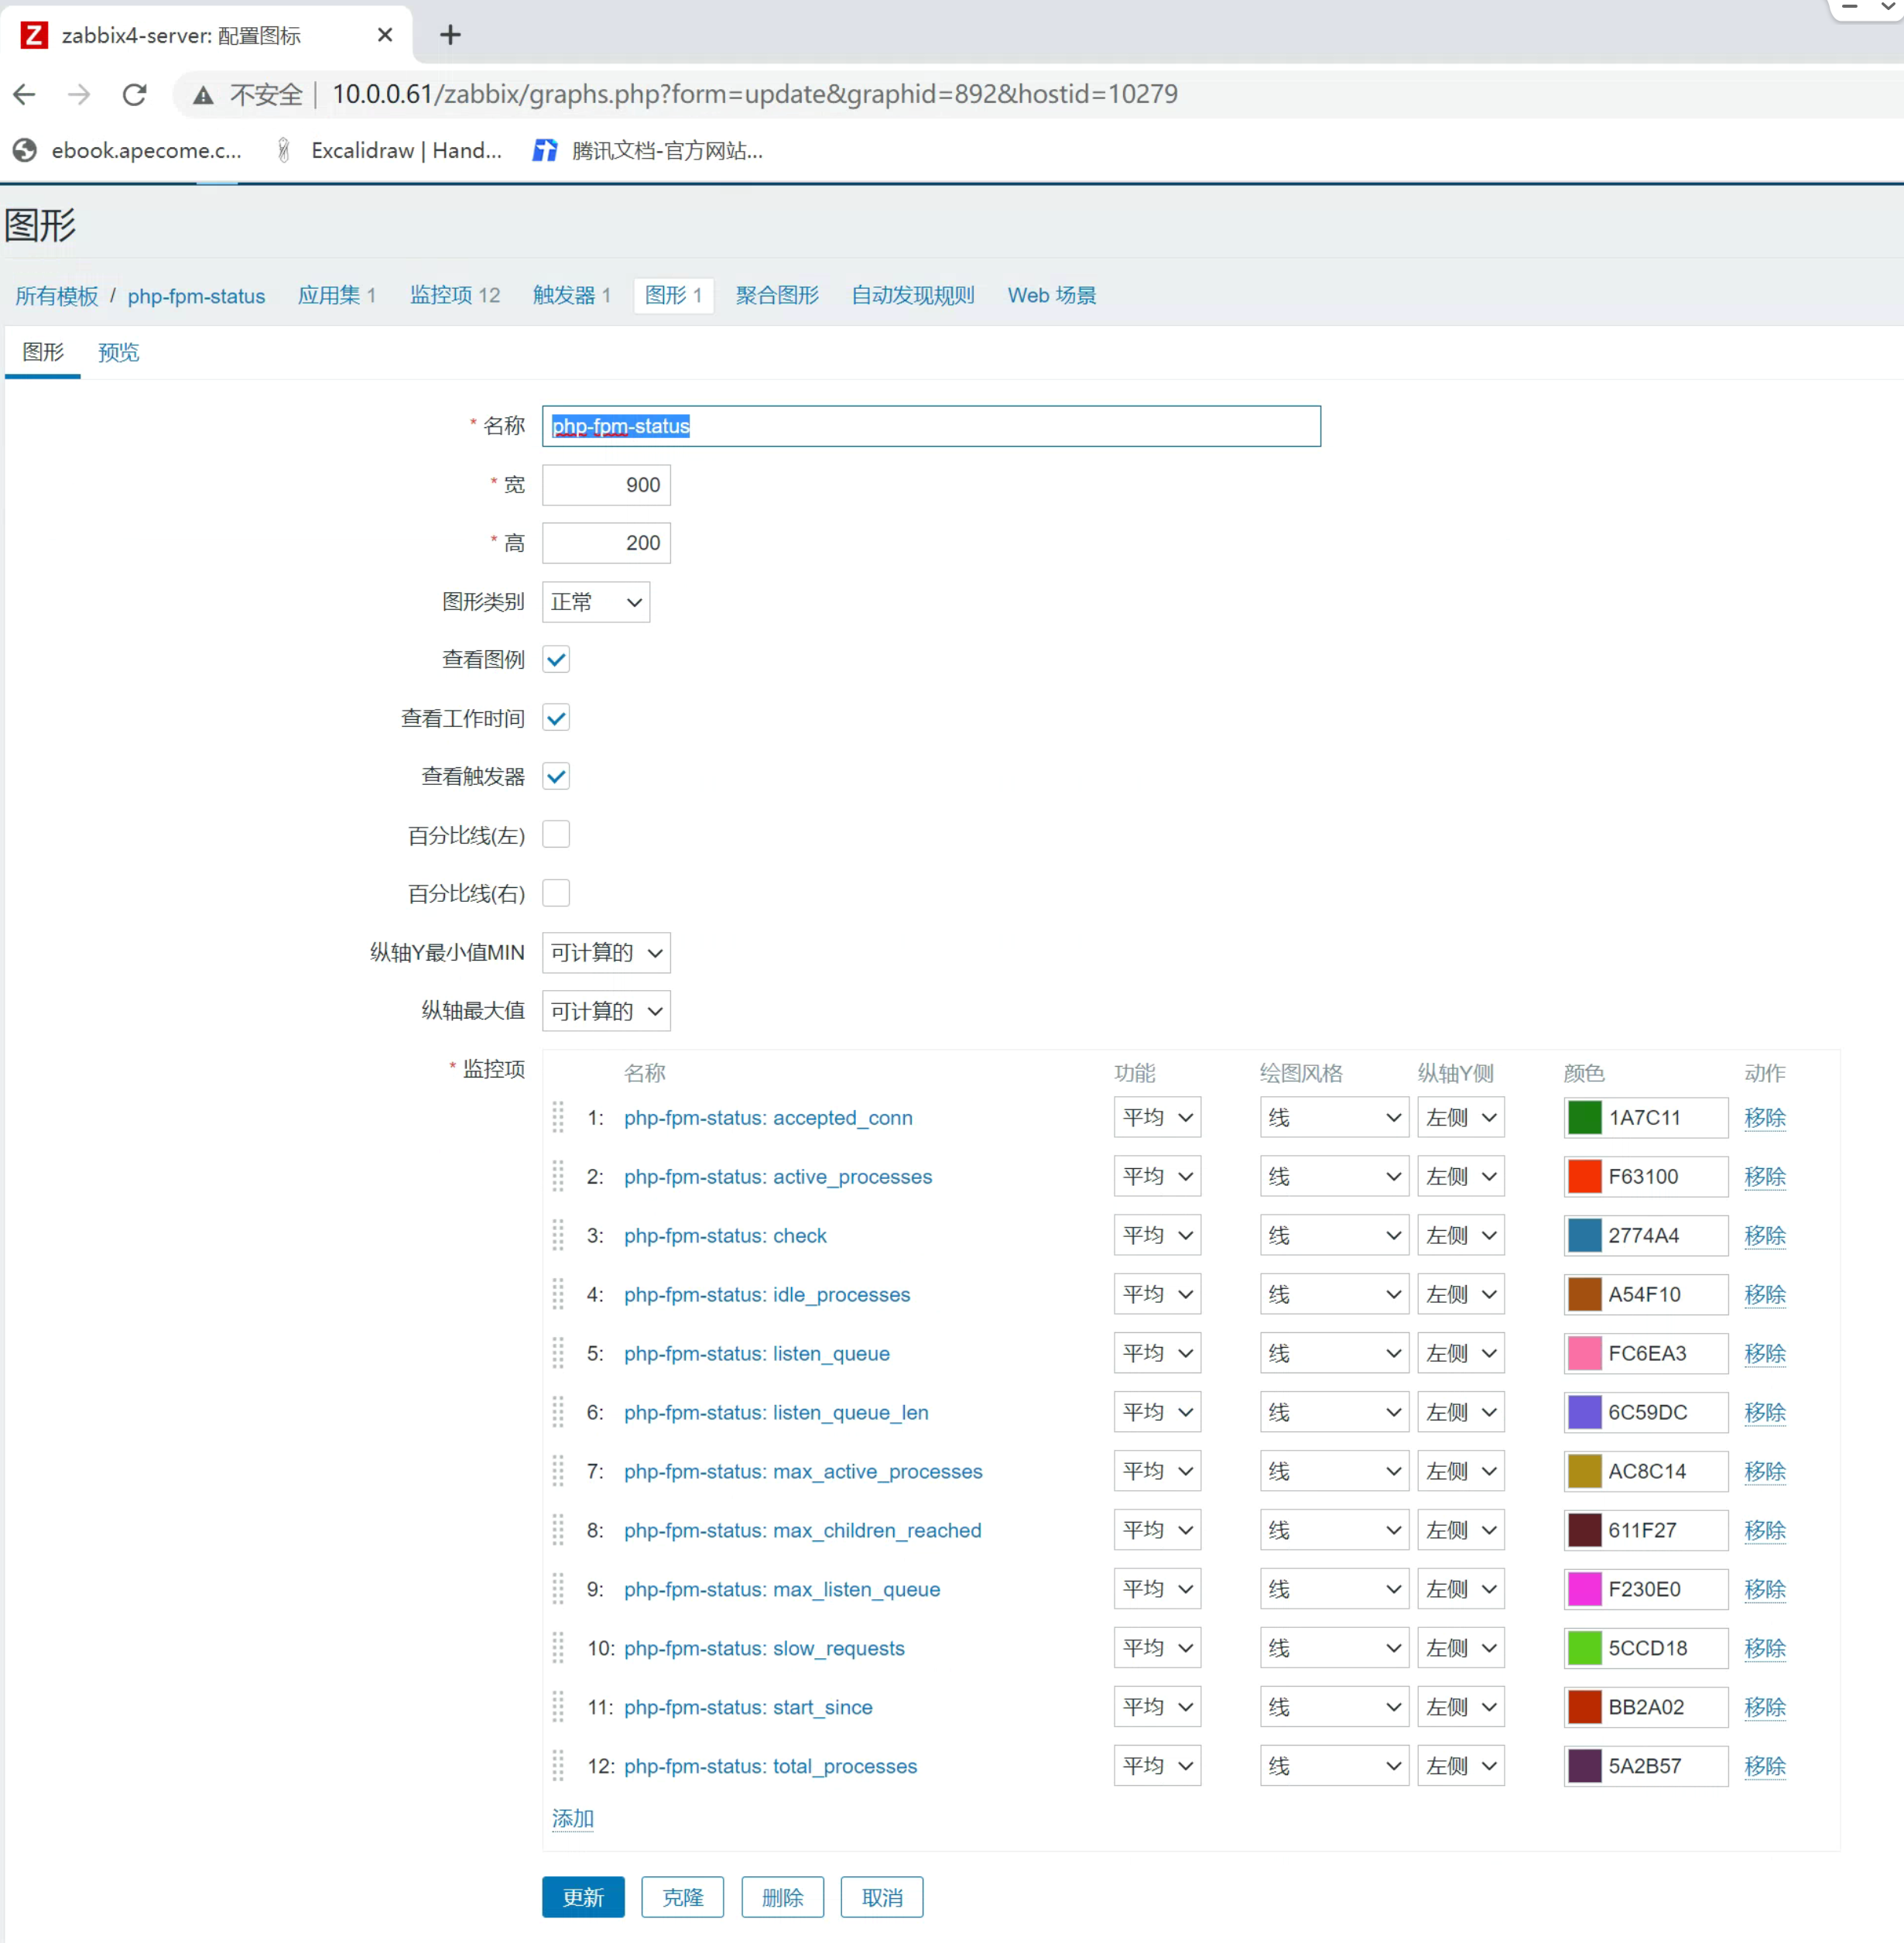
6.3 创建图形
6.4 主机使用模板

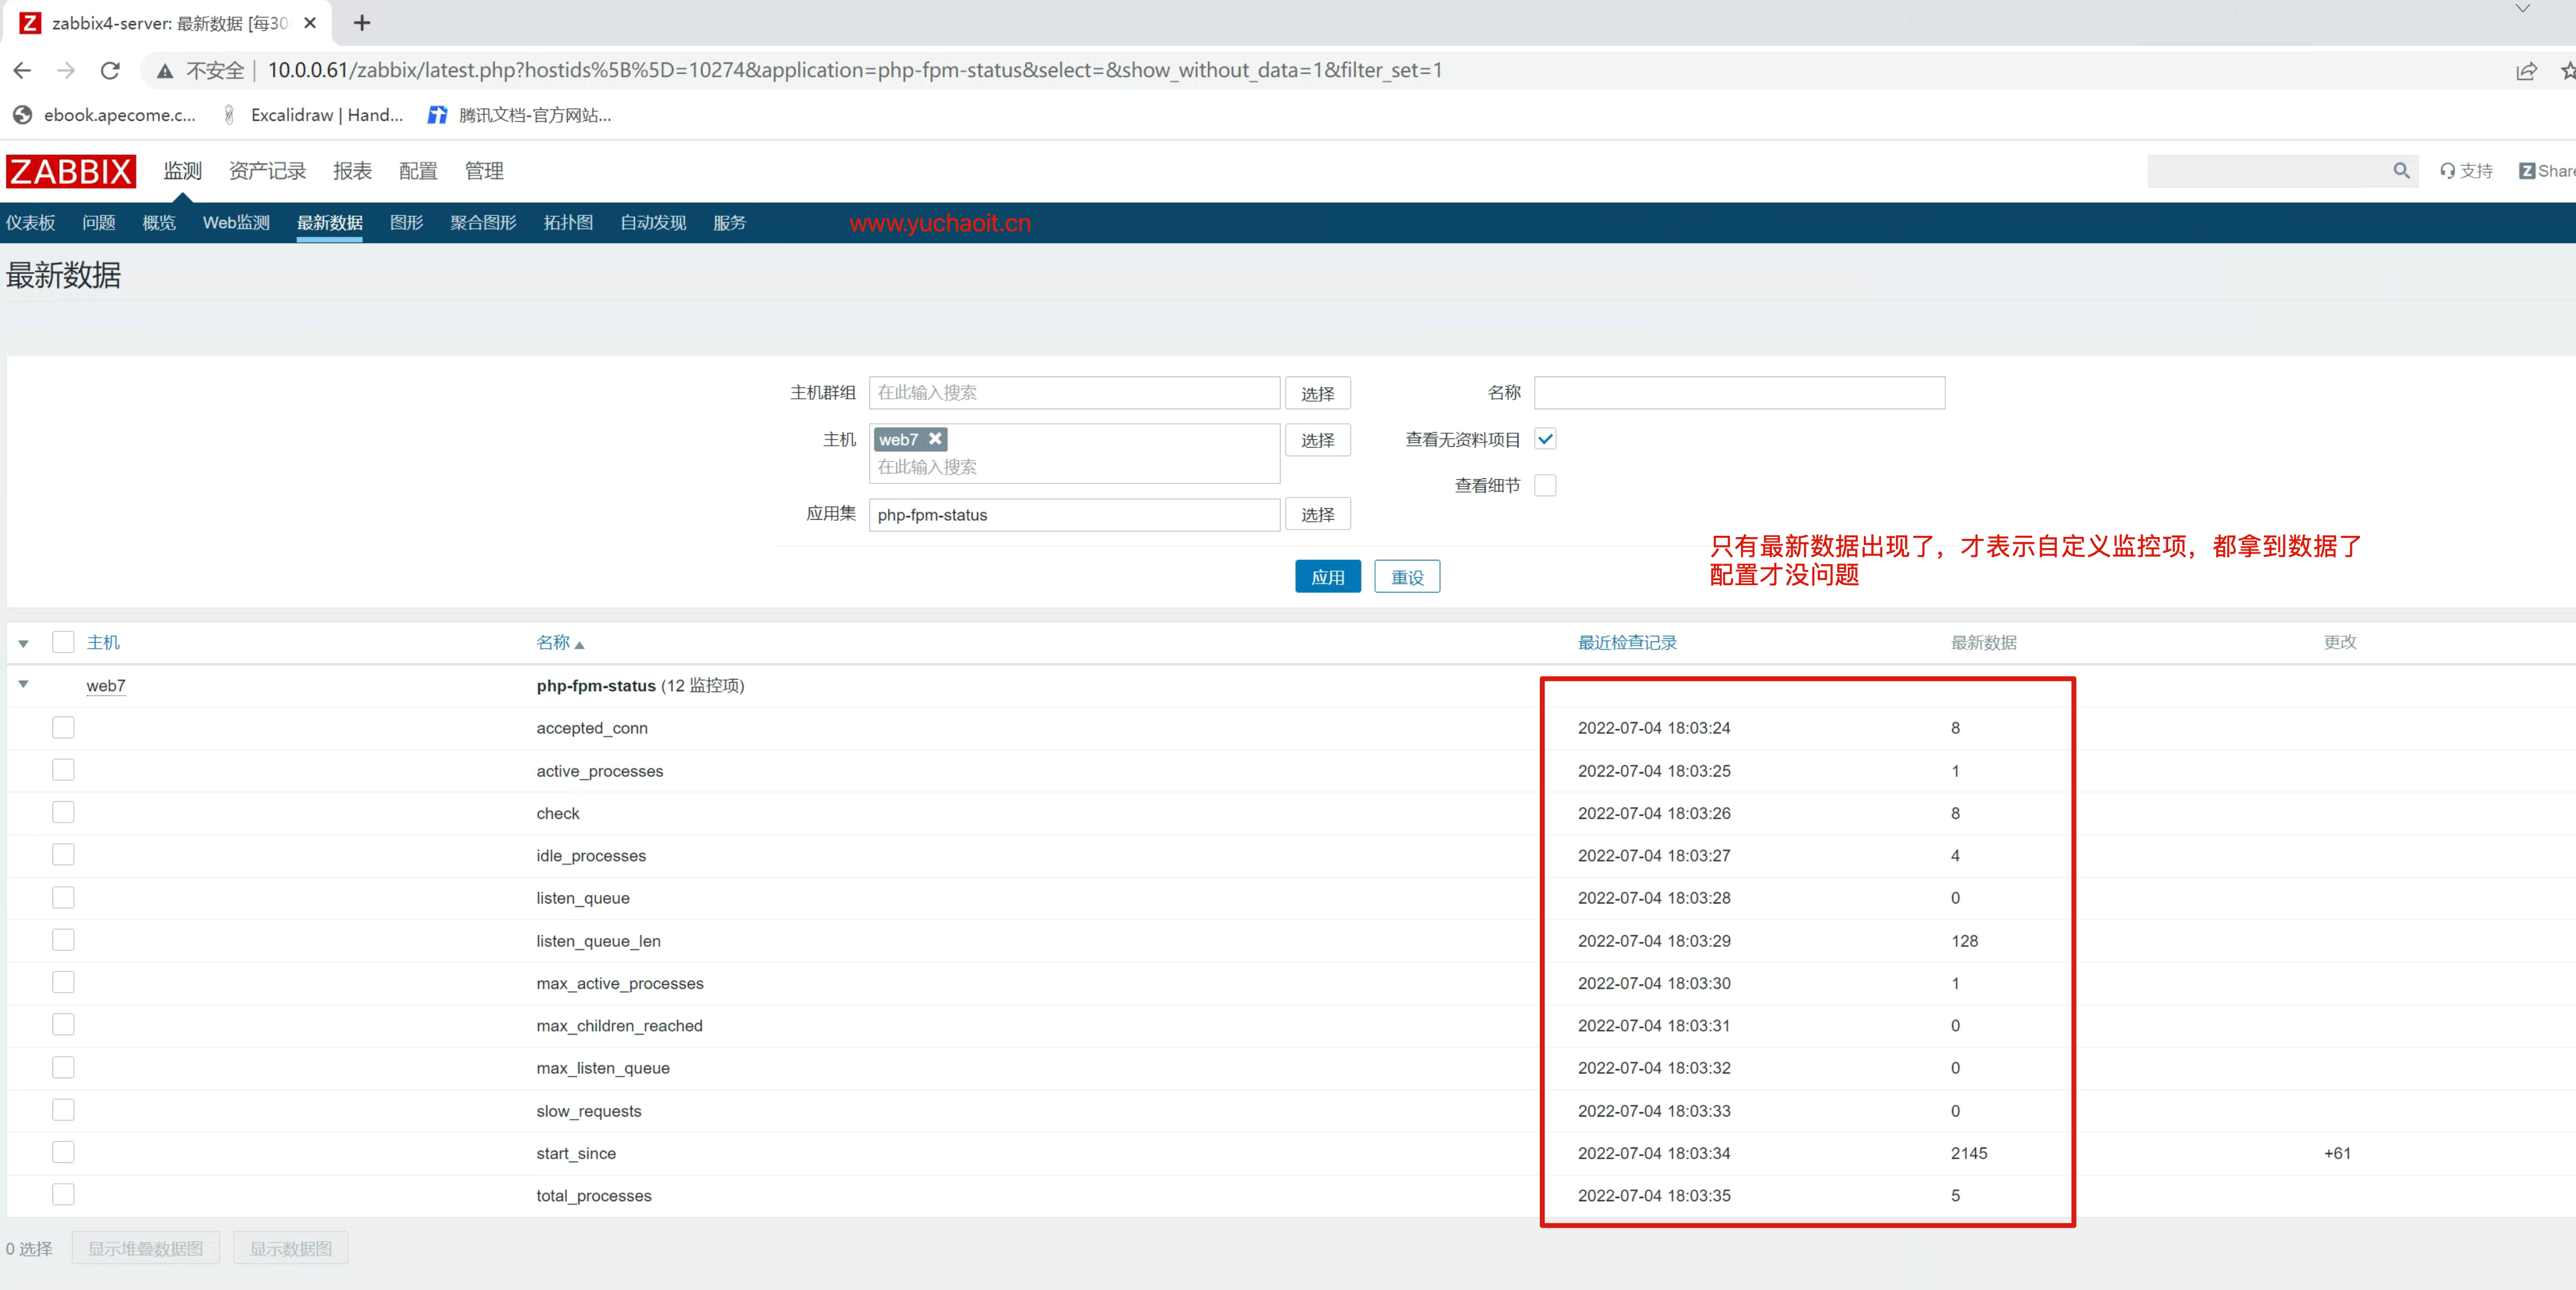
6.5 查看最新数据、图形

6.6 php-fpm挂了报警
[root@web-7 /etc/zabbix/zabbix_agentd.d]#systemctl stop php-fpm
