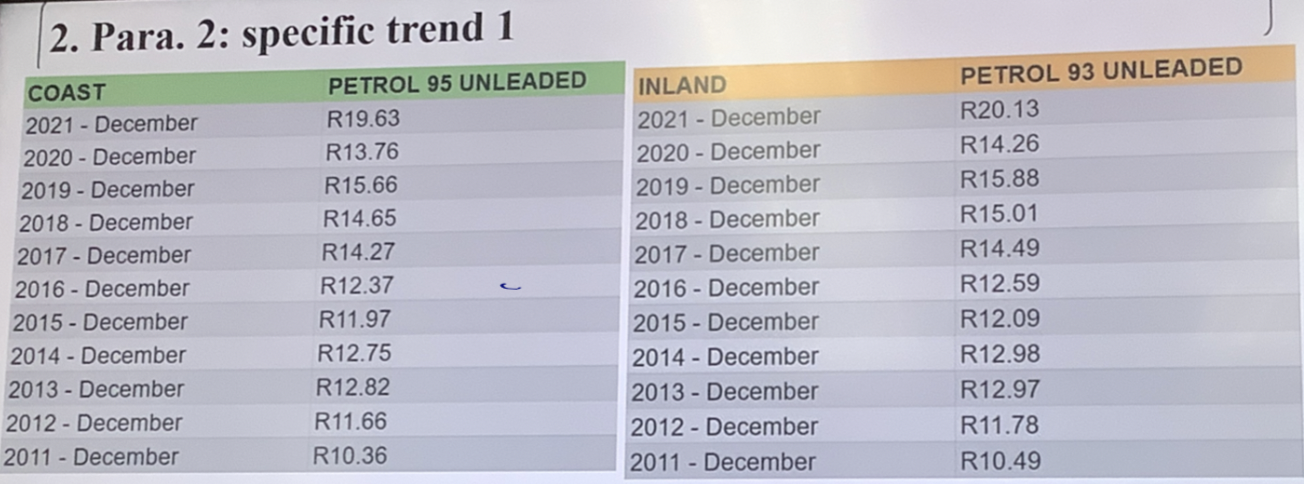
The tables show comparative data about the increase in petrol prices over a 10 year period. The comparison is being made between coastal and inland areas, and while the type of petrol is the same, there is a difference in the subtype of unleaded petrol (95 in coastal areas versus 93 in inland areas).
The coastal areas experienced a R9.27 increase(等于increase by) over 10 years In 2019 5 unleaded petrol was R10.36, but gradually increased by R2.39 over the next three years It dropped by a sall amount in 2015, but then continued to rise up to R5.66 in 2019.In 2020, there was a decrease in price down to R13.76. This decrease lasted another year before rising dramatically in 2021to R19.63.(先减后增用法,对比until)
The inland areas experienced a similar(对比词) increase over the 10-year period. In 2011 the price of 93 unleaded petrol was R10 .49 which continued to steadily rise up to R15.88 in 2019. In 2020 , just like the coastal areas(对比), there was a decrease in price, but in 2021the price rose dramatically to R20.13.
The two tables not only show the(表面上的东西) price of petrol, but also show the minute differences in (深层)cost between coastal and inlandareas. Overall, the prices over 10 years have been generally higher in inland areas compared to the coastal(一个大对比)
增长量:experienced a 多少 increase
趋势变化:This decrease lasted another year before rising dramatically