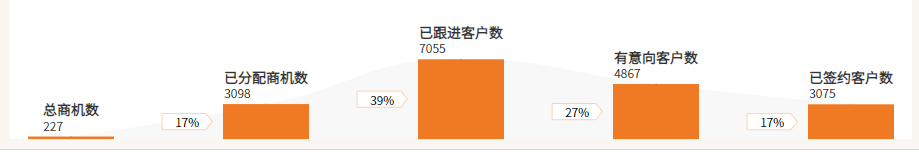
option = {
  backgroundColor: '#000',
  animation: true,
  grid: {
    top: "5%",
    bottom: "17%",
    right: "5%"
  },
  xAxis: {
    show: false,
    data: [
      '总商机数',
      '已分配商机数',
      '已跟进客户数',
      '有意向客户数',
      '已签约客户数',
    ],
  },
  yAxis: {
    show: false,
  },
  series: [
    {
      name: "d",
      type: "bar",
      barWidth: 86,
      itemStyle: {
        normal: {
          color: "#F27A11FF"
        }
      },
      data: [21, 43, 56, 32, 64],
      z: 10,
      zlevel: 0,
      label: {
        show: true,
        position: ['120%', '50%'],
        distance: 10,
        color: '#fff',
        formatter: function(p){
          return p.value +"%"
        },
      }
    },
    {
      name: "背影",
      type: "line",
      smooth: true, //平滑曲线显示
      showAllSymbol: false, //显示所有图形。
      symbolSize: 0,
      lineStyle: {
        width: 0
      },
      areaStyle: {
        color: "rgba(245, 245, 245, 0.1)"
      },
      data: [21, 43, 56, 32, 64],
      z: 5
    },
    {
      data: [21, 43, 56, 32, 64],
      type: 'line',
      lineStyle: {
        color: "rgba(1, 1, 1, 0)"
      },
      symbol: 'circle',
      symbolSize: 1,
      label: {
        normal: {
          // position: "bottom",
          show: true,
          // color: '#3779D2',
          formatter: '{title|{b}}\n{numClass|{c}}',
          rich: {
            title: {
              fontSize: 14,
            },
            numClass: {
              fontSize: 12
            }
          }
        }
      },
      showBackground: false,
    }
  ],
  dataZoom: [
    {
      type: "slider",
      show: false,
      xAxisIndex: [0],
      endValue: 6,
      startValue: 0
    }
  ]
}
效果图: