一、Prometheus简介
Prometheus是最初在SoundCloud上构建的开源系统监视和警报工具包。自2012年成立以来,许多公司和组织都采用了Prometheus,该项目拥有非常活跃的开发人员和用户社区。Prometheus 于2016年加入了 Cloud Native Computing Foundation,这是继Kubernetes之后的第二个托管项目
Exporter是一个采集监控数据并通过Prometheus监控规范对外提供数据的组件,能为Prometheus提供监控的接口。
Exporter将监控数据采集的端点通过HTTP服务的形式暴露给Prometheus Server,Prometheus Server通过访问该
Exporter提供的Endpoint端点,即可获取到需要采集的监控数据。不同的Exporter负责不同的业务。
二、环境准备
| 系统 | ip | 角色 | 主机名 |
| centos7.5 | 192.168.109.116 | prometheus、grafana | pro01 |
| centos7.5 | 192.168.109.116 | node1 | pro02 |
文档:https://prometheus.io/docs/introduction/overview/
下载prometheus各组件:
https://prometheus.io/download/
三、部署Prometheus
1、下载最新版本Prometheus解压安装
[root@pro01 ~]# ll
总用量 64732
-rw-------. 1 root root     1245 1月  11 22:53 anaconda-ks.cfg
-rw-r--r--. 1 root root 66280932 2月  19 13:54 prometheus-2.25.0.linux-amd64.tar.gz
[root@pro01 ~]# tar xzvf prometheus-2.25.0.linux-amd64.tar.gz
prometheus-2.25.0.linux-amd64/
prometheus-2.25.0.linux-amd64/consoles/
prometheus-2.25.0.linux-amd64/consoles/index.html.example
prometheus-2.25.0.linux-amd64/consoles/node-cpu.html
prometheus-2.25.0.linux-amd64/consoles/node-disk.html
prometheus-2.25.0.linux-amd64/consoles/node-overview.html
prometheus-2.25.0.linux-amd64/consoles/node.html
prometheus-2.25.0.linux-amd64/consoles/prometheus-overview.html
prometheus-2.25.0.linux-amd64/consoles/prometheus.html
prometheus-2.25.0.linux-amd64/console_libraries/
prometheus-2.25.0.linux-amd64/console_libraries/menu.lib
prometheus-2.25.0.linux-amd64/console_libraries/prom.lib
prometheus-2.25.0.linux-amd64/prometheus.yml
prometheus-2.25.0.linux-amd64/LICENSE
prometheus-2.25.0.linux-amd64/NOTICE
prometheus-2.25.0.linux-amd64/prometheus
prometheus-2.25.0.linux-amd64/promtool
[root@pro01 ~]# mv prometheus-2.25.0.linux-amd64 /usr/local/prometheus
[root@pro01 ~]# ll /usr/local/prometheus/
总用量 167984
drwxr-xr-x. 2 3434 3434       38 2月  18 00:11 console_libraries
drwxr-xr-x. 2 3434 3434      173 2月  18 00:11 consoles
drwxr-xr-x. 6 root root      138 2月  20 09:27 data
-rw-r--r--. 1 3434 3434    11357 2月  18 00:11 LICENSE
-rw-r--r--. 1 3434 3434     3420 2月  18 00:11 NOTICE
-rwxr-xr-x. 1 3434 3434 91044140 2月  17 22:19 prometheus
-rw-r--r--. 1 3434 3434     1015 2月  19 14:56 prometheus.yml
-rwxr-xr-x. 1 3434 3434 80948693 2月  17 22:21 promtool
2、启动Prometheus
[root@pro01 prometheus]# ./prometheus
level=info ts=2021-02-20T01:27:13.415Z caller=main.go:366 msg="No time or size retention was set so using the default time retention" duration=15d
level=info ts=2021-02-20T01:27:13.415Z caller=main.go:404 msg="Starting Prometheus" version="(version=2.25.0, branch=HEAD, revision=a6be548dbc17780d562a39c0e4bd0bd4c00ad6e2)"
level=info ts=2021-02-20T01:27:13.415Z caller=main.go:409 build_context="(go=go1.15.8, user=root@615f028225c9, date=20210217-14:17:24)"
level=info ts=2021-02-20T01:27:13.415Z caller=main.go:410 host_details="(Linux 3.10.0-1127.el7.x86_64 #1 SMP Tue Mar 31 23:36:51 UTC 2020 x86_64 pro01 (none))"
level=info ts=2021-02-20T01:27:13.415Z caller=main.go:411 fd_limits="(soft=1024, hard=4096)"
level=info ts=2021-02-20T01:27:13.415Z caller=main.go:412 vm_limits="(soft=unlimited, hard=unlimited)"
level=info ts=2021-02-20T01:27:13.419Z caller=web.go:532 component=web msg="Start listening for connections" address=0.0.0.0:9090
level=info ts=2021-02-20T01:27:13.420Z caller=main.go:779 msg="Starting TSDB ..."
level=info ts=2021-02-20T01:27:13.420Z caller=repair.go:57 component=tsdb msg="Found healthy block" mint=1613715656312 maxt=1613721600000 ulid=01EYWSF7XTDZVVT2BVARJZBTFA
level=info ts=2021-02-20T01:27:13.420Z caller=repair.go:57 component=tsdb msg="Found healthy block" mint=1613721611311 maxt=1613728800000 ulid=01EYYGGVN4PHHTCFHNKME9FVB4
level=info ts=2021-02-20T01:27:13.424Z caller=tls_config.go:191 component=web msg="TLS is disabled." http2=false
level=info ts=2021-02-20T01:27:13.425Z caller=head.go:668 component=tsdb msg="Replaying on-disk memory mappable chunks if any"
level=info ts=2021-02-20T01:27:13.425Z caller=head.go:682 component=tsdb msg="On-disk memory mappable chunks replay completed" duration=215.709µs
level=info ts=2021-02-20T01:27:13.425Z caller=head.go:688 component=tsdb msg="Replaying WAL, this may take a while"
level=info ts=2021-02-20T01:27:13.433Z caller=head.go:714 component=tsdb msg="WAL checkpoint loaded"
level=info ts=2021-02-20T01:27:13.469Z caller=head.go:740 component=tsdb msg="WAL segment loaded" segment=2 maxSegment=5
level=info ts=2021-02-20T01:27:13.477Z caller=head.go:740 component=tsdb msg="WAL segment loaded" segment=3 maxSegment=5
level=info ts=2021-02-20T01:27:13.479Z caller=head.go:740 component=tsdb msg="WAL segment loaded" segment=4 maxSegment=5
level=info ts=2021-02-20T01:27:13.479Z caller=head.go:740 component=tsdb msg="WAL segment loaded" segment=5 maxSegment=5
level=info ts=2021-02-20T01:27:13.479Z caller=head.go:745 component=tsdb msg="WAL replay completed" checkpoint_replay_duration=7.556609ms wal_replay_duration=46.502062ms total_replay_duration=54.292801ms
level=info ts=2021-02-20T01:27:13.481Z caller=main.go:799 fs_type=XFS_SUPER_MAGIC
level=info ts=2021-02-20T01:27:13.481Z caller=main.go:802 msg="TSDB started"
level=info ts=2021-02-20T01:27:13.481Z caller=main.go:928 msg="Loading configuration file" filename=prometheus.yml
level=info ts=2021-02-20T01:27:13.512Z caller=main.go:959 msg="Completed loading of configuration file" filename=prometheus.yml totalDuration=30.867346ms remote_storage=1.197µs web_handler=357ns query_engine=3.069µs scrape=30.310217ms scrape_sd=136.14µs notify=62.312µs notify_sd=15.155µs rules=4.274µs
level=info ts=2021-02-20T01:27:13.512Z caller=main.go:751 msg="Server is ready to receive web requests."
level=info ts=2021-02-20T01:27:26.336Z caller=compact.go:498 component=tsdb msg="write block resulted in empty block" mint=1613728800000 maxt=1613736000000 duration=19.585124ms
level=info ts=2021-02-20T01:27:26.337Z caller=head.go:847 component=tsdb msg="Head GC completed" duration=1.132169ms
level=info ts=2021-02-20T01:27:26.338Z caller=checkpoint.go:95 component=tsdb msg="Creating checkpoint" from_segment=2 to_segment=3 mint=1613736000000
level=info ts=2021-02-20T01:27:26.364Z caller=head.go:944 component=tsdb msg="WAL checkpoint complete" first=2 last=3 duration=26.464449ms
3、查看9090端口是否存在

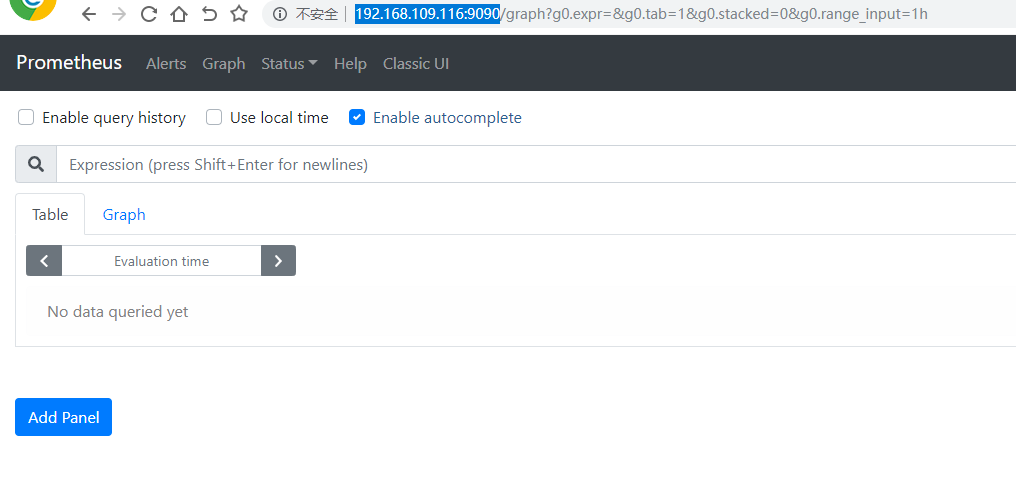
4、在浏览器输入http://192.168.109.116:9090出现如下界面代表安装成功
四、部署node节点
1、下载组件node_exporter到node服务器
[root@pro02 ~]# ll
总用量 9032
-rw-------. 1 root root    1245 1月  11 22:53 anaconda-ks.cfg
-rw-r--r--. 1 root root 9242615 2月  19 15:09 node_exporter-1.1.1.linux-amd64.tar.gz
[root@pro02 ~]# tar xzvf node_exporter-1.1.1.linux-amd64.tar.gz
node_exporter-1.1.1.linux-amd64/
node_exporter-1.1.1.linux-amd64/LICENSE
node_exporter-1.1.1.linux-amd64/NOTICE
node_exporter-1.1.1.linux-amd64/node_exporter
[root@pro02 ~]# mv node_exporter-1.1.1.linux-amd64 /usr/local/node_exporter
[root@pro02 ~]# ll /usr/local/node_exporter/
总用量 18996
-rw-r--r--. 1 3434 3434    11357 2月  13 21:42 LICENSE
-rwxr-xr-x. 1 3434 3434 19170241 2月  13 21:31 node_exporter
-rw-------. 1 root root   134269 2月  20 09:53 nohup.out
-rw-r--r--. 1 3434 3434      463 2月  13 21:42 NOTICE
2、启动node_exporter
[root@pro02 node_exporter]# nohup ./node_exporter &
[1] 16916
3、查看端口9100

4、在Prometheus中加入node节点
# my global config
global:
  scrape_interval:     15s # Set the scrape interval to every 15 seconds. Default is every 1 minute.
  evaluation_interval: 15s # Evaluate rules every 15 seconds. The default is every 1 minute.
  # scrape_timeout is set to the global default (10s).

# Alertmanager configuration
alerting:
  alertmanagers:
  - static_configs:
    - targets:
      # - alertmanager:9093

# Load rules once and periodically evaluate them according to the global 'evaluation_interval'.
rule_files:
  # - "first_rules.yml"
  # - "second_rules.yml"

# A scrape configuration containing exactly one endpoint to scrape:
# Here it's Prometheus itself.
scrape_configs:
  # The job name is added as a label `job=<job_name>` to any timeseries scraped from this config.
  - job_name: 'prometheus'

    # metrics_path defaults to '/metrics'
    # scheme defaults to 'http'.

    static_configs:
    - targets: ['localhost:9090']
  - job_name: 'nodes'
    static_configs:
     - targets:
       - 192.168.109.117:9100 #多个节点以列表形式排列
       - 192.168.109.118:9100
5,重启Prometheus 并在浏览器中查看结果

6,浏览器输入http://192.168.109.117:9100/metrics 查看node exporter展示了prometheus可以拉取的指标,包括在输出中更下方的各种系统指标(带有前缀node_)。要查看这些指标(以及帮助和类型信息)

五、通过PromQL聚合操作验证
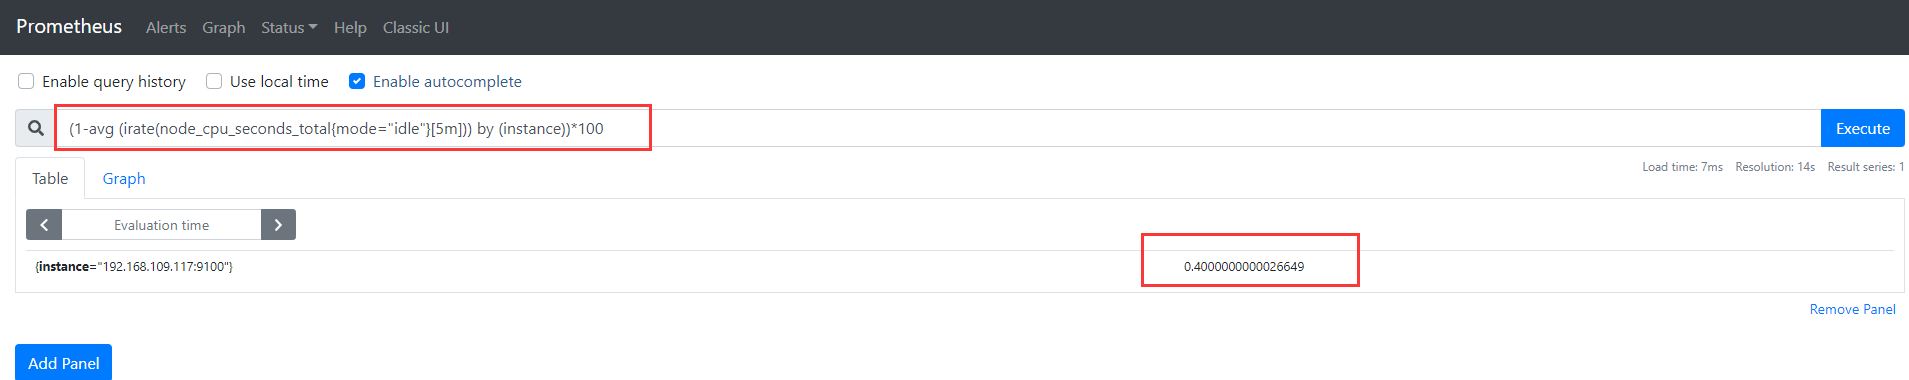
1、node节点机器cpu在5分钟内的平均使用率
(1-avg (irate(node_cpu_seconds_total{mode="idle"}[5m])) by (instance))*100
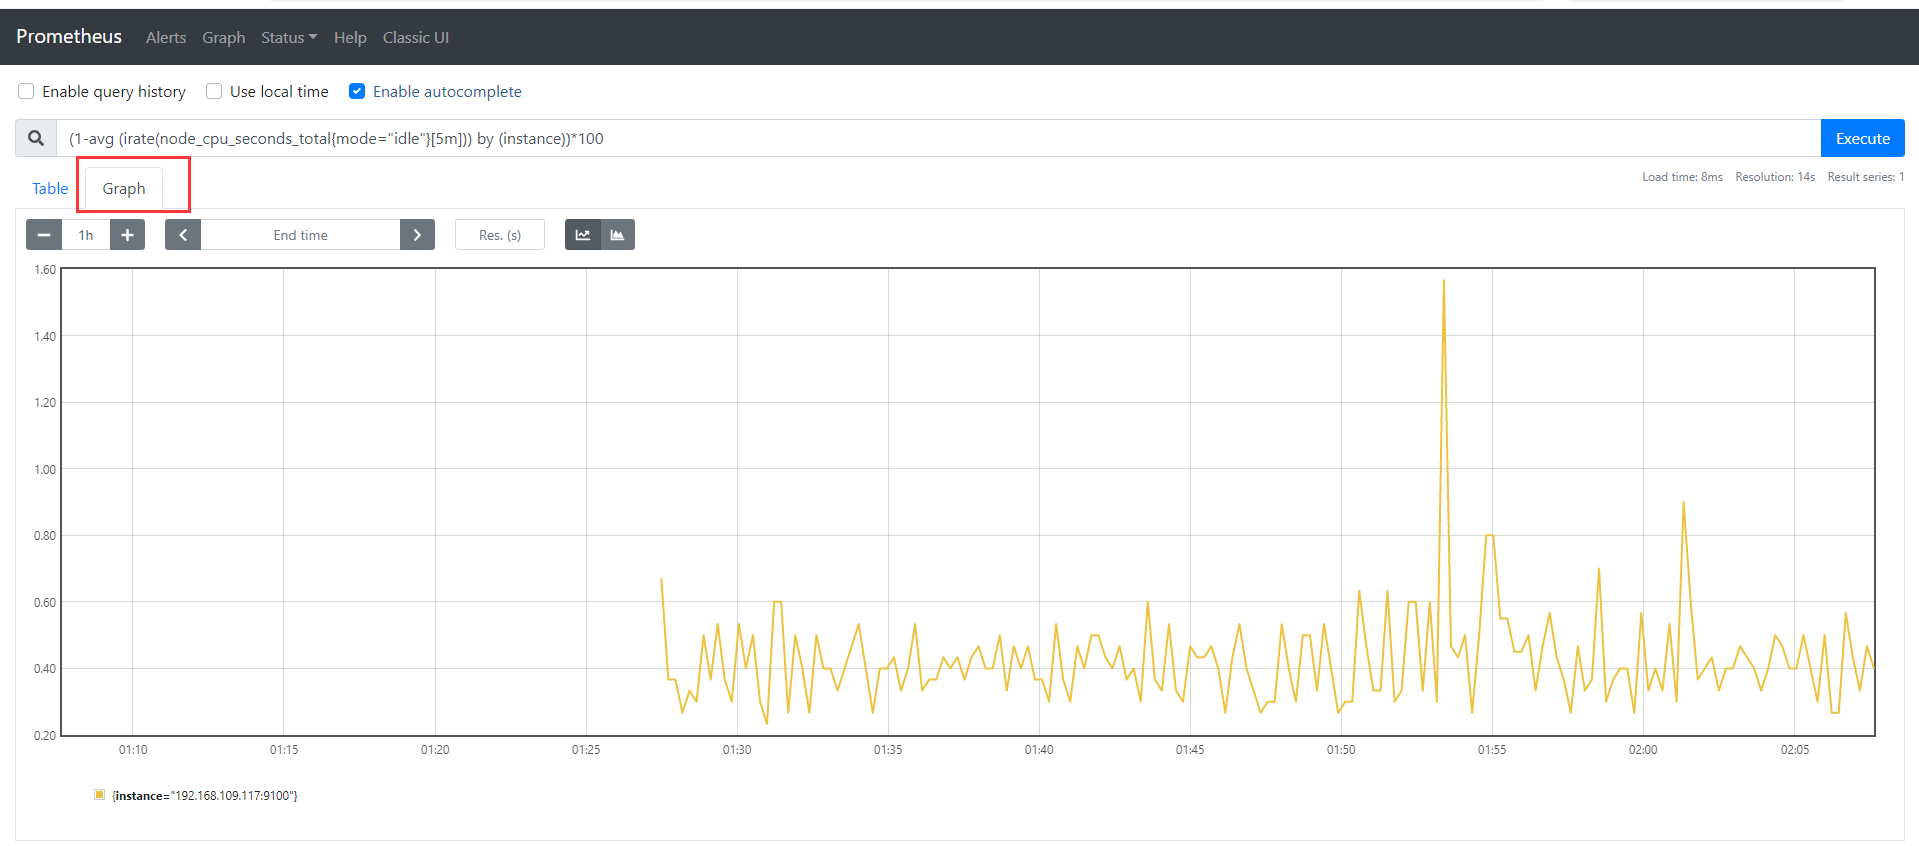
2、绘图
六:基于文件的服务发现
基于文件的服务发现是仅仅优于静态配置的服务发现方式,它不依赖于任何平台或第三方服务,因而也是最简单和通用的实现方式
prometheus Server定期从文件中加载target信息,文件可以使用json和yaml格式,包含定义的target列表以及可选的标签信息
案例:
1、创建目录 mkdir -p /usr/local/prometheus/file-sd/targets 详情如下
[root@pro01 file-sd]# ll
总用量 4
-rw-r--r--. 1 root root 1079 2月  20 16:26 prometheus.yml
drwxr-xr-x. 2 root root   61 2月  20 16:26 targets
[root@pro01 file-sd]# pwd
/usr/local/prometheus/file-sd
[root@pro01 file-sd]# ll targets/
总用量 8
-rw-r--r--. 1 root root 83 2月  20 16:26 nodes-linux.yaml
-rw-r--r--. 1 root root 87 2月  20 16:25 prometheus-servers.yaml
2、编辑prometheus服务启动文件 prometheus.yml
# my global config
global:
  scrape_interval:     15s # Set the scrape interval to every 15 seconds. Default is every 1 minute.
  evaluation_interval: 15s # Evaluate rules every 15 seconds. The default is every 1 minute.
  # scrape_timeout is set to the global default (10s).

# Alertmanager configuration
alerting:
  alertmanagers:
  - static_configs:
    - targets:
      # - alertmanager:9093

# Load rules once and periodically evaluate them according to the global 'evaluation_interval'.
rule_files:
  # - "first_rules.yml"
  # - "second_rules.yml"

# A scrape configuration containing exactly one endpoint to scrape:
# Here it's Prometheus itself.
scrape_configs:
  # The job name is added as a label `job=<job_name>` to any timeseries scraped from this config.
  - job_name: 'prometheus'

    # metrics_path defaults to '/metrics'
    # scheme defaults to 'http'.

    file_sd_configs:
    - files:
      - targets/prometheus-*.yaml
      refresh_interval: 2m
  - job_name: 'nodes' #新增job
    file_sd_configs: #代表使用文件发现功能
    - files:
      - targets/nodes-*.yaml  #加载targets目录下面的所有以nodes开头的yaml文件
      refresh_interval: 2m  #每隔2分钟轮询一次
3、编辑prometheus-servers.yaml文件
- targets:
  - 192.168.109.116:9090
  labels:
    app: parmetheus
    job: parmetheus
4、编辑node节点文件nodes-linux.yaml
- targets:
  - 192.168.109.117:9100
  labels:
    app: node-exporter
    job: node
5、通过指定配置文件方式重启prometheus服务
[root@pro01 prometheus]# ./prometheus --config.file=./file-sd/prometheus.yml
level=info ts=2021-02-20T08:27:34.151Z caller=main.go:366 msg="No time or size retention was set so using the default time retention" duration=15d
level=info ts=2021-02-20T08:27:34.151Z caller=main.go:404 msg="Starting Prometheus" version="(version=2.25.0, branch=HEAD, revision=a6be548dbc17780d562a39c0e4bd0bd4c00ad6e2)"
level=info ts=2021-02-20T08:27:34.151Z caller=main.go:409 build_context="(go=go1.15.8, user=root@615f028225c9, date=20210217-14:17:24)"
level=info ts=2021-02-20T08:27:34.151Z caller=main.go:410 host_details="(Linux 3.10.0-1127.el7.x86_64 #1 SMP Tue Mar 31 23:36:51 UTC 2020 x86_64 pro01 (none))"/6,
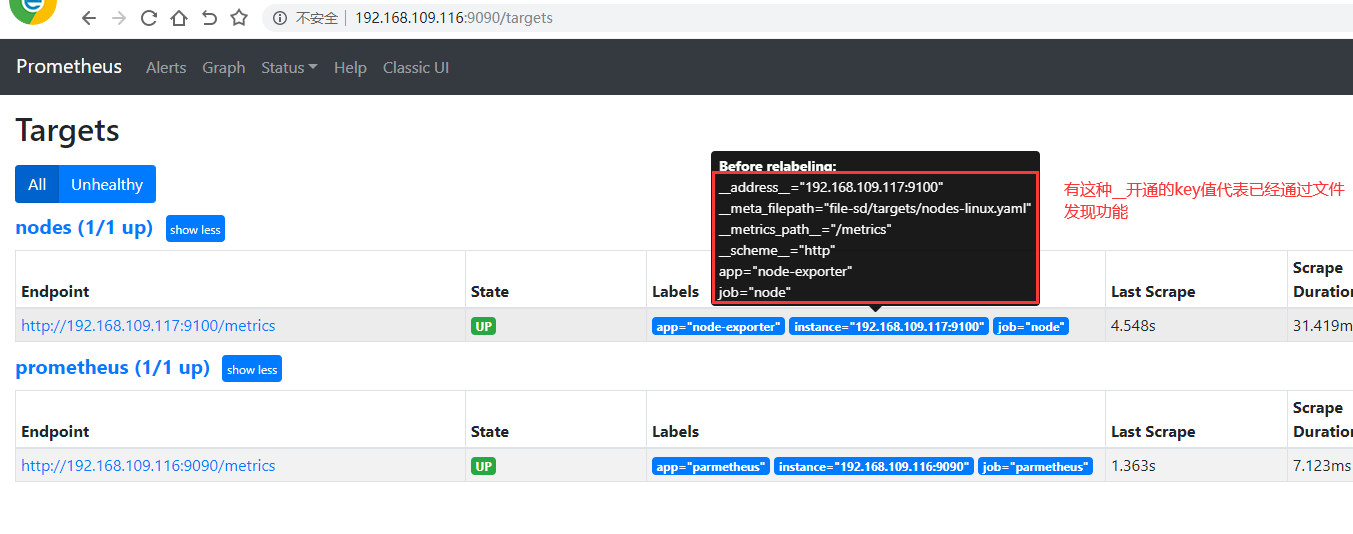
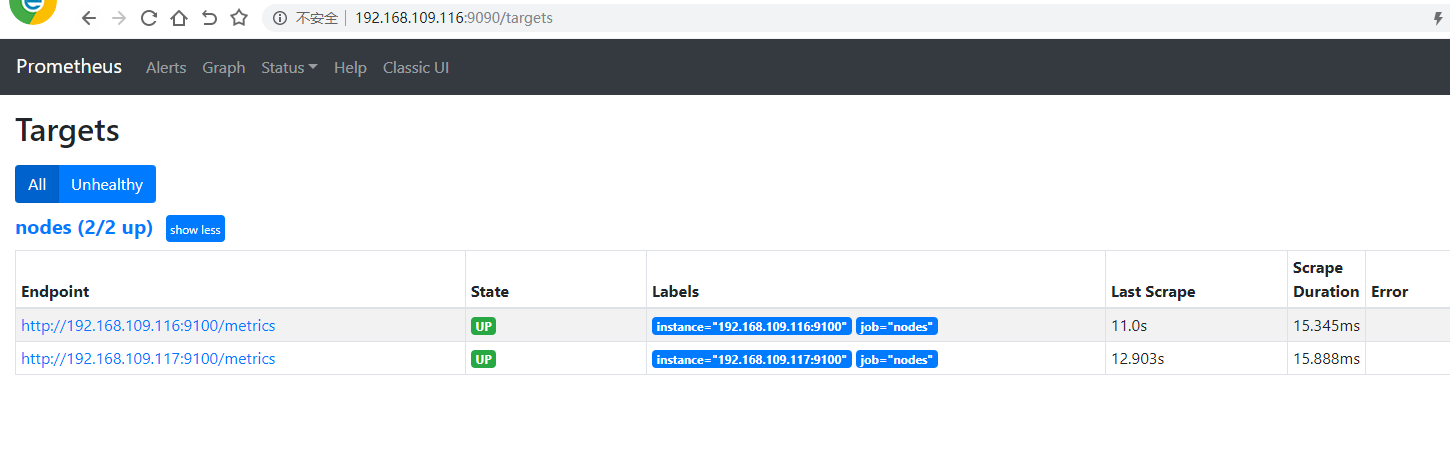
6、验证 浏览器输入http://192.168.109.116:9090/targets
七:基于consul的服务发现
consul简介:
一款基于golang开发的开源工具,面向分布式,服务化的系统提供服务注册,服务发现和配置管理的功能
提供服务注册/发现、健康检查、key/value存储,多数据中心和分布式一致性保证等功能
1,下载地址
https://www.consul.io/downloads
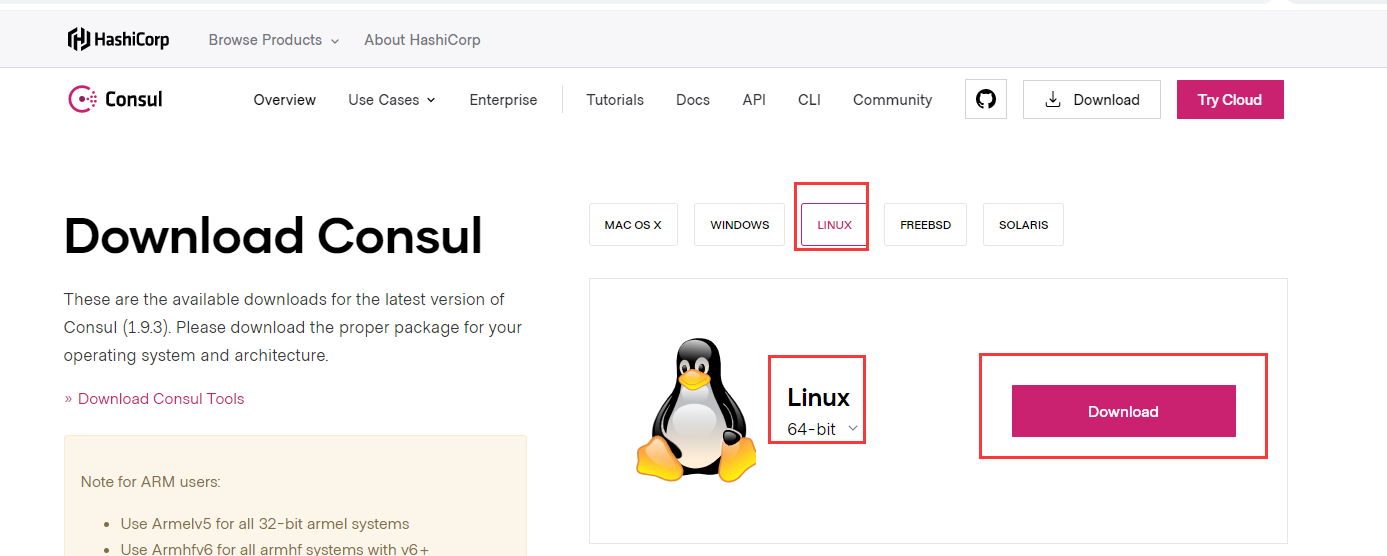
2,安装
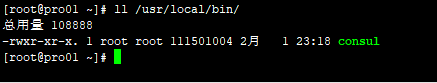
下载的consul_1.9.3_linux_amd64.zip包直接解压到/usr/local/bin 目录
3,服务启动
启动前需要创建数据存储目录和文件加载目录
[root@pro01 ~]# mkdir -p /consul/data/
[root@pro01 ~]# mkdir /etc/consul/
[root@pro01 ~]# ./consul agent -dev -ui -data-dir=/consul/data/ -config-dir=/etc/consul/ -client=0.0.0.0
-bash: ./consul: 没有那个文件或目录
[root@pro01 ~]# consul agent -dev -ui -data-dir=/consul/data/ -config-dir=/etc/consul/ -client=0.0.0.0
==> Starting Consul agent...
           Version: '1.9.3'
           Node ID: '81c2539d-a878-226d-8ee9-d6dffd810238'
         Node name: 'pro01'
        Datacenter: 'dc1' (Segment: '<all>')
            Server: true (Bootstrap: false)
       Client Addr: [0.0.0.0] (HTTP: 8500, HTTPS: -1, gRPC: 8502, DNS: 8600)
      Cluster Addr: 127.0.0.1 (LAN: 8301, WAN: 8302)
           Encrypt: Gossip: false, TLS-Outgoing: false, TLS-Incoming: false, Auto-Encrypt-TLS: false

==> Log data will now stream in as it occurs:
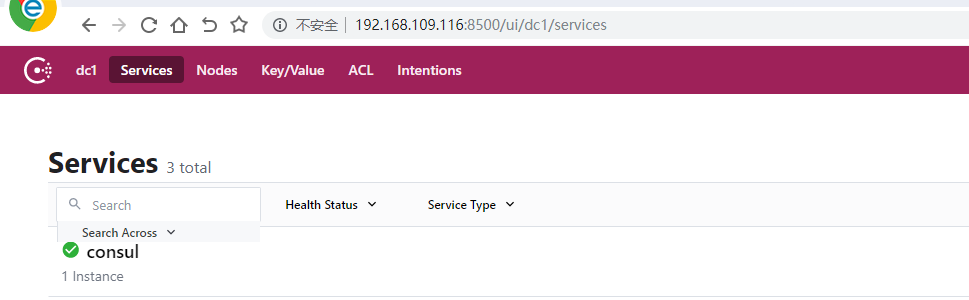
4,在浏览器输入url:http://192.168.109.116:8500/ui 出现如下界面表示安装成功
5,配置通过自发现,发现prometheus node节点
创建prometheus启动加载文件prometheus.yml
# my global config
global:
  scrape_interval:     15s # Set the scrape interval to every 15 seconds. Default is every 1 minute.
  evaluation_interval: 15s # Evaluate rules every 15 seconds. The default is every 1 minute.
  # scrape_timeout is set to the global default (10s).

# Alertmanager configuration
alerting:
  alertmanagers:
  - static_configs:
    - targets:
      # - alertmanager:9093

# Load rules once and periodically evaluate them according to the global 'evaluation_interval'.
rule_files:
  # - "first_rules.yml"
  # - "second_rules.yml"

# A scrape configuration containing exactly one endpoint to scrape:
# Here it's Prometheus itself.
scrape_configs:
  # The job name is added as a label `job=<job_name>` to any timeseries scraped from this config.
  - job_name: 'prometheus'

    # metrics_path defaults to '/metrics'
    # scheme defaults to 'http'.

    consul_sd_configs:
    - server: "192.168.109.116:8500"
      tags:
      - "prometheus"
      refresh_interval: 2m
  - job_name: 'nodes'
    consul_sd_configs: #由file变为consul
    - server: "192.168.109.116:8500"
      tags: #consul通过该tags去自发现
      - "nodes"
      refresh_interval: 2m
创建nodes.json
多个node节点配置如下
{
  "services": [
   {
     "id": "node-exporter-node02",
     "name": "node02",
     "address": "192.168.109.117",
     "port": 9100,
     "tags": ["nodes", "linux"],
      "check": [{
     "http":"http://192.168.109.117:9100/metrics",
         "interval": "5s"
    }]
  },
  {
     "id": "node-exporter-node01",
     "name": "node01",
     "address": "192.168.109.116",
     "port": 9100,
     "tags": ["nodes", "linux"],
      "check": [{
         "http":"http://192.168.109.116:9100/metrics",
         "interval": "5s"
    }]
  }
 ]
}
单个node节点配置如下
{
  "service": {
     "id": "node-exporter-node01",
     "name": "node01",
     "address": "192.168.109.117",
     "port": 9100,
     "tags": ["nodes", "linux"], #该列表需要包含prometheus.yml里面对应的标签
      "check": [{
     "http":"http://192.168.109.117:9100/metrics",
         "interval": "5s"
    }]
  }
}
把nodes.json拷贝到/etc/consul目录下面并重新加载consul服务
[root@pro01 consul]# consul reload
Configuration reload triggered
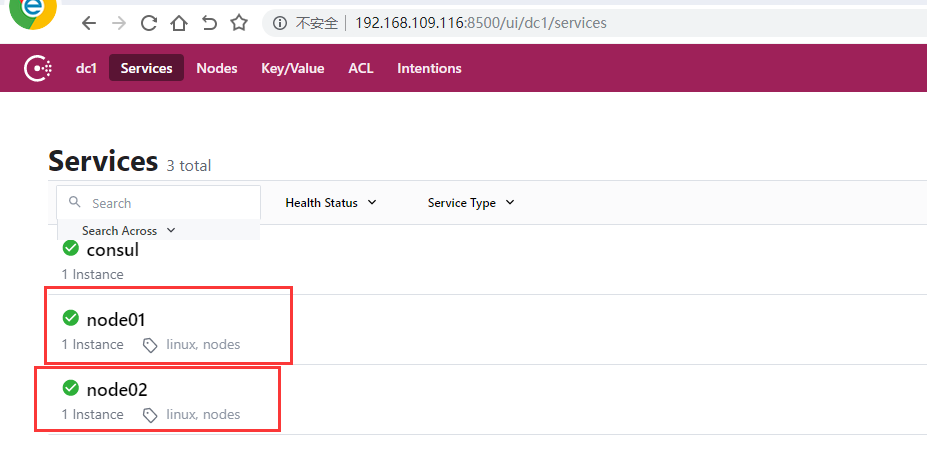
通过web查看
6,启动prometheus
[root@pro01 prometheus]# ./prometheus --config.file=./consul_sd/prometheus.yml
level=info ts=2021-02-23T03:48:36.254Z caller=main.go:366 msg="No time or size retention was set so using the default time retention" duration=15d
level=info ts=2021-02-23T03:48:36.254Z caller=main.go:404 msg="Starting Prometheus" version="(version=2.25.0, branch=HEAD, revision=a6be548dbc17780d562a39c0e4bd0bd4c00ad6e2)"
level=info ts=2021-02-23T03:48:36.254Z caller=main.go:409 build_context="(go=go1.15.8, user=root@615f028225c9, date=20210217-14:17:24)"
level=info ts=2021-02-23T03:48:36.254Z caller=main.go:410 host_details="(Linux 3.10.0-1127.el7.x86_64 #1 SMP Tue Mar 31 23:36:51 UTC 2020 x86_64 pro01 (none))"
level=info ts=2021-02-23T03:48:36.254Z caller=main.go:411 fd_limits="(soft=1024, hard=4096)"
level=info ts=2021-02-23T03:48:36.254Z caller=main.go:412 vm_limits="(soft=unlimited, hard=unlimited)"
level=info ts=2021-02-23T03:48:36.262Z caller=web.go:532 component=web msg="Start listening for connections" address=0.0.0.0:9090
level=info ts=2021-02-23T03:48:36.264Z caller=main.go:779 msg="Starting TSDB ..."
浏览器输入http://192.168.109.116:9090 查看
八:部署grafana
1,下载包
通过地址https://mirrors.bfsu.edu.cn/grafana/yum/rpm/下载最新的grafana的rpm包

2,部署
执行安装命令
[root@pro01 ~]# yum install -y grafana-7.4.2-1.x86_64.rpm
查看安装的grafana包
[root@pro01 ~]# rpm -ql grafana
默认配置grafana.ini保持默认不需要更改
[root@pro01 grafana]# pwd
/etc/grafana
[root@pro01 grafana]# ll
总用量 40
-rw-r-----. 1 root grafana 33410 2月  23 13:50 grafana.ini
-rw-r-----. 1 root grafana  2270 2月  23 13:50 ldap.toml
drwxr-xr-x. 6 root grafana    75 2月  23 13:50 provisioning
启动grafana
[root@pro01 ~]# systemctl start grafana-server
查看端口默认3000
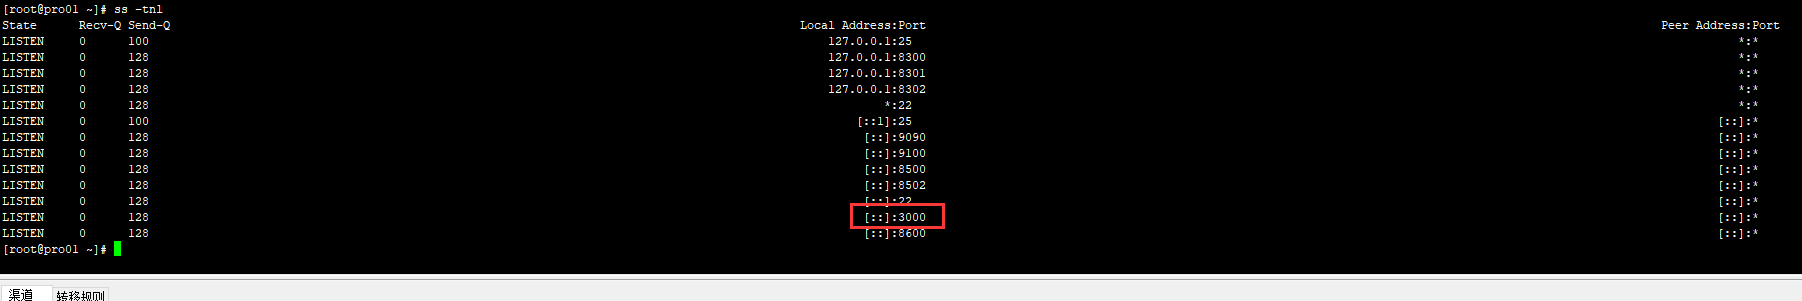
3,登陆
浏览器访问:http://192.168.109.116:3000
默认账密admin/admin 初次登陆需要修改密码

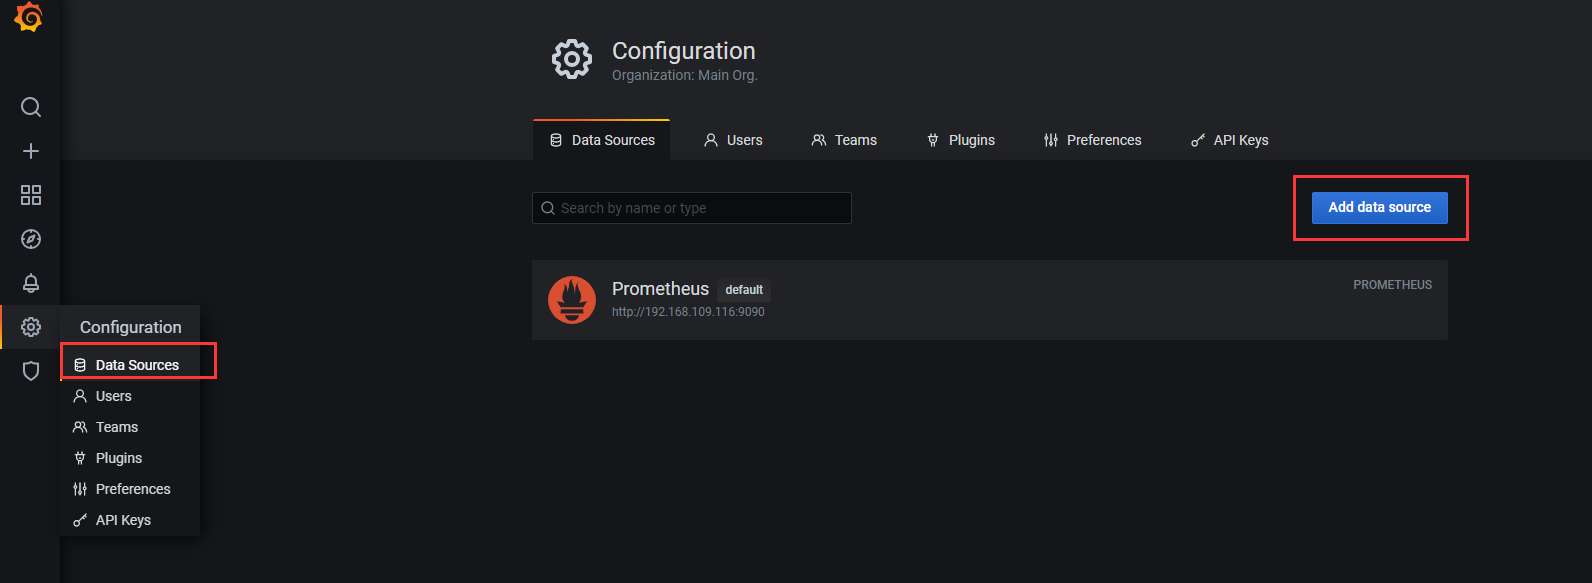
4,添加数据源
5,导入grafana的dashboards模板
官网地址:https://grafana.com/grafana/dashboards?dataSource=prometheus&search=node
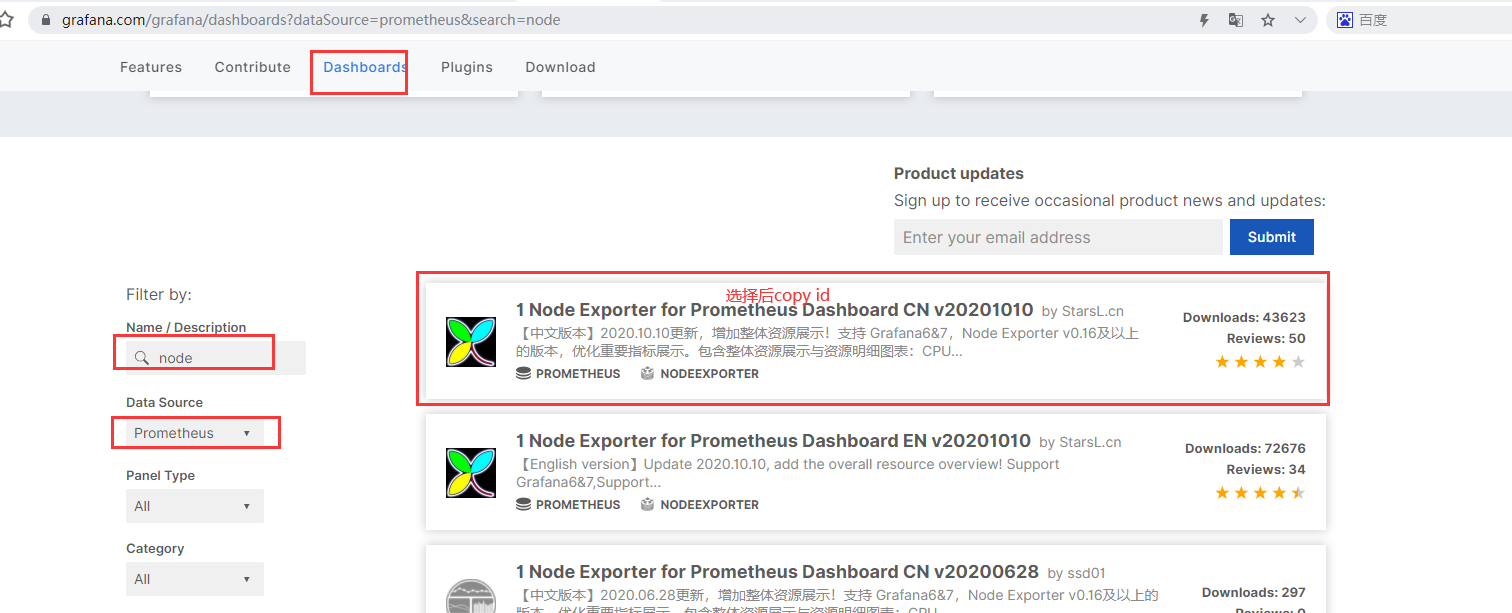
在grafana中粘贴id会自动联网下载模板


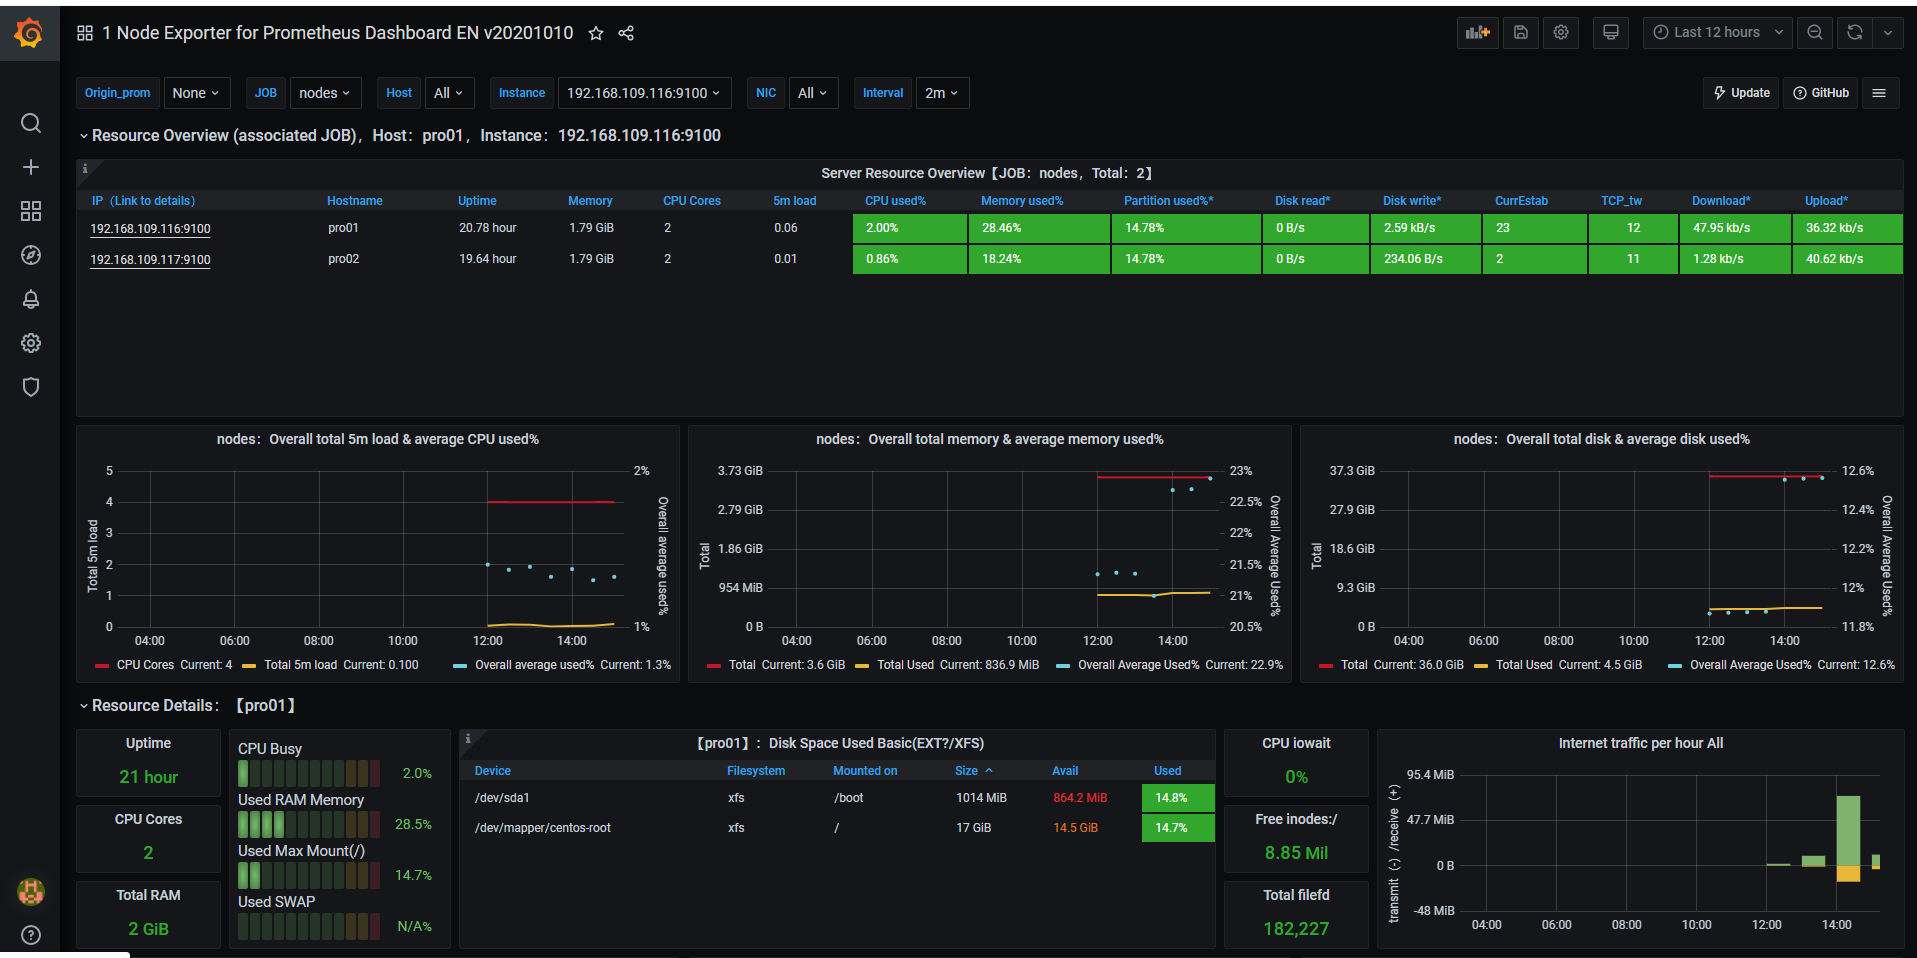
应用模板
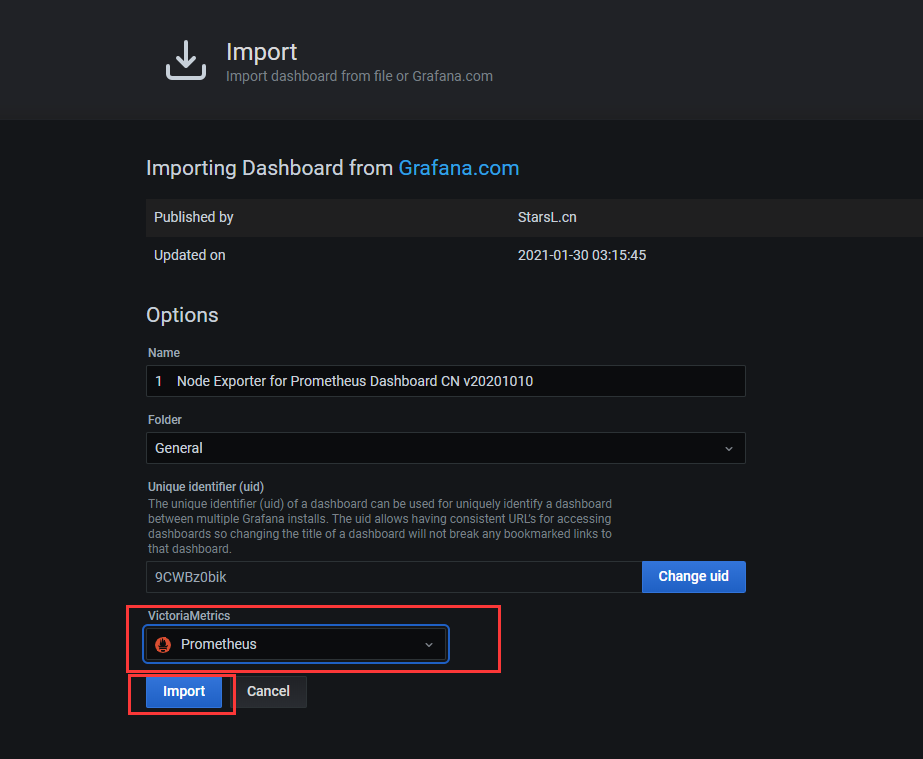
模板里面的panel会根据node节点采集到的数据进行自动填充
九:邮件告警
1、安装alertmanager
下载地址https://prometheus.io/download/
下载最新包alertmanager-0.21.0.linux-amd64.tar.gz
解压修改配置文件既可使用:
[root@pro01 local]# cd alertmanager/
[root@pro01 alertmanager]# ll
总用量 51648
-rwxr-xr-x. 1 3434 3434 28871879 6月  17 2020 alertmanager
-rw-r--r--. 1 root root      659 2月  26 17:38 alertmanager.yml
-rw-r--r--. 1 3434 3434      380 6月  17 2020 alertmanager.ymlbak
-rwxr-xr-x. 1 3434 3434 23987848 6月  17 2020 amtool
drwxr-xr-x. 2 root root       35 3月   1 21:17 data
-rw-r--r--. 1 3434 3434    11357 6月  17 2020 LICENSE
-rw-r--r--. 1 3434 3434      457 6月  17 2020 NOTICE
[root@pro01 alertmanager]#
2,编写邮件告警外发文件
[root@pro01 alertmanager]# pwd
/usr/local/alertmanager
[root@pro01 alertmanager]# cat alertmanager.yml
global:
  resolve_timeout: 5m

route:
  group_by: ['alertname']
  group_wait: 10s
  group_interval: 30s
  repeat_interval: 1h
  receiver: 'email-me'
receivers:
- name: 'email-me'
  email_configs:
  - to: 'wangxu13968@hundsun.com'
    from: 'hanxn@hundsun.cn'
    smarthost: 'smtp.hundsun.cn:80'
    auth_username: 'hanxn@hundsun.cn'
    auth_identity: 'hanxn@hundsun.cn'
    auth_password: 'GoodBoy123'
    require_tls: false
  #- url: 'http://127.0.0.1:5001/'
inhibit_rules:  #告警抑制机制,避免同类告警多次发送
  - source_match: #原告警内容
      alertname: 'InstanceDown'
      severity: 'critical'
    target_match: #新告警 和 原告警比较需要满足的条件
      alertname: 'InstanceDown'
      severity: 'critical'
    equal: #标签值相等
      - instance
3,启动alertmanager服务
 #默认加载alertmanager.yml
[root@pro01 alertmanager]# ./alertmanager
level=info ts=2021-03-01T12:47:59.005Z caller=main.go:216 msg="Starting Alertmanager" version="(version=0.21.0, branch=HEAD, revision=4c6c03ebfe21009c546e4d1e9b92c371d67c021d)"
level=info ts=2021-03-01T12:47:59.005Z caller=main.go:217 build_context="(go=go1.14.4, user=root@dee35927357f, date=20200617-08:54:02)"
level=info ts=2021-03-01T12:47:59.007Z caller=cluster.go:161 component=cluster msg="setting advertise address explicitly" addr=192.168.109.116 port=9094
level=info ts=2021-03-01T12:47:59.013Z caller=cluster.go:623 component=cluster msg="Waiting for gossip to settle..." interval=2s
level=info ts=2021-03-01T12:47:59.077Z caller=coordinator.go:119 component=configuration msg="Loading configuration file" file=alertmanager.yml
level=info ts=2021-03-01T12:47:59.078Z caller=coordinator.go:131 component=configuration msg="Completed loading of configuration file" file=alertmanager.yml
level=info ts=2021-03-01T12:47:59.084Z caller=main.go:485 msg=Listening address=:9093
level=info ts=2021-03-01T12:48:01.013Z caller=cluster.go:648 component=cluster msg="gossip not settled" polls=0 before=0 now=1 elapsed=2.000454316s
level=info ts=2021-03-01T12:48:09.015Z caller=cluster.go:640 component=cluster msg="gossip settled; proceeding" elapsed=10.001984594s
4,编辑Prometheus启动文件
[root@pro01 alter-config]# cat prometheus.yml
# my global config
global:
  scrape_interval:     15s # Set the scrape interval to every 15 seconds. Default is every 1 minute.
  evaluation_interval: 15s # Evaluate rules every 15 seconds. The default is every 1 minute.
  # scrape_timeout is set to the global default (10s).

# Alertmanager configuration
alerting:
  alertmanagers:
  - file_sd_configs:
    - files:
      - "targets/alertmanagers*.yaml"  #基于文件发现规则,将告警内容对接可以发送告警信息的alertmanager
      # - alertmanager:9093

# Load rules once and periodically evaluate them according to the global 'evaluation_interval'.
rule_files:
  # - "first_rules.yml"
  # - "second_rules.yml"
  #- "rules/*.yaml"
  - "alert_rules/*.yaml"   #指向告警规则

# A scrape configuration containing exactly one endpoint to scrape:
# Here it's Prometheus itself.
scrape_configs:
  # The job name is added as a label `job=<job_name>` to any timeseries scraped from this config.
  - job_name: 'prometheus'

    # metrics_path defaults to '/metrics'
    # scheme defaults to 'http'.

    file_sd_configs:
    - files:
      - targets/prometheus-*.yaml
      refresh_interval: 2m
  - job_name: 'nodes'
    file_sd_configs:
    - files:
      - targets/nodes-*.yaml
      refresh_interval: 2m
  - job_name: 'alertmanager'
    file_sd_configs:
    - files:
      - targets/alertmanagers*.yaml
      refresh_interval: 2m
5,定义alertmanager.yaml文件
[root@localhost targets]# cat alertmanager.yaml
- targets:
  - 192.168.101.116:9093
  labels:
    app: alertmanager
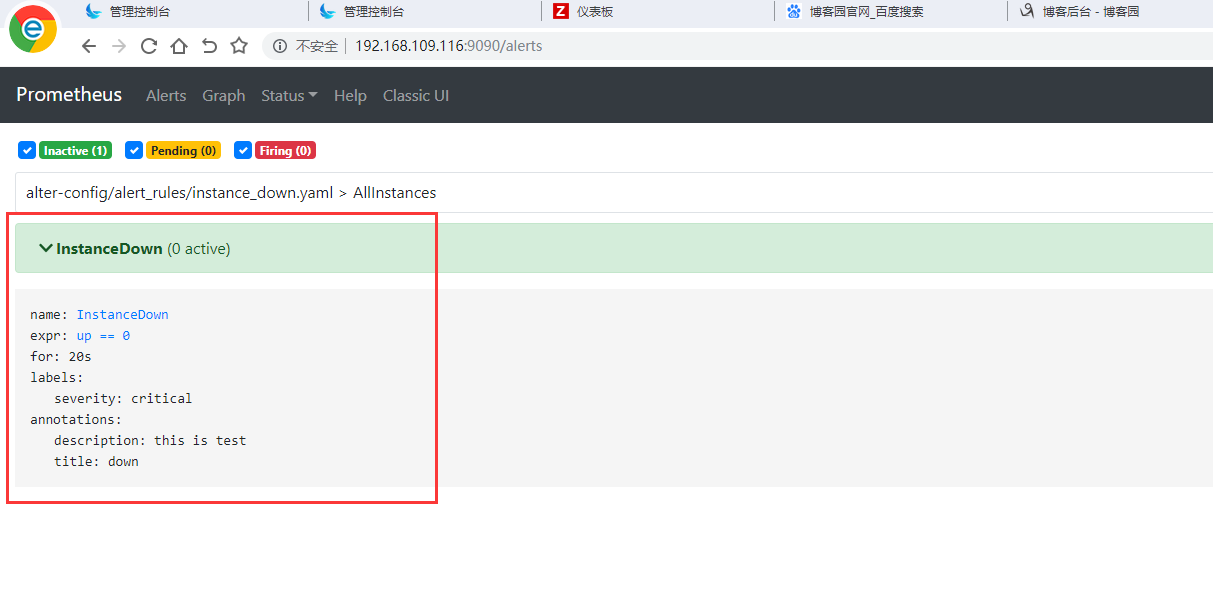
6,自定义告警规则
[root@pro01 alter-config]# cat alert_rules/instance_down.yaml
groups:
- name: AllInstances
  rules:
  - alert: InstanceDown
    expr: up == 0
    for: 20s  #表示延迟20秒告警
    annotations:
      title: 'down'
      description: this is test
    labels:
      severity: 'critical'
在告警规则文件中,我们可以将一组相关的规则设置定义在一个group下。在每一个group中我们可以定义多个告警规则(rule)。一条告警规则主要由以下几部分组成:
-
alert:告警规则的名称。
-
expr:基于PromQL表达式告警触发条件,用于计算是否有时间序列满足该条件。
cpu5分钟负载:avg(irate(node_cpu_seconds_total{mode="idle"}[5m])) by (instance)
cpu 使用率: 100 - ((avg(irate(node_cpu_seconds_total{mode="idle"}[5m])) by (instance)) * 100)
-
for:评估等待时间,可选参数。用于表示只有当触发条件持续一段时间后才发送告警。在等待期间新产生告警的状态为pending。
-
labels:自定义标签,允许用户指定要附加到告警上的一组附加标签。
-
annotations:用于指定一组附加信息,比如用于描述告警详细信息的文字等,annotations的内容在告警产生时会一同作为参数发送到Alertmanager。
7,启动Prometheus
[root@pro01 prometheus]# ./prometheus --config.file=./alter-config/prometheus.yml
level=info ts=2021-03-01T12:55:35.388Z caller=main.go:366 msg="No time or size retention was set so using the default time retention" duration=15d
level=info ts=2021-03-01T12:55:35.388Z caller=main.go:404 msg="Starting Prometheus" version="(version=2.25.0, branch=HEAD, revision=a6be548dbc17780d562a39c0e4bd0bd4c00ad6e2)"
level=info ts=2021-03-01T12:55:35.388Z caller=main.go:409 build_context="(go=go1.15.8, user=root@615f028225c9, date=20210217-14:17:24)"
level=info ts=2021-03-01T12:55:35.388Z caller=main.go:410 host_details="(Linux 3.10.0-1127.el7.x86_64 #1 SMP Tue Mar 31 23:36:51 UTC 2020 x86_64 pro01 (none))"
level=info ts=2021-03-01T12:55:35.388Z caller=main.go:411 fd_limits="(soft=1024, hard=4096)"
level=info ts=2021-03-01T12:55:35.388Z caller=main.go:412 vm_limits="(soft=unlimited, hard=unlimited)"
level=info ts=2021-03-01T12:55:35.393Z caller=web.go:532 component=web msg="Start listening for connections" address=0.0.0.0:9090
level=info ts=2021-03-01T12:55:35.395Z caller=main.go:779 msg="Starting TSDB ..."
7,通过web查看

十:设置钉钉机器人告警
1,首先需要创建一个钉钉项目组 添加自定义钉钉机器人获取Webhook和secret

2,安装prometheus-webhook-dingtalk
下载dingtalk
wget https://github.com/timonwong/prometheus-webhook-dingtalk/releases/download/v1.4.0/prometheus-webhook-dingtalk-1.4.0.linux-amd64.tar.gz
解压后修改配置文件config.yml
## Request timeout
# timeout: 5s

## Customizable templates path
# templates:
#   - contrib/templates/legacy/template.tmpl

## You can also override default template using `default_message`
## The following example to use the 'legacy' template from v0.3.0
default_message: #告警模板 可网上下载
   title: '{{ template "legacy.title" . }}'
   text: '{{ template "legacy.content" . }}'

## Targets, previously was known as "profiles"
targets:
  webhook1:
    url: https://oapi.dingtalk.com/robot/send?access_token=c74358f6bb9da11cb9f119980f8945de3a0838d0480eb8db085412f2f754eb4a  #通过钉钉机器人上面获取
    # secret for signature
    secret: SEC47b20c9b8a1cce4fe542ceb3352ee3420ca6b0eed67736e75e3ac6c96c0573ef
3,启动dingtalk
[root@pro01 prometheus-webhook-dingtalk]# ./prometheus-webhook-dingtalk
level=info ts=2021-03-02T03:04:40.903Z caller=main.go:62 msg="Starting prometheus-webhook-dingtalk" version="(version=1.4.0, branch=HEAD, revision=02fe8265a98ab4caaa78ebbed209d3f06b87b4a6)"
level=info ts=2021-03-02T03:04:40.903Z caller=main.go:63 msg="Build context" (gogo1.13.5,userroot@eb9f8d8f0437,date20191211-03:00:38)=(MISSING)
level=info ts=2021-03-02T03:04:40.903Z caller=coordinator.go:89 component=configuration file=config.yml msg="Loading configuration file"
level=info ts=2021-03-02T03:04:40.905Z caller=coordinator.go:97 component=configuration file=config.yml msg="Completed loading of configuration file"
level=info ts=2021-03-02T03:04:40.905Z caller=main.go:117 component=configuration msg="Loading templates" templates=
ts=2021-03-02T03:04:40.907Z caller=main.go:133 component=configuration msg="Webhook urls for prometheus alertmanager" urls="http://localhost:8060/dingtalk/webhook_mention_users/send http://localhost:8060/dingtalk/webhook1/send http://localhost:8060/dingtalk/webhook2/send http://localhost:8060/dingtalk/webhook_legacy/send http://localhost:8060/dingtalk/webhook_mention_all/send"
level=info ts=2021-03-02T03:04:40.908Z caller=web.go:210 component=web msg="Start listening for connections" address=:8060
4,编辑dingtalk的alertmanager配置文件alertmanager.yml
[root@pro01 alertmanager]# pwd
/usr/local/alertmanager
[root@pro01 alertmanager]# cat alertmanager.yml
global:
  resolve_timeout: 5m

route:
  group_by: ['alertname']
  group_wait: 10s
  group_interval: 30s
  repeat_interval: 1h
  receiver: 'dingding.webhook1'
  routes:
  - receiver: 'dingding.webhook1'  #webhook1名字要对应dingtak配置文件的targets值
    match:
      team: devops
    group_wait: 10s
    group_interval: 15s
    repeat_interval: 3h
receivers:
- name: 'dingding.webhook1'
  webhook_configs:
  - url: 'http://192.168.109.116:8060/dingtalk/webhook1/send'  #请求地址
    send_resolved: true
5,启动alertmanager
[root@pro01 alertmanager]# ./alertmanager
level=info ts=2021-03-02T03:04:58.367Z caller=main.go:216 msg="Starting Alertmanager" version="(version=0.21.0, branch=HEAD, revision=4c6c03ebfe21009c546e4d1e9b92c371d67c021d)"
level=info ts=2021-03-02T03:04:58.367Z caller=main.go:217 build_context="(go=go1.14.4, user=root@dee35927357f, date=20200617-08:54:02)"
level=info ts=2021-03-02T03:04:58.369Z caller=cluster.go:161 component=cluster msg="setting advertise address explicitly" addr=192.168.109.116 port=9094
level=info ts=2021-03-02T03:04:58.375Z caller=cluster.go:623 component=cluster msg="Waiting for gossip to settle..." interval=2s
level=info ts=2021-03-02T03:04:58.428Z caller=coordinator.go:119 component=configuration msg="Loading configuration file" file=alertmanager.yml
level=info ts=2021-03-02T03:04:58.432Z caller=coordinator.go:131 component=configuration msg="Completed loading of configuration file" file=alertmanager.yml
level=info ts=2021-03-02T03:04:58.436Z caller=main.go:485 msg=Listening address=:9093
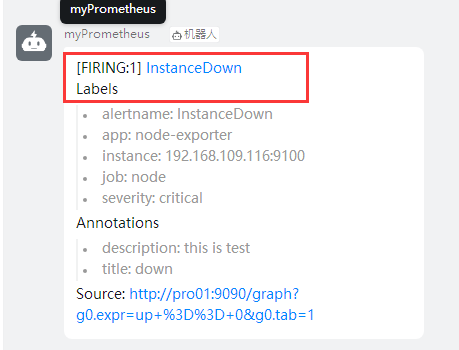
6,验证 kill一个node节点的node_exporter进程,查看dingtalk日志
level=info ts=2021-03-02T03:07:16.459Z caller=entry.go:22 component=web http_scheme=http http_proto=HTTP/1.1 http_method=POST remote_addr=192.168.109.116:55402 user_agent=Alertmanager/0.21.0 uri=http://192.168.109.116:8060/dingtalk/webhook1/send resp_status=200 resp_bytes_length=2 resp_elapsed_ms=285.121773 msg="request complete"
查看钉钉机器人告警输出
告警恢复