一、安装Prometheus Server
Prometheus基于Golang编写,编译后的软件包,不依赖于任何的第三方依赖。用户只需要下载对应平台的二进制包,解压并且添加基本的配置即可正常启动Prometheus Server。
从二进制包安装
对于非Docker用户,可以从https://prometheus.io/download/找到最新版本的Prometheus Sevrer软件包:
export VERSION=2.6.1
curl -LO https://github.com/prometheus/prometheus/releases/download/v$VERSION/prometheus-$VERSION.darwin-amd64.
tar.gz
将压缩包进行解压
tar -xzf prometheus-${VERSION}.darwin-amd64.tar.gz
mv prometheus-2.6.1.linux-amd64 prometheus-2.6.1
cd prometheus-2.6.1
解压后当前目录会包含默认的Prometheus配置文件promethes.yaml:
# my global config
global:
scrape_interval: 15s # Set the scrape interval to every 15 seconds. Default is every 1 minute.
evaluation_interval: 15s # Evaluate rules every 15 seconds. The default is every 1 minute.
# scrape_timeout is set to the global default (10s).
# Alertmanager configuration
alerting:
alertmanagers:
- static_configs:
- targets:
# - alertmanager:9093
# Load rules once and periodically evaluate them according to the global 'evaluation_interval'.
rule_files:
# - "first_rules.yml"
# - "second_rules.yml"
# A scrape configuration containing exactly one endpoint to scrape:
# Here it's Prometheus itself.
scrape_configs:
# The job name is added as a label `job=<job_name>` to any timeseries scraped from this config.
- job_name: 'prometheus'
# metrics_path defaults to '/metrics'
# scheme defaults to 'http'.
static_configs:
- targets: ['localhost:9090']
Promtheus作为一个时间序列数据库,其采集的数据会以文件的形似存储在本地中,默认的存储路径为 data/ ,因此我们需要先手动创建该目录:
mkdir -p data
用户也可以通过参数--storage.tsdb.path="data/"修改本地数据存储的路径。
启动prometheus服务,其会默认加载当前路径下的prometheus.yaml文件:
./prometheus --config.file=prometheus.yaml
正常的情况下,你可以看到以下输出内容:
level=info ts=2023-03-15T13:44:41.97916738Z caller=main.go:243 msg="Starting Prometheus" version="(version=2.6.1, branch=HEAD, revision=b639fe140c1f71b2cbad3fc322b17efe60839e7e)"
level=info ts=2023-03-15T13:44:41.979234185Z caller=main.go:244 build_context="(go=go1.11.4, user=root@4c0e286fe2b3, date=20190115-19:12:04)"
level=info ts=2023-03-15T13:44:41.979249082Z caller=main.go:245 host_details="(Linux 3.10.0-957.el7.x86_64 #1 SMP Thu Nov 8 23:39:32 UTC 2018 x86_64 192.168.14.131 (none))"
level=info ts=2023-03-15T13:44:41.979264211Z caller=main.go:246 fd_limits="(soft=65536, hard=131072)"
level=info ts=2023-03-15T13:44:41.979275887Z caller=main.go:247 vm_limits="(soft=unlimited, hard=unlimited)"
level=info ts=2023-03-15T13:44:41.988649378Z caller=main.go:561 msg="Starting TSDB ..."
level=info ts=2023-03-15T13:44:41.999683641Z caller=main.go:571 msg="TSDB started"
level=info ts=2023-03-15T13:44:42.000153492Z caller=main.go:631 msg="Loading configuration file" filename=prometheus.yml
level=info ts=2023-03-15T13:44:42.001185315Z caller=main.go:657 msg="Completed loading of configuration file" filename=prometheus.yml
level=info ts=2023-03-15T13:44:42.00120151Z caller=main.go:530 msg="Server is ready to receive web requests."
level=info ts=2023-03-15T13:44:42.001808404Z caller=web.go:429 component=web msg="Start listening for connections" address=0.0.0.0:9090
使用容器安装
对于Docker用户,直接使用Prometheus的镜像即可启动Prometheus Server:
docker run -p 9090:9090 -v /etc/prometheus/prometheus.yml:/etc/prometheus/prometheus.yml prom/prometheus
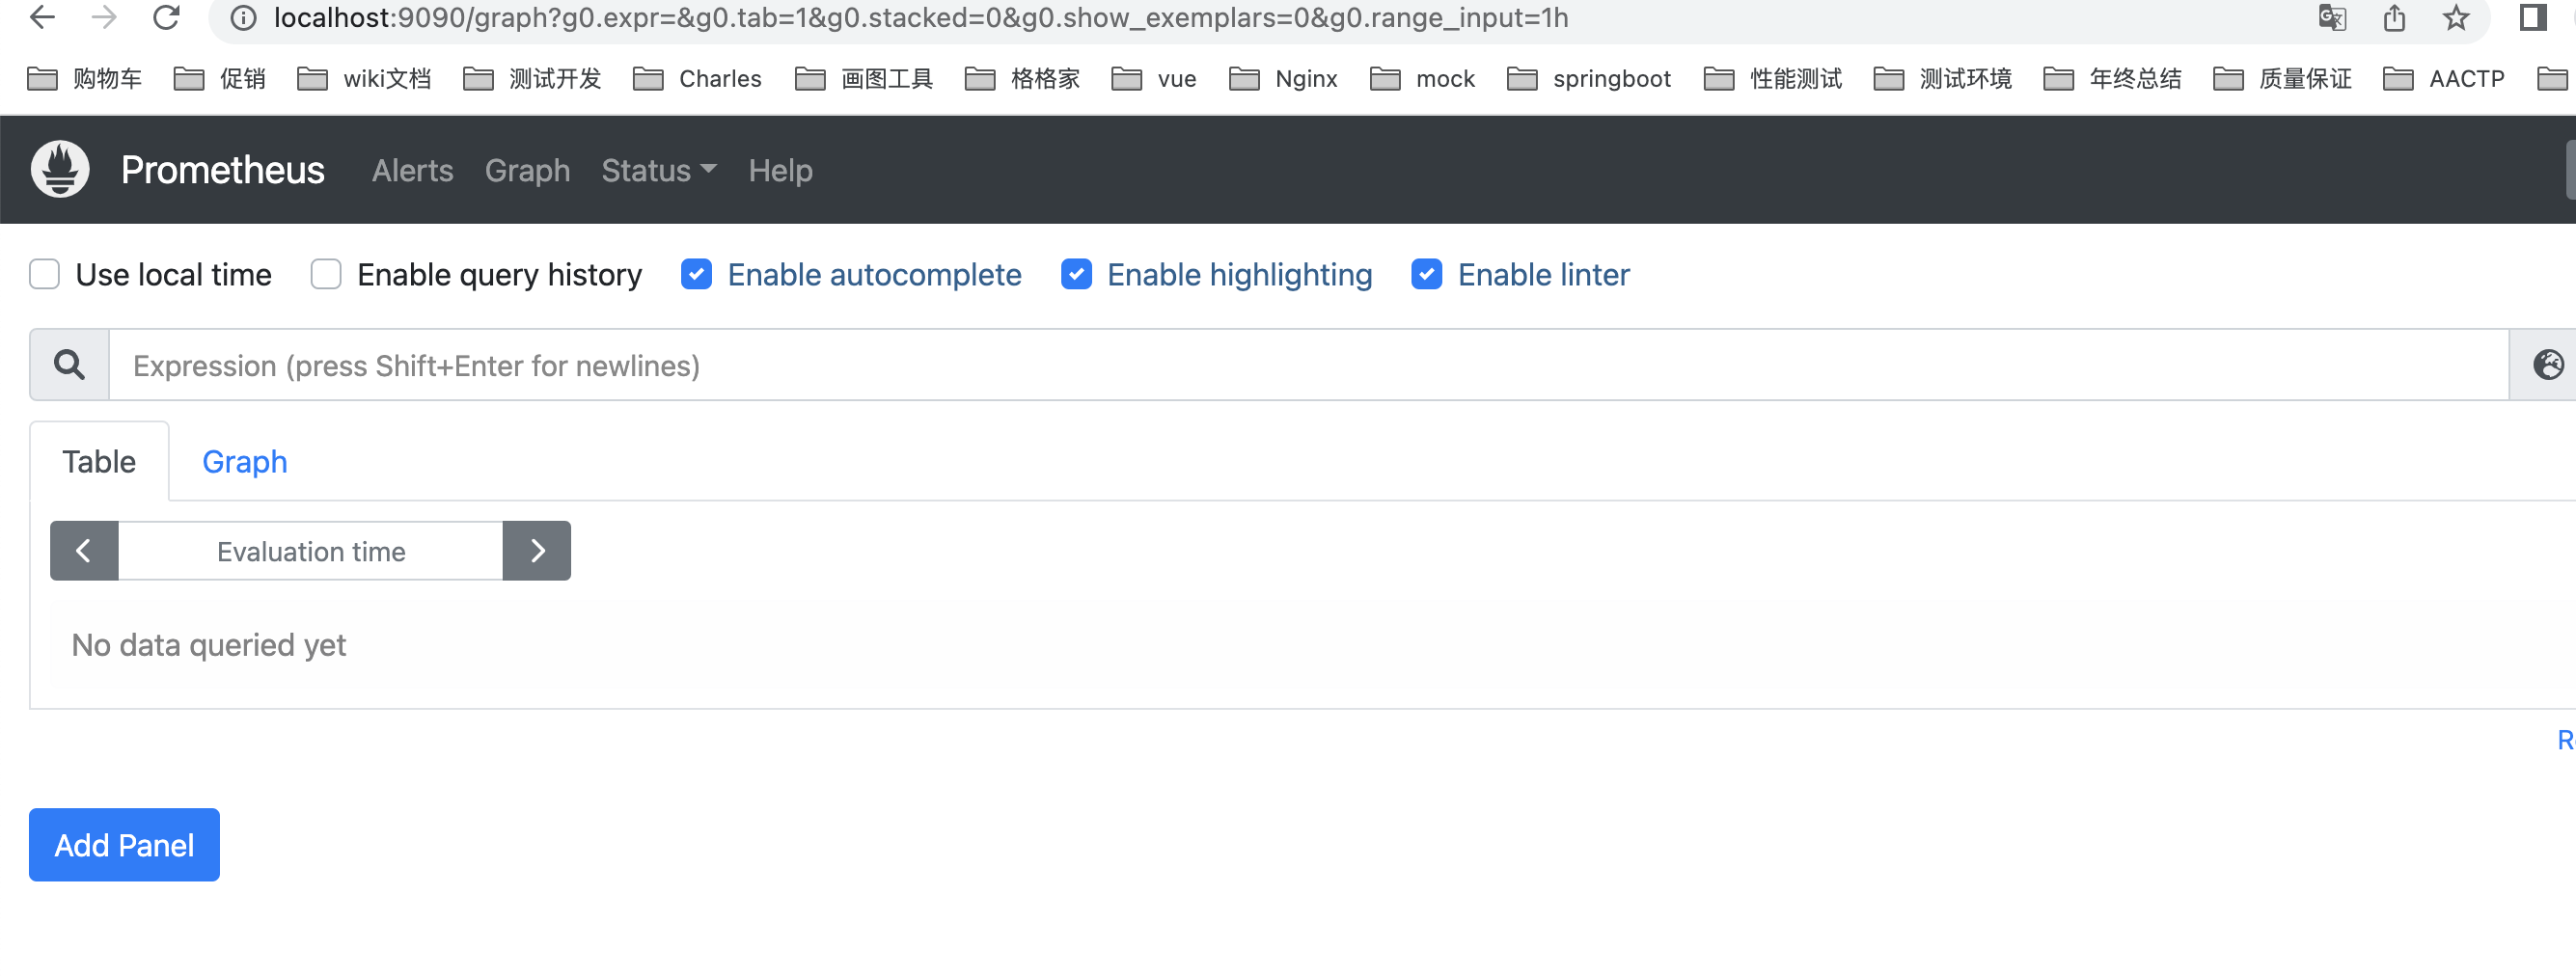
启动完成后,可以通过http://localhost:9090访问Prometheus的UI界面:
使用容器安装
对于Docker用户,直接使用Prometheus的镜像即可启动Prometheus Server:
docker run -p 9090:9090 -v /etc/prometheus/prometheus.yml:/etc/prometheus/prometheus.yml prom/prometheus
启动完成后,可以通过http://localhost:9090访问Prometheus的UI界面: