Hystrix提供了一个可视化的监测工具,可以用来实时监测和查看Hystrix断路器的状态和指标。该工具称为Hystrix Dashboard。
使用Hystrix Dashboard可以将应用程序的Hystrix数据以图形化界面的形式展示,包括线程池、请求统计和熔断器等信息,从而更直观地了解和分析系统的性能和稳定性。
下面是使用Hystrix Dashboard进行可视化监测的一般步骤:
一、添加依赖:
在项目的pom.xml文件中添加Hystrix Dashboard的依赖。


1 <dependency>
2     <groupId>org.springframework.cloud</groupId>
3     <artifactId>spring-cloud-starter-netflix-hystrix-dashboard</artifactId>
4 </dependency>
二、配置启用Hystrix Dashboard
在启动类上使用@EnableHystrixDashboard注解来启用Hystrix Dashboard。
 1 import com.netflix.hystrix.contrib.metrics.eventstream.HystrixMetricsStreamServlet;
 2 import org.springframework.boot.SpringApplication;
 3 import org.springframework.boot.autoconfigure.SpringBootApplication;
 4 import org.springframework.boot.web.servlet.ServletRegistrationBean;
 5 import org.springframework.cloud.client.circuitbreaker.EnableCircuitBreaker;
 6 import org.springframework.cloud.netflix.hystrix.EnableHystrix;
 7 import org.springframework.cloud.netflix.hystrix.dashboard.EnableHystrixDashboard;
 8 import org.springframework.cloud.openfeign.EnableFeignClients;
 9 import org.springframework.context.annotation.Bean;
10
11 /**
12  * @Classname HystrixApplication
13  * @Created by Michael
14  * @Date 2023/7/17
15  * @Description 服务降级
16  */
17 @SpringBootApplication
18 @EnableFeignClients
19 //@EnableHystrix
20 @EnableCircuitBreaker
21 @EnableHystrixDashboard
22 public class HystrixApplication {
23   /**
24    * 启用hystrix的/actuator/hystrix.stream地址映射
25    * @return
26    */
27   @Bean
28   public ServletRegistrationBean getServlet(){
29     HystrixMetricsStreamServlet streamServlet = new HystrixMetricsStreamServlet();
30     ServletRegistrationBean registrationBean = new ServletRegistrationBean(streamServlet);
31     registrationBean.setLoadOnStartup(1);
32     registrationBean.addUrlMappings("/actuator/hystrix.stream");
33     registrationBean.setName("HystrixMetricsStreamServlet");
34
35     return registrationBean;
36   }
37
38   public static void main(String[] args) {
39     SpringApplication.run(HystrixApplication.class,args);
40   }
41 }
注意,这里需要手动注入Bean对象,Hystrix Dashboard无法监测。
三、访问Hystrix Dashboard
启动应用程序后,可以通过访问http://localhost:port/hystrix来打开Hystrix Dashboard的监测页面,其中port是应用程序的端口号。
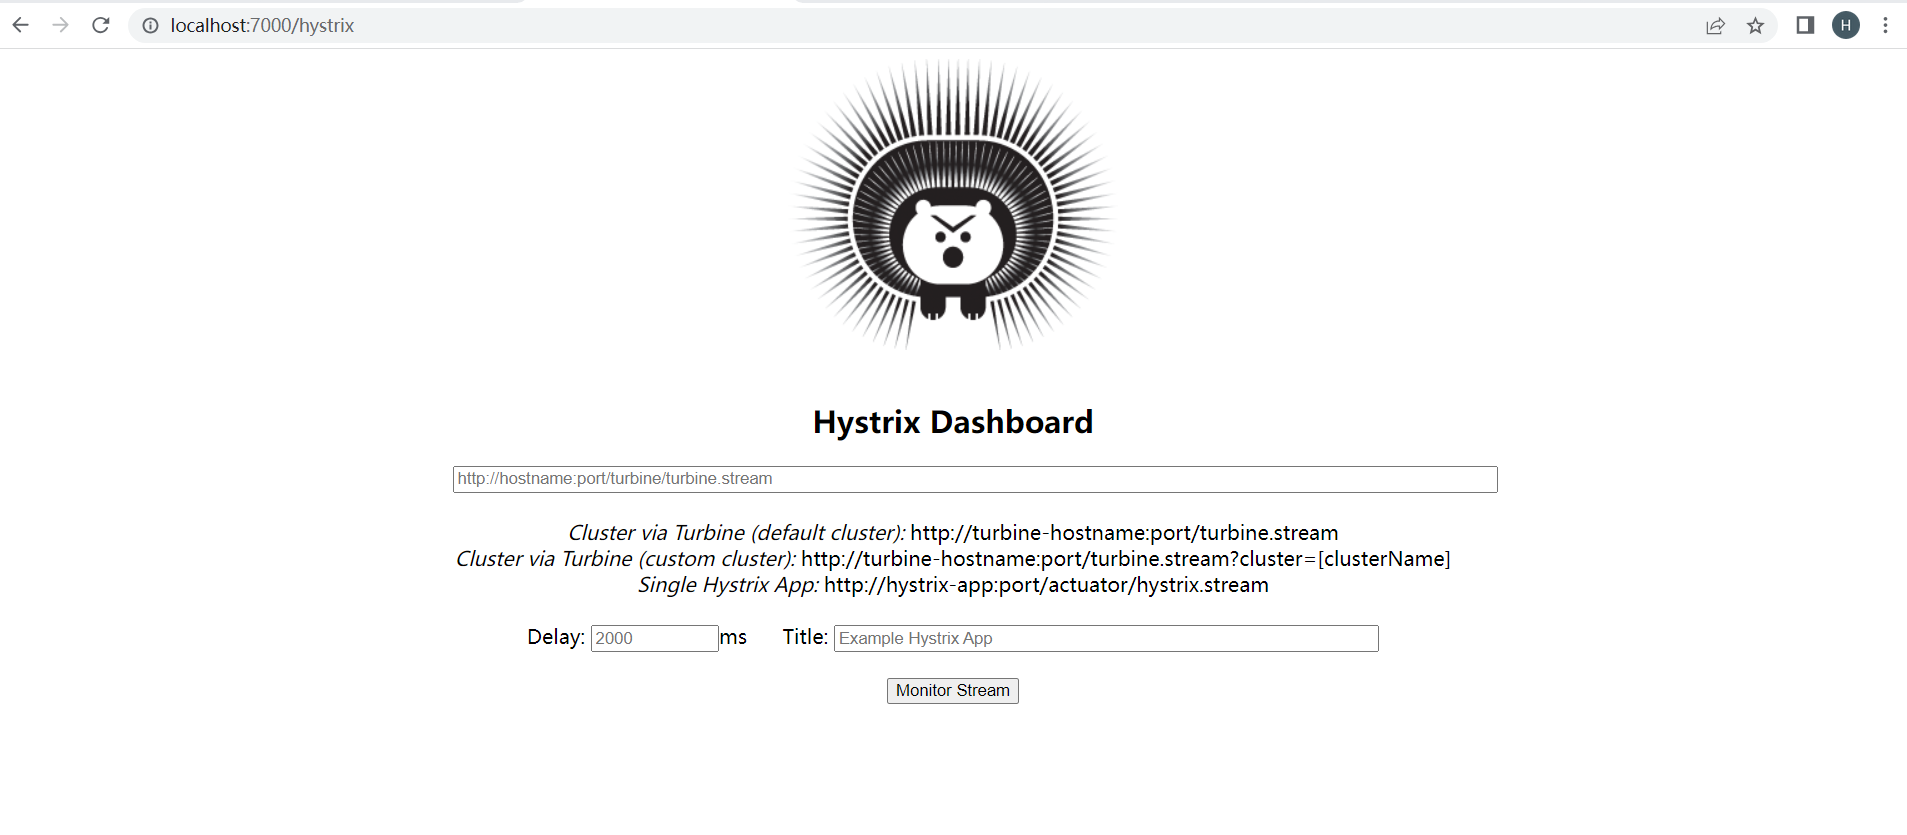
四、输入要监测的应用程序地址
在Hystrix Dashboard的监测页面中,可以看到一个输入框。在输入框中输入要监测的应用程序地址(如http://127.0.0.1:8080/hystrix.stream),然后点Monitor Stream"按钮。我本地输入localhost是不行的,输入IP地址可以。
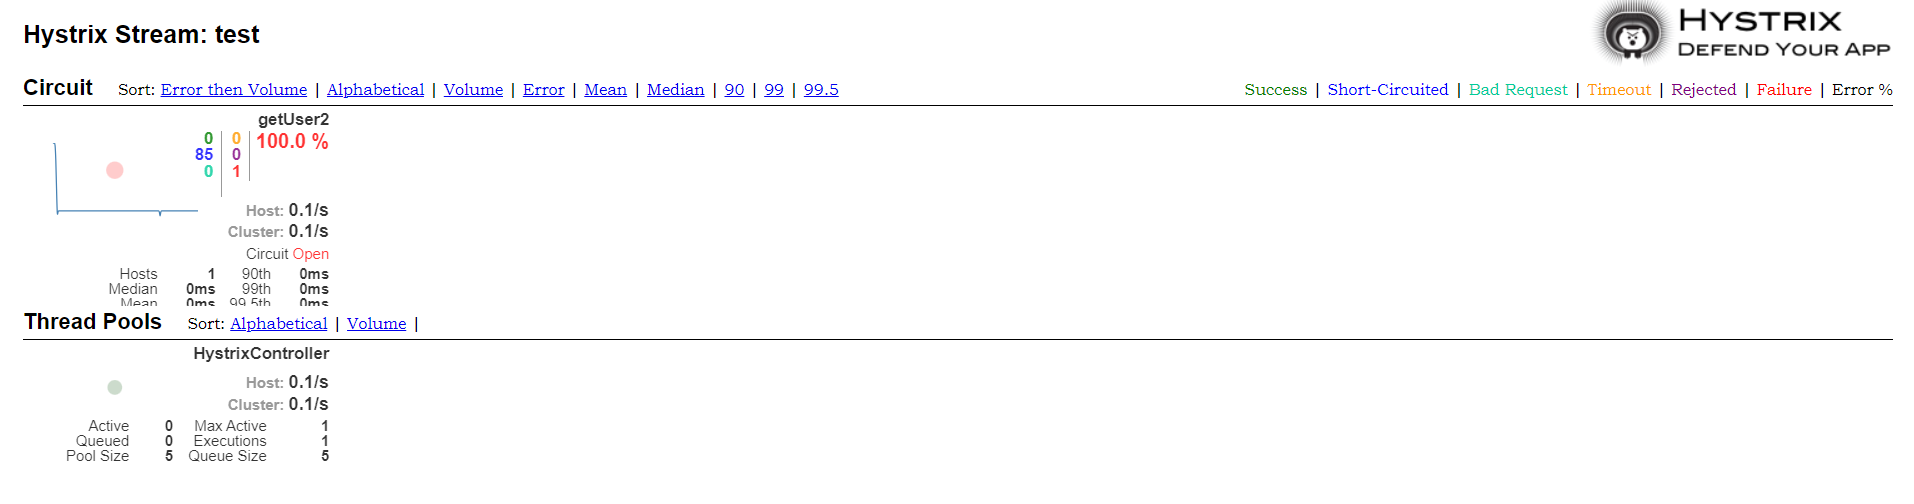
五、查看监测数据
当成功连接到要监测的应用程序后,Hystrix Dashboard将开始显示该应用程序的监测数据,并以图形和指标的形式展示。