1 由于我的是phpstudy集成环境,直接找到php.ini的位置:
D:\phpstudy_pro\Extensions\php\php7.3.9nts\php.ini
在文件尾部直接添加
[Xdebug]
zend_extension=D:/phpstudy_pro/Extensions/php/php7.0.9nts/ext/php_xdebug.dll
xdebug.idekey=phpstorm
xdebug.remote_enable = On
xdebug.remote_host=localhost
;xdebug.remote_port 默认值为9000,这里需要跟phpstorm配置一致
xdebug.remote_port=9000
xdebug.remote_handler=dbgp
xdebug.auto_trace = On
xdebug.remote_cookie_expire_time = 3600
max_execution_time=3600
max_input_time=3600
default_socket_timeout = 3600
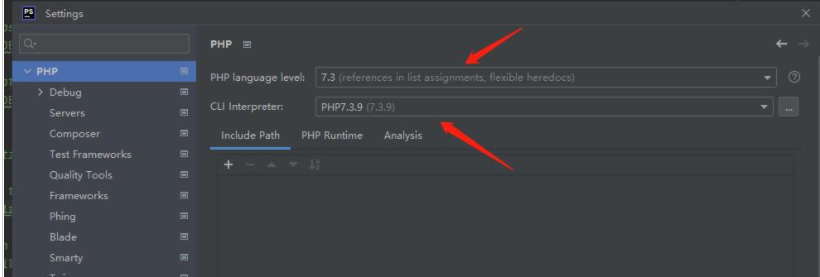
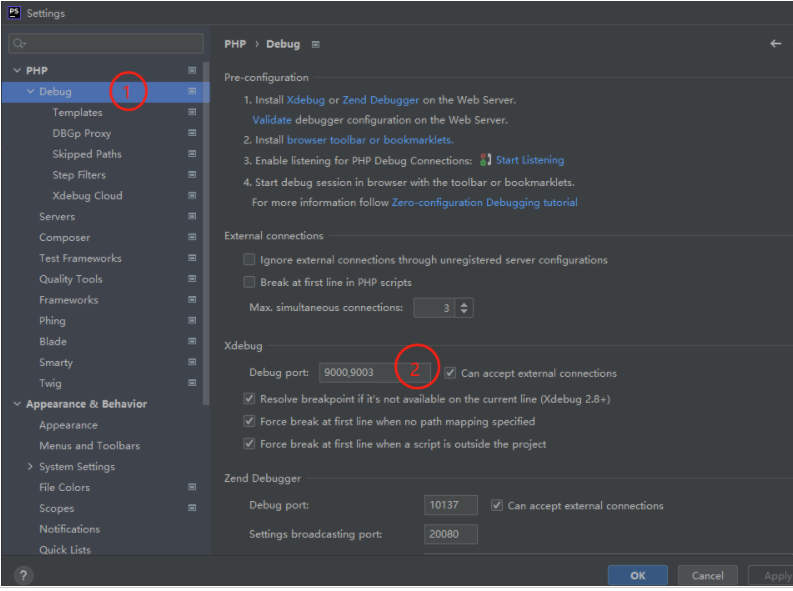
2 配置phpstorm2022

3 安装chrome浏览器扩展:xdebug helper

除了应用市场下载,还可以在chrome浏览器地址栏输入chrome://extensions/,打开调试模式,然后把下载好的xdebug helper插件,
拖入界面安装。
安装好后:

4 开始调试:
在phpstorm上新建断点,打开调试侦听。

刷新浏览器网页,出现以下对勾,表示配置成功
