前
最近在使用海量小文件压测ceph集群,想着搭建一个可视化的界面来监测集群状态,由于很久之前使用过promethues + grafana 监测k8s集群状态,用来监测 ceph 集群应该问题不大,那么就开始吧!
首先了解下 promethues 和 grafana 是什么?
promethues:补充
grafana:补充
1、启用 ceph prometheus 监控模块
任意一台ceph mgr节点执行
ceph mgr module enable prometheus
启用成功后可以看到
[root@node1 ~]# ceph mgr services
{
    "dashboard": "https://node1:8443/",
    "prometheus": "http://node1:9283/"
}
其中 9283 是 ceph_exporter 的监听端口,访问 http://
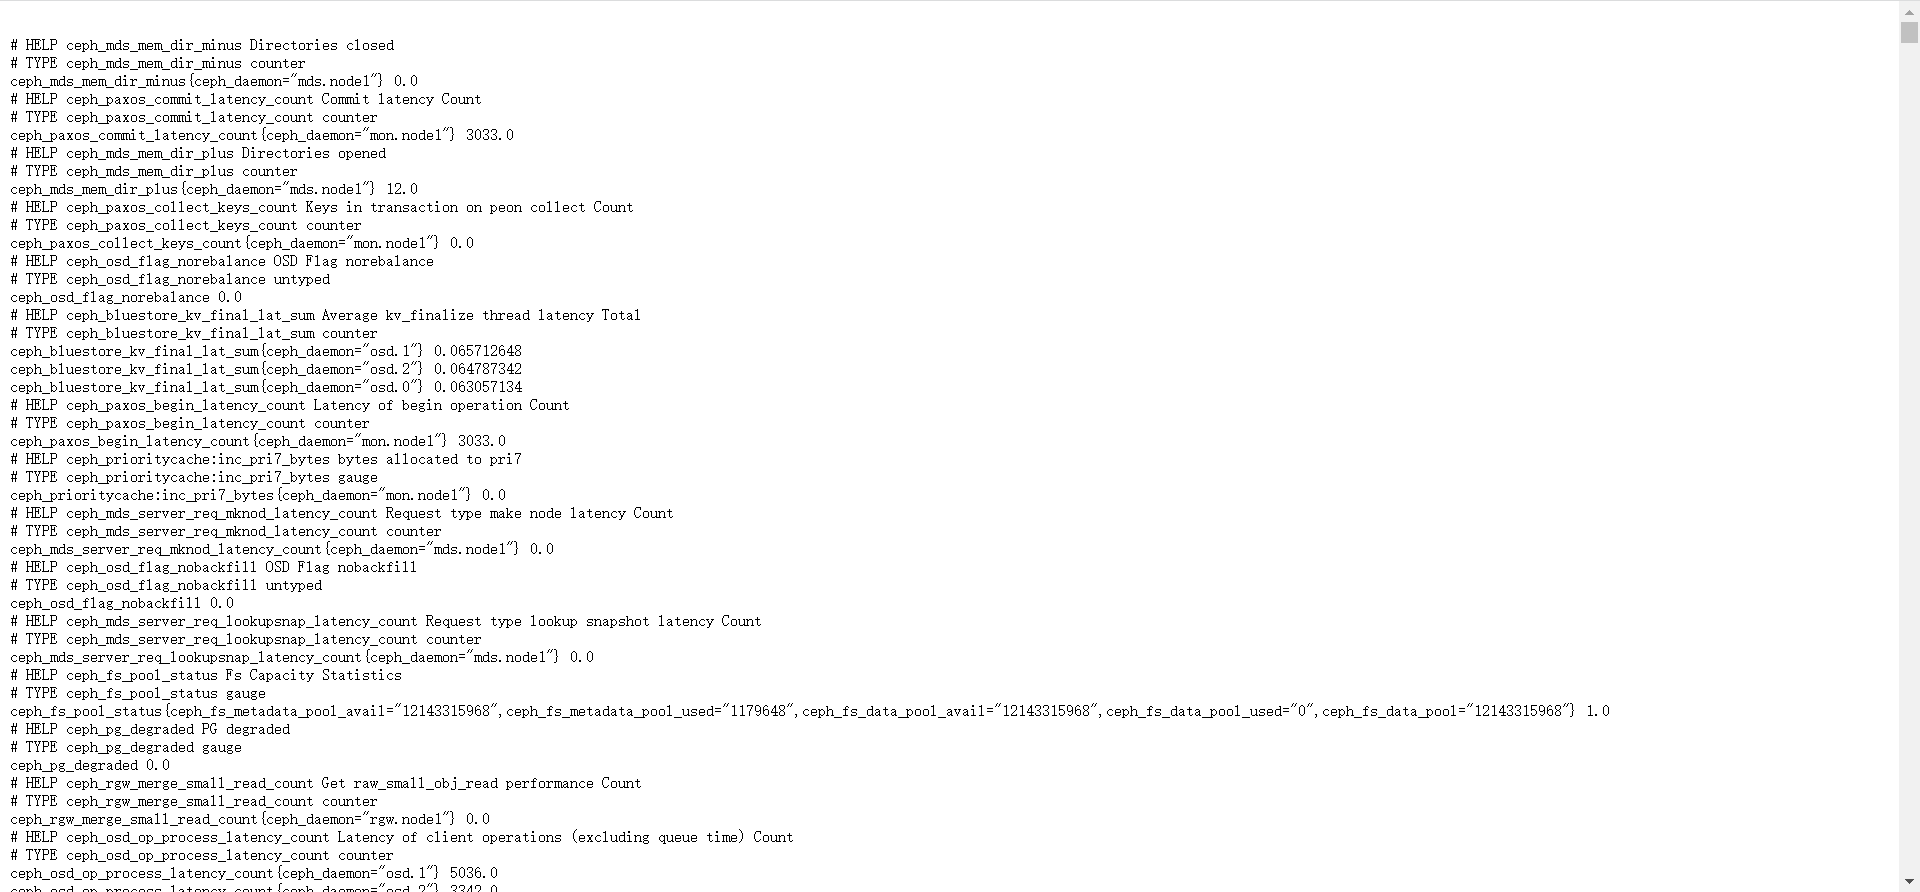
ceph prometheus export端口 9283
[root@node1 prometheus]# ceph mgr services
{
    "dashboard": "https://node1:8443/",
    "prometheus": "http://node1:9283/"
}
prometheus默认端口 9090
[root@node1 ~]# netstat -nlp|grep prometheus
tcp6       0      0 :::9090                 :::*                    LISTEN      1383598/prometheus
grafana默认端口 3000
[root@node1 ~]# netstat -nlp|grep grafana
tcp6       0      0 :::3000                 :::*                    LISTEN      1386437/grafana-ser