1.算法描述
HOG特征提取方法就是将一个image(你要检测的目标或者扫描窗口):
1)灰度化(将图像看做一个x,y,z(灰度)的三维图像);
2)采用Gamma校正法对输入图像进行颜色空间的标准化(归一化);目的是调节图像的对比度,降低图像局部的阴影和光照变化所造成的影响,同时可以抑制噪音的干扰;
3)计算图像每个像素的梯度(包括大小和方向);主要是为了捕获轮廓信息,同时进一步弱化光照的干扰。
4)将图像划分成小cells(例如6*6像素/cell);
5)统计每个cell的梯度直方图(不同梯度的个数),即可形成每个cell的descriptor;
6)将每几个cell组成一个block(例如3*3个cell/block),一个block内所有cell的特征descriptor串联起来便得到该block的HOG特征descriptor。
7)将图像image内的所有block的HOG特征descriptor串联起来就可以得到该image(你要检测的目标)的HOG特征descriptor了。这个就是最终的可供分类使用的特征向量了。
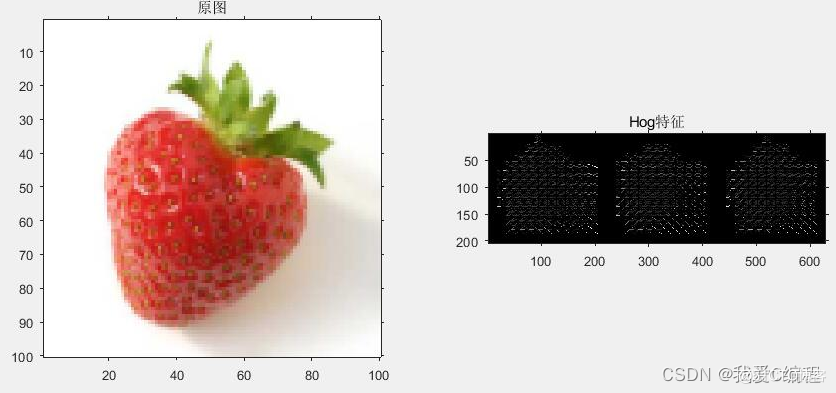
2.仿真效果预览
matlab2022a仿真结果如下:

3.MATLAB核心程序
image = imread('apple.1.png');
subplot(1,2,1);
imshow(uint8(image));

%2、伽马校正
title('原图');
[m n]=size(image);
img = double(image);
img=sqrt(img);

%3、下面是求边缘
fy=[-1 0 1];
fx=fy';
Iy=imfilter(img,fy,'replicate');
Ix=imfilter(img,fx,'replicate');
Ied=sqrt(Ix.^2+Iy.^2);
Iphase=Iy./Ix;
%4、下面是求cell,每个cell求其梯度直方图
step=8;
orient=9;
jiao=360/orient;
Cell=cell(1,1);
ii=1;
jj=1;
for i=1:step:m-step
    ii=1;
    for j=1:step:n-step
        tmpx=Ix(i:i+step-1,j:j+step-1);
        tmped=Ied(i:i+step-1,j:j+step-1);
        tmped= tmped / sum( sum(tmped) );
        tmpphase=Iphase(i:i+step-1,j:j+step-1);
        Hist=zeros(1,orient);
        for p=1:step
            for q=1:step
                if isnan(tmpphase(p,q))==1
                    tmpphase(p,q)=0;
                end
                ang=atan(tmpphase(p,q));
                ang=mod(ang*180/pi,360);
                if tmpx(p,q)<0
                    if ang<90
                        ang=ang+180;
                    end
                    if ang>270
                        ang=ang-180;
                    end
                end
                ang=ang+0.0000001;
                Hist(ceil(ang/jiao))=Hist(ceil(ang/jiao))+ tmped(p,q);
            end
        end
        Hist=Hist/sum(Hist);
        Cell{ii,jj}=Hist;
        ii=ii+1;
    end
    jj=jj+1;
end
%5、显示准备工作
angle = [40,80,120,160,200,240,280,320,360];
rad = angle*pi/180;
k = tan(rad);
[m n] = size(Cell)
image_hog = zeros(m*17,n*17);
for x = 1:m-1
    for y = 1:n-1
    intensity = (Cell{x,y}+Cell{x,y+1}+Cell{x+1,y}+Cell{x+1,y+1})*64;
。。。。。。。。。。。。。。。。。。。。。。。。。。。。。。。。。。。。。。
    end
    %标记
    for i=1:17
        for j=1:9
         block(X(i),Y(j,i)) =intensity(j);           %
        end
    end
    image_hog((x-1)*17+1:(x-1)*17+17 , (y-1)*17+1:(y-1)*17+17) = block(:,:);
    end
end
image_hog = image_hog';

%6、【平滑Hog特征的不规则边缘】高斯平滑
G = [1 2 3 2 1 ;
     2 5 6 5 2 ;
     3 6 8 6 3 ;
     2 5 6 5 2 ;
     1 2 3 2 1 ;]
conv2(G,image_hog );