该内容包括antv-g6官网地址、antv-g6的基本使用(包括自定义节点、常用插件(右键菜单等)、基本事件、目前我所遇到的一些需求)。
1、antv-g6的官网地址:https://g6.antv.antgroup.com/examples
2、安装antv-g6组件
npm install @antv/g6
3、创建antvView.vue文件使用antv/g6插件
①基本用法
//结构布局
<template>
<section style="width: 100%; height: 100%" ref="showFull">
<div id="myChart" class="Echarts" ref="myChart" style="width: 100%; height: 100%"></div>
</section>
</template>
<script>
//页面引入antv/g6
import G6 from '@antv/g6';
import insertCss from 'insert-css';
//菜单样式
// 右键事件
insertCss(`
.g6-component-contextmenu{
padding: 0px;
box-shadow:none;
border:none;
ist-style-type: none;
font-size: ;
color: #545454;
cursor: pointer;
position: relative;
box-shadow: rgb(174, 174, 174) 0px 0px 10px;
padding: 5px 0;
border: 1px solid #e2e2e2;
}
#contextMenu li {
cursor: pointer;
list-style-type:none;
list-style: none;
margin-left: 0px;
padding: 5px 15px;
position: relative;
}
#contextMenu li:hover {
color: #3D8DFF;
}
#contextMenu li:hover .subMenu{
display:block;
}
#contextMenu .subMenu{
display: none;
position:absolute;
top: -6px;
left: 86px;
list-style-type: none;
font-size: 14px;
color: #545454;
cursor: pointer;
border: 1px solid #e2e2e2;
border-radius: 4px;
font-size: 12px;
color: #545454;
padding: 5px 8px;
box-shadow: rgb(174 174 174) 0px 0px 10px;
width: 80px;
}
#contextMenu .menu .icon {
position: absolute;
top: 50%;
margin-top: -8px;
}
#contextMenu .menu .relationship-search{
width:172px;
}
#contextMenu .relationship-search li {
padding: 5px 0px;
}
.relationship-list{
display:flex;
align-items:center;
justify-content: space-between;
}
`);
// 工具栏
insertCss(`
.right-bottom {
position: absolute;
bottom: 10px;
right: 10px;
}
.left-top {
position: absolute;
top: 10px;
left: 10px;
}
.g6-toolbar-ul li {
cursor: pointer;
list-style-type:none;
list-style: none;
margin-left: 0px;
}
.g6-toolbar-ul li img{
width:36px;
height:36px;
}
.g6-component-toolbar{
background: none;
border: none;
// width: 40px;
}
.g6-component-toolbar li {
list-style-type: none !important;
height: 40px;
width: 40px;
margin-right: 10px;
}
.g6-component-tooltip{
box-shadow:none;
border:none;
}
.tooltip{
max-width: 200px;
box-shadow: rgb(174, 174, 174) 0px 0px 10px;
padding: 5px 10px;
border: 1px solid #e2e2e2;
font-size: 14px;
word-break: break-all;
}
`);
insertCss(`
.g6-minimap{
background: ${window.antvViewColor.canvasBackground};
}
`)
export default {
data () {
return {
myChart: null,
zoomNum: 0.5,
canvasWidth: 0,
canvasHeight: 0,
groupNode: [],
};
},
created () { },
mounted () {},
methods: {
//从接口获取节点、关系数据并传入
initView (nodes = [], links = [], type = '') {
let that = this;
let node = [];
//links的数据结构,例:[{sourceNodeId:'1',targetNodeId:'2',linkId:'3',linkName:'节点1指向节点2的边'}]
let link = that.getLinks(links || []);
//nodes的数据结构,例:[{id:'1',name:'节点1'},{id:'2',name:'节点2'}]
node = that.getNodes(nodes || []);
that.initChart(node, link, type);
},
getNodes (data) {
let that = this;
let result = [];
data.map((item, index) => {
let node = {
...item,
label: item.name,//节点名称
size: 20,
}
node.style = {
fill: window.antvViewColor.node.style.fill,//节点填充色
stroke: window.antvViewColor.node.style.fill,//节点边框颜色
}
if(需要使用自定义节点,例:渲染一张图片,且点击图片可以预览){
node.img = 'https://engine-dev.piesat.cn/bpaas/fs/res/download/7Vsztl4GmwKaku9c7Epz90iLI.jpg?appKey=9e92d795a36edea0';
node.type = 'previewPictures';
}
result.push(node)
})
return result
},
getLinks (data) {
let result = [];
data.map(item => {
let link = {
...item,
source: item.sourceNodeId,//源id
target: item.targetNodeId,//目标id
id: item.linkId,
label: item.linkName,//关系名称
//箭头样式
newEndArrow:{
path: G6.Arrow.vee(6, 5, 21),
d: 21,
fill: window.antvViewColor.edge.style.endArrow.fill,//箭头填充色
stroke: window.antvViewColor.edge.style.endArrow.stroke,//箭头边框颜色
}
}
result.push(link);
})
return result
},
initChart (nodes, links, type = '') {
let that = this;
// 多边显示
G6.Util.processParallelEdges(links);
const container = that.$refs.myChart;
container.style.backgroundColor = window.antvViewColor.canvasBackground;
that.canvasWidth = container.clientWidth;
that.canvasHeight = (container.clientHeight || 500) - 20;
//节点右键菜单
let contextMenu;
let curMenu = that.contextmenu().destroyed
if (curMenu != undefined) {
contextMenu = that.contextmenu()
} else {
contextMenu = that.initMenu()
}
//添加工具,例:放大、缩小 const toolbar = new G6.ToolBar({
// position: { x: 10, y: 10 },
className: 'g6-toolbar-ul ' + that.toolbarPosition,
// <li code="earth" style="${this.hasEarth ? 'display:block;' : 'display: none;'}">
// <img src="${require('../assets/image/icon_earth_blue.png')}"/>
// </li>
getContent: () => {
return `
<ul>
<li code="zoomOut">
<img src="${require('../assets/image/icon_zoom_out.png')}"/>
</li>
<li code="zoomIn">
<img src="${require('../assets/image/icon_zoom_in.png')}"/>
</li>
<li code="full">
<img src="${require('../assets/image/icon_full.png')}"/>
</li>
</ul>
`
},
handleClick: (code, graph) => {
if (code == 'zoomOut') {
that.zoomNum = that.zoomNum + 0.2;
that.myChart.zoomTo(that.zoomNum, { x: (that.$refs.myChart.clientWidth / 2), y: (that.$refs.myChart.clientHeight / 2) });
}
if (code == 'zoomIn') {
that.zoomNum = that.zoomNum - 0.2;
that.myChart.zoomTo(that.zoomNum, { x: (that.$refs.myChart.clientWidth / 2), y: (that.$refs.myChart.clientHeight / 2) });
}
if (code == 'full') {
let element = that.$refs.showFull;
// element.setOption(pacchartOption4);
if (element.requestFullScreen) {
// HTML W3C 提议
element.requestFullScreen();
} else if (element.msRequestFullscreen) {
// IE11
element.msRequestFullScreen();
} else if (element.webkitRequestFullScreen) {
// Webkit (works in Safari5.1 and Chrome 15)
element.webkitRequestFullScreen();
} else if (element.mozRequestFullScreen) {
// Firefox (works in nightly)
element.mozRequestFullScreen();
}
// 退出全屏
if (element.requestFullScreen) {
document.exitFullscreen();
} else if (element.msRequestFullScreen) {
document.msExitFullscreen();
} else if (element.webkitRequestFullScreen) {
document.webkitCancelFullScreen();
} else if (element.mozRequestFullScreen) {
document.mozCancelFullScreen();
}
that.$nextTick(() => {
that.onresize()
})
}
}
});
//Minimap 是用于快速预览和探索图的工具 const minimap = new G6.Minimap({
size: [150, 100],
});
// 节点弹框
//Tooltip 插件主要用于在节点和边上展示一些辅助信息
const tooltip = new G6.Tooltip({
offsetX: 10,
offsetY: 20,
itemTypes: ["node", "edge"],
// 自定义 tooltip 内容
getContent: (e) => {
const outDiv = document.createElement("div");
const node = e.item.getModel();
const nodeName = node.name || node.linkName;
if (nodeName.length > 5) {
const formatedNodeName = `
<p class="tooltip">${nodeName}</p>
`;
outDiv.innerHTML = `${formatedNodeName}`;
return outDiv;
} else {
const outDiv = document.createElement("div");
outDiv.style.padding = '0px 0px 0px 0px';
outDiv.style.backgroundColor = "transparent";
return outDiv;
}
},
});
that.initIconFont();//自定义节点
if (that.myChart) {
that.myChart.destroy()
}
that.myChart = new G6.Graph({
container: that.$refs.myChart,
width: that.canvasWidth,
height: that.canvasHeight,
linkCenter: true,//指定边是否连入节点的中心
fitCenter: true,//开启后,图将会被平移,图的中心将对齐到画布中心,但不缩放。优先级低于 fitView。
animate: false,
background: 'none',
modes: {
default: [
'drag-canvas',//允许画布被拖拽
{
type: 'create-edge',//通过交互创建边
key: 'control', // undefined by default, options: 'shift', 'control', 'ctrl', 'meta', 'alt'
},
'zoom-canvas',//画布允许放大缩小
'drag-node',//允许节点被拖拽
'brush-select',//拖动框选节点
]
},
plugins: [contextMenu, toolbar, minimap, tooltip],//插件
layout: {
type: 'gForce',//布局类型,主流布局力导向布局 type为force
gpuEnabled: true,//是否启用 GPU 并行计算,个别浏览器是不支持GPU的会导致页面渲染错乱或者渲染慢
// type: 'fruchterman',
// gpuEnabled: true,
// type: 'force',
// preventOverlap: true,//是否防止节点之间以及 combo 之间的重叠
// nodeSpacing: 40,
// gravity: 50,
linkDistance: 150,//边长度
// nodeStrength: -10,
// edgeStrength: 0.7,
},
//默认节点样式
defaultNode: {
labelCfg: { // 标签配置属性
style: { // 包裹标签样式属性的字段 style 与标签其他属性在数据结构上并行
fontSize: 5, // 标签的样式属性,文字字体大小
textAlign: 'center',
textBaseline:'middle',
lineHeight: 10,
fill: window.antvViewColor.node.labelCfg.style.fill,
}
},
style: {
r: 18,
radius: 8,
cursor: 'pointer'
}
},
//默认边样式
defaultEdge: {
shape: "line",
endArrow: true,
startArrow: true,
labelCfg: {
autoRotate: true,
refY: -4,
style: {
fontSize: 5,
fill: window.antvViewColor.edge.labelCfg.style.fill,
background: {
fill: 'transparent',
stroke: 'transparent',
padding: [2, 2, 2, 2],
radius: 2,
},
}
},
style: {
lineWidth: 1,
stroke: window.antvViewColor.edge.style.stroke,
endArrow: {
path: G6.Arrow.vee(6, 5, 21),
d: 21,
fill: window.antvViewColor.edge.style.endArrow.fill,
stroke: window.antvViewColor.edge.style.endArrow.stroke,
},
cursor: 'pointer'
}
},
//各个状态下节点的样式,例如
hover、selected,3.1 版本新增 nodeStateStyles: {
// 选中添加
selected: {},
},
});
that.myChart.data({
nodes,
edges: links,
});
that.myChart.render();
this.initGraphCenterPoint = that.myChart.getGraphCenterPoint()
setTimeout(() => {
that.myChart.paint();
}, 16);
// 节点左键点击事件,事件添加这个位置
that.myChart.on('node:click', (evt) => { })
// 节点左键双击事件
that.myChart.on('node:dblclick', (evt) => { })
// 鼠标移入
that.myChart.on('node:mouseenter, (evt) => { })
// 鼠标移出
that.myChart.on('node:mouseleave, (evt) => { })
// 节点拖拽
that.myChart.on('node:drag, (evt) => { })
// 画布点击事件
that.myChart.on('canvas:click, (evt) => { })
// 滚轮事件
that.myChart.on('wheelzoom, (evt) => { })
// 调用
graph.setItemState 方法之后触发 that.myChart.on('afteritemstatechange, (evt) => { })
if (typeof window !== 'undefined')
window.onresize = () => {
if (!that.myChart || that.myChart.get('destroyed')) return;
if (!container || !container.scrollWidth || !container.scrollHeight) return;
that.myChart.changeSize(container.scrollWidth, container.scrollHeight);
};
that.onresize('init')
},
//自定义节点
initIconFont () {
let that = this;
G6.registerNode('previewPictures', {
draw: (cfg, group) => {
//最外面的那层
let shape = null;
shape = group.addShape('image', {
draggable: true,
attrs: {
x: 0,
y: 0,
width: 52,
height: 32,
img: cfg.img,
cursor: 'pointer',
name: 'preview-pictures-shape',
},
});
return shape;
},
});
//圆形嵌套圆形
G6.registerNode('defaultNode', {
draw: (cfg, group) => {
const shape = group.addShape('circle', {
draggable: true,
attrs: {
x: 0,
y: 0,
r: 20,
fill: cfg.style.fill, //填充色
stroke: cfg.style.stroke, //边框
radius: 8,
},
});
group.addShape('circle', {
draggable: true,
attrs: {
x: 0,
y: 0,
r: 19,
fill: cfg.style.fill?cfg.style.fill:'transparent', //填充色
stroke: 'transparent', //边框
radius: 8,
},
});
//文字
group.addShape('text', {
draggable: true,
attrs: {
fontSize: 5,
textAlign: 'center',
textBaseline:'middle',
lineHeight: 10,
text: cfg.label,
fill: cfg.labelCfg.style.fill,
cursor: 'pointer'
},
});
return shape;
},
});
},
//用于配置节点上的右键菜单
contextmenu(){
let that = this;
const contextmenu = new G6.Menu({
getContent(evt) {
return `<ul>
<li title='1'>测试02</li>
<li title='2'>测试02</li>
<li>测试02</li>
<li>测试02</li>
<li>测试02</li>
</ul>`;
},
handleMenuClick(target, item) {
console.log(target, item)
},
// offsetX and offsetY include the padding of the parent container
// 需要加上父级容器的 padding-left 16 与自身偏移量 10
offsetX: 16,
// 需要加上父级容器的 padding-top 24 、画布兄弟元素高度、与自身偏移量 10
offsetY: 0,
// the types of items that allow the menu show up
// 在哪些类型的元素上响应
itemTypes: ['node'],
});
return contextMenu
},
focusItem (item) {
let that = this
that.myChart.focusItem(item, true, {
easing: 'easeCubic',
duration: 500,
});
},
onresize (type) {
let that = this;
if (typeof window !== 'undefined') {
setTimeout(() => {
window.onresize = () => {
const container = that.$refs.myChart;
if (!that.myChart || that.myChart.destroyed) return;
if (!container || !container.scrollWidth || !container.scrollHeight) return;
that.myChart.changeSize(0, 0);
container.style.width = '100%';
container.style.height = '100%';
container.removeAttribute('width');
container.removeAttribute('height');
that.canvasWidth = container.clientWidth;
that.canvasHeight = container.clientHeight;
that.myChart.changeSize(that.canvasWidth, that.canvasHeight);
};
}, 20)
}
},
//更新数据
updateChart (nodes, links, type, id) {
let that = this;
if (!that.myChart || that.myChart.destroyed) return;
let node = that.getNodes(nodes || []);
let link = that.getLinks(links || []);
// 多边显示
G6.Util.processParallelEdges(link);
that.myChart.changeData({
nodes: node,
edges: link,
});
that.myChart.refresh();
// const item = that.myChart.findById(id);
// that.focusItem(item)
},
},
}
</script>
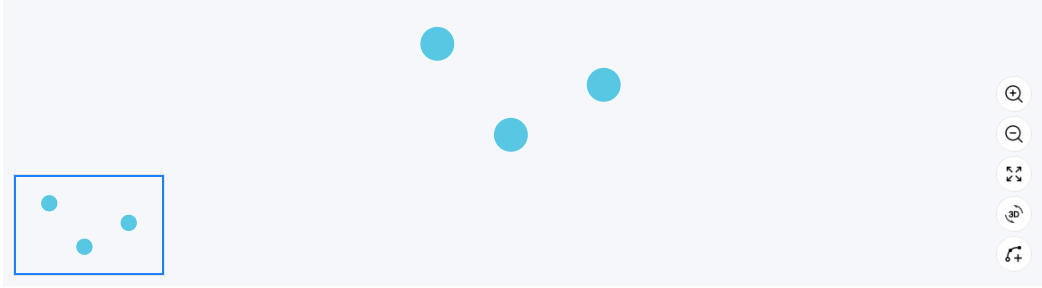
②定制需求
(1)实现画布到达一定层级时显示节点名称以及边名称(包括箭头);
// 显示隐藏节点和边的label(或者你想隐藏的属性)
//传入type值,type为true显示label,false隐藏label
showLabelsForHiddenNodesAndEdges(type){
let that = this;
//获取所用节点
this.myChart.getNodes().forEach(node => {
if (!node.destroyed) {
const children = node.get('group').get('children');
const childrenLength = children.length;
for (let c = 0; c < childrenLength; c++) {
// 隐藏label、图片 通过type类型以及设置节点时添加的name值来控制那些需要隐藏
if(children[c].cfg.type == 'text' || children[c].cfg.name == 'circle-img-node'){
const shape = children[c];
if (!shape.destoryed && !shape.get('isKeyShape')) {
shape.set('ori-visibility', shape.get('ori-visibility') || shape.get('visible'));
shape[type]();
}
}
if(children[c].cfg.name == 'icon-font-text'){
const shape = children[c];
if (!shape.destoryed) {
shape.set('ori-visibility', shape.get('ori-visibility') || shape.get('visible'));
shape[type]();
}
}
}
}
});
//获取所有边
this.myChart.getEdges().forEach(edge => {
if (!edge.destroyed) {
const children = edge.get('group').get('children');
const childrenLength = children.length;
for (let c = 0; c < childrenLength; c++) {
const shape = children[c];
if (!shape.destoryed && !shape.get('isKeyShape')) {
shape.set('ori-visibility', shape.get('ori-visibility') || shape.get('visible'));
shape[type]();
}
}
//控制箭头的显示隐藏 if(type == 'show'){
that.myChart.updateItem(edge._cfg.id, {
style: {
endArrow: edge._cfg.model.newEndArrow,
startArrow: edge._cfg.model.newStartArrow
}
})
}else{
that.myChart.updateItem(edge._cfg.id, {
style: {
endArrow: {
path: (edge._cfg.model.source == edge._cfg.model.target)&&(edge._cfg.model.direction == 0)?G6.Arrow.vee(6, 5, 4):G6.Arrow.vee(6, 5, 21),
d: (edge._cfg.model.source == edge._cfg.model.target)&&(edge._cfg.model.direction == 0)?4:21,
fill: 'transparent',
stroke: 'transparent',
},
startArrow: {
path: G6.Arrow.vee(8, 10, 4),
d: 4,
fill: 'transparent',
stroke: 'transparent',
}
}
})
}
}
});
},
(2)实现鼠标移入节点显示阴影移出不显示,点击节点显示阴影且最里层和最外层为节点颜色、中间层用白色分隔;
点击效果: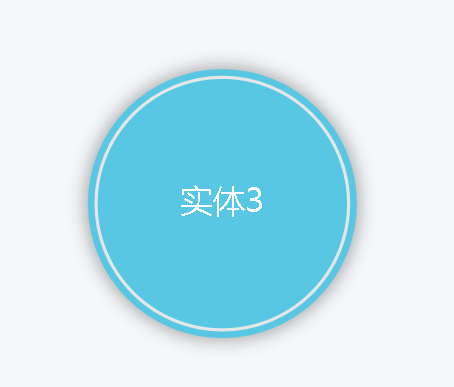
//鼠标移入事件
that.myChart.on('node:mouseenter', function (evt) {
// 修改自定义节点
that.myChart.setItemState(evt.item,'mouseenter',true);
});
//鼠标移出事件
that.myChart.on('node:mouseleave', function (evt) {
that.myChart.setItemState(evt.item,'mouseenter',false);
});
// 节点点击事件
that.myChart.on('node:click', (evt) => {
const node = evt.item;
const model = node.getModel();
const { item } = evt;
//节点点击时先将所有节点置为初始样式,此处if判断是将点击图片预览功能排除
if(model.type != 'previewPictures'){
that.myChart.getNodes().map((item) => {
that.myChart.clearItemStates(item);
that.myChart.updateItem(item, {
style: {
shadowColor: 'transparent',
shadowBlur: 0,
stroke:item._cfg.model.nodeType == 'ENTITY_PROP'?item._cfg.model.style.stroke:'transparent',
lineWidth: item._cfg.model.nodeType == 'ENTITY_PROP'?1:0,
}
})
});
// 修改自定义节点
that.myChart.setItemState(node, 'selected', !node.hasState('selected'));
}else{
//实现自定义节点为图片且点击图片可以预览
this.previewPictures = model.img;
this.showImageViewer = true;
}
})
//在鼠标移入移出、节点点击操作后都执行该方法
that.myChart.on('afteritemstatechange', evt => {
this.handleSetState(evt.state,evt.enabled,evt.item);
})
//样式更改
handleSetState(name, value, item){
//判断节点是否被选中,主要是用来判断阴影是否消失,如果为选中状态鼠标移出阴影不消失
let statesStatus = this.handleNodeIsSelected(item);
const group = item.getContainer();
const shape = group.get('children')[0]; // 顺序根据 draw 时确定
let zoomLevel = this.myChart.getZoom();//获取当前图表层级
let shadowBlur = 0 ;
//此处根据图表层级判断阴影大小
if(zoomLevel <= 1.2){
shadowBlur = 1;
}else if(zoomLevel > 1.2 && zoomLevel <= 3){
shadowBlur = 5;
}else if( zoomLevel > 3 ){
shadowBlur = 18;
}
// 鼠标移入、移出样式
if (name === 'mouseenter') {
let style = {};
// 鼠标移入
if (value) {
style = {
shadowColor:window.antvViewColor.node.mouseEnterShaowColor.shadowColor,
shadowBlur:shadowBlur,
stroke: item._cfg.model.nodeType == 'ENTITY_PROP'?item._cfg.model.style.stroke:(statesStatus?item._cfg.model.style.fill:'transparent'),
lineWidth: item._cfg.model.nodeType == 'ENTITY_PROP'?1:(statesStatus?1:0),
fill:statesStatus?window.antvViewColor.node.mouseEnterShaowColor.selectedFill:item._cfg.model.style.fill,
}
} else {
// 鼠标移出
style = {
shadowColor:statesStatus?window.antvViewColor.node.mouseEnterShaowColor.shadowColor:'transparent',
shadowBlur:statesStatus?shadowBlur:0,
stroke: item._cfg.model.nodeType == 'ENTITY_PROP'?item._cfg.model.style.stroke:(statesStatus?item._cfg.model.style.fill:'transparent'),
lineWidth: item._cfg.model.nodeType == 'ENTITY_PROP'?1:(statesStatus?1:0),
fill:statesStatus?window.antvViewColor.node.mouseEnterShaowColor.selectedFill:item._cfg.model.style.fill,
}
}
shape.attr(style);
}
// 点击样式
if (name === 'selected') {
let style = {};
if (value) {
style = {
shadowColor:window.antvViewColor.node.mouseEnterShaowColor.shadowColor,
shadowBlur:shadowBlur,
stroke: item._cfg.model.nodeType == 'ENTITY_PROP'?item._cfg.model.style.stroke:item._cfg.model.style.fill,
lineWidth: 1,
fill:window.antvViewColor.node.mouseEnterShaowColor.selectedFill,
}
} else {
style = {
shadowColor:'transparent',
shadowBlur:0,
stroke:item._cfg.model.nodeType == 'ENTITY_PROP'?item._cfg.model.style.stroke:'transparent',
lineWidth: item._cfg.model.nodeType == 'ENTITY_PROP'?1:0,
fill:item._cfg.model.style.fill,
}
}
shape.attr(style);
}
},
// 判断节点是否被选中
handleNodeIsSelected(evt){
let statesStatus = false;
if(evt._cfg.states && evt._cfg.states.length > 0){
evt._cfg.states.map((list)=>{
if(list == 'selected'){
statesStatus = true;
}
})
}
return statesStatus
},
(3)节点展示为一张图片且点击图片可以预览(使用的是elementui中的图片预览);
效果: 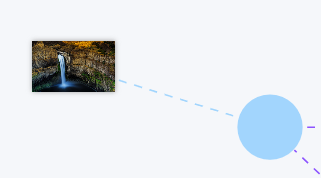
预览效果: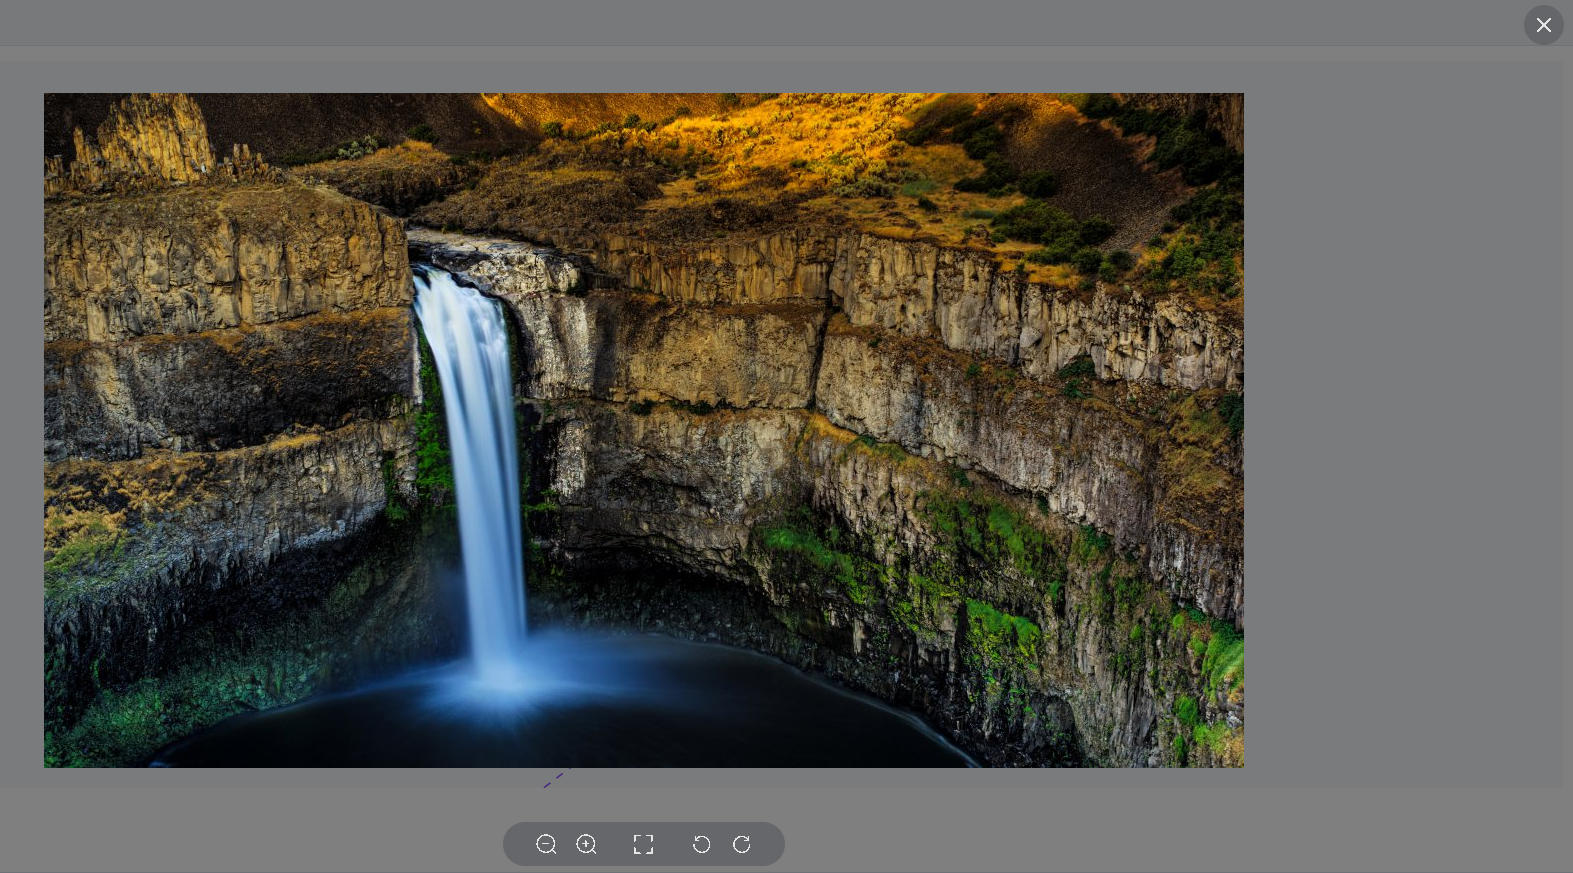
结构布局:
<el-image-viewer
v-if="showImageViewer"
:on-close="()=>{showImageViewer = false}"
:url-list="[previewPictures]">
</el-image-viewer>
在components中引入预览插件:
components: {
'el-image-viewer':()=>import("element-ui/packages/image/src/image-viewer")
},
在data中定义:
showImageViewer:false, //控制图片预览
previewPictures:'',
在处理节点的getNodes方法中设置图片的地址以及type类型:
node.img = 'https://engine-dev.piesat.cn/bpaas/fs/res/download/7Vsztl4GmwKaku9c7Epz90iLI.jpg?appKey=9e92d795a36edea0';
node.type = 'previewPictures';
在定义节点的initIconFont方法中定义图片:
G6.registerNode('previewPictures', {
draw: (cfg, group) => {
//最外面的那层
let shape = null;
shape = group.addShape('image', {
draggable: true,
attrs: {
x: 0,
y: 0,
width: 52,
height: 32,
img: cfg.img,
cursor: 'pointer',
name: 'preview-pictures-shape',
},
});
return shape;
},
});
实现点击图片预览:
that.myChart.on('node:click', (evt) => {
const node = evt.item;
const model = node.getModel();
this.previewPictures = model.img;
this.showImageViewer = true;
})