正态分布可视化
可视化函数
def set_axes(axes, xlabel, ylabel, xlim, ylim, xscale, yscale, legend):
    """设置matplotlib的轴"""
    axes.set_xlabel(xlabel)
    axes.set_ylabel(ylabel)
    axes.set_xscale(xscale)
    axes.set_yscale(yscale)
    axes.set_xlim(xlim)
    axes.set_ylim(ylim)
    if legend:
        axes.legend(legend)
        axes.grid()

def use_svg_display(): #@save
    """使⽤svg格式在Jupyter中显⽰绘图"""
    backend_inline.set_matplotlib_formats('svg')

def set_figsize(figsize=(3.5,2.5)):#@save
    use_svg_display()
    d2l.plt.rcParams['figure.figsize'] = figsize

def plot(X,Y=None,xlabel=None,ylabel=None,legend=None,xlim=None,ylim=None,xscale='linear',yscale='linear',fmts=('-','m--','g-.','r:'),
        figsize=(3.5,2.5),axes=None):
    if legend is None:
        legend = []
    set_figsize(figsize)
    axes = axes if axes else d2l.plt.gca()
    def has_one_axis(X):
        return (hasattr(X,"ndim") and X.ndim == 1 or isinstance(X,list)) and not hasattr(X[0],"__len__")
    if has_one_axis(X):
        X=[X]
    if Y is None:
        X,Y=[[]]*len(X),X
    elif has_one_axis(Y):
        Y = [Y]
    if len(X) != len(Y):
        X  = X*len(Y)
    axes.cla()
    for x,y,fmt in zip(X,Y,fmts):
        if len(x):
            axes.plot(x,y,fmt)
        else:
            axes.plot(y,fmt)
    set_axes(axes, xlabel,ylabel,xlim,ylim,xscale,yscale,legend)
正态分布函数
def normal(x,mu,sigma):
    p = 1/math.sqrt(2*math.pi*sigma**2)
    return p*np.exp(-0.5/sigma**2*(x-mu)**2)
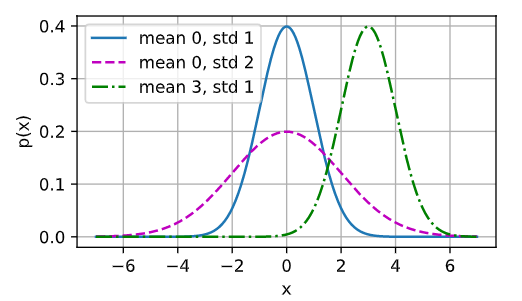
将正太分布函数可视化
x = np.arange(-7,7,0.01)
params = [(0,1),(0,2),(3,1)]
plot(x,[normal(x,mu,sigma) for mu,sigma in params], xlabel='x',ylabel='p(x)',figsize=(4.5,2.5),legend=[f'mean {mu}, std {sigma}' for mu, sigma in params])