Hello, 大家好, 今天给大家分享的这个本周发生在生产环境的一个真实的案例。
故障的现象是: 主库短时间内生成了大量的WAL日志,触发了归档archive_command的操作,导致灾备中心的2台standby 机器同步中断。
Standby Log:
FATAL: could not receive data from WAL stream: ERROR: requested WAL segment 0000000E000001120000004E has already been removed

同时也触发了主库磁盘写入异常的报警: 每秒达到了500MB+

登录主库服务器,查看归档路径大小:大致产生了80GB+的WAL日志 (粗略统计)
PROD [postgres@whdrcsrv710 archive_wals]# du -h ./ 82G ./ 作为DBA的第一放反应是,开发那边是不是偷偷的跑了什么大量数据处理的任务了: insert,update,delete 等操作。
我们可以用PG 原生自带的工具pg_waldump 分析一下WAL 日志: 到底是是操作了那个数据库对象?
PROD [postgres@wqdcsrv1318 archive_wals]# pg_waldump ./0000000E000001150000005A
rmgr: XLOG len (rec/tot): 49/ 7885, tx: 0, lsn: 115/5AFD40C8, prev 115/5AFD21E0, desc: FPI_FOR_HINT , blkref #0: rel 1663/8786419/8843923 blk 1950374 FPW rmgr: XLOG len (rec/tot): 49/ 7885, tx: 0, lsn: 115/5AFD5F98, prev 115/5AFD40C8, desc: FPI_FOR_HINT , blkref #0: rel 1663/8786419/8843923 blk 1950375 FPW rmgr: XLOG len (rec/tot): 49/ 7885, tx: 0, lsn: 115/5AFD7E80, prev 115/5AFD5F98, desc: FPI_FOR_HINT , blkref #0: rel 1663/8786419/8843923 blk 1950376 FPW rmgr: XLOG len (rec/tot): 49/ 7885, tx: 0, lsn: 115/5AFD9D68, prev 115/5AFD7E80, desc: FPI_FOR_HINT , blkref #0: rel 1663/8786419/8843923 blk 1950377 FPW rmgr: XLOG len (rec/tot): 49/ 7885, tx: 0, lsn: 115/5AFDBC50, prev 115/5AFD9D68, desc: FPI_FOR_HINT , blkref #0: rel 1663/8786419/8843923 blk 1950378 FPW rmgr: XLOG len (rec/tot): 49/ 7885, tx: 0, lsn: 115/5AFDDB38, prev 115/5AFDBC50, desc: FPI_FOR_HINT , blkref #0: rel 1663/8786419/8843923 blk 1950379 FPW rmgr: XLOG len (rec/tot): 49/ 7885, tx: 0, lsn: 115/5AFDFA20, prev 115/5AFDDB38, desc: FPI_FOR_HINT , blkref #0: rel 1663/8786419/8843923 blk 1950381 FPW rmgr: XLOG len (rec/tot): 49/ 7885, tx: 0, lsn: 115/5AFE1908, prev 115/5AFDFA20, desc: FPI_FOR_HINT , blkref #0: rel 1663/8786419/8843923 blk 1950380 FPW rmgr: XLOG len (rec/tot): 49/ 7885, tx: 0, lsn: 115/5AFE37F0, prev 115/5AFE1908, desc: FPI_FOR_HINT , blkref #0: rel 1663/8786419/8843923 blk 1950382 FPW rmgr: XLOG len (rec/tot): 49/ 7885, tx: 0, lsn: 115/5AFE56D8, prev 115/5AFE37F0, desc: FPI_FOR_HINT , blkref #0: rel 1663/8786419/8843923 blk 1950383 FPW rmgr: XLOG len (rec/tot): 49/ 7885, tx: 0, lsn: 115/5AFE75C0, prev 115/5AFE56D8, desc: FPI_FOR_HINT , blkref #0: rel 1663/8786419/8843923 blk 1950384 FPW rmgr: XLOG len (rec/tot): 49/ 7885, tx: 0, lsn: 115/5AFE94A8, prev 115/5AFE75C0, desc: FPI_FOR_HINT , blkref #0: rel 1663/8786419/8843923 blk 1950385 FPW rmgr: XLOG len (rec/tot): 49/ 7885, tx: 0, lsn: 115/5AFEB390, prev 115/5AFE94A8, desc: FPI_FOR_HINT , blkref #0: rel 1663/8786419/8843923 blk 1950386 FPW rmgr: XLOG len (rec/tot): 49/ 7885, tx: 0, lsn: 115/5AFED278, prev 115/5AFEB390, desc: FPI_FOR_HINT , blkref #0: rel 1663/8786419/8843923 blk 1950388 FPW rmgr: XLOG len (rec/tot): 49/ 7885, tx: 0, lsn: 115/5AFEF160, prev 115/5AFED278, desc: FPI_FOR_HINT , blkref #0: rel 1663/8786419/8843923 blk 1950387 FPW rmgr: XLOG len (rec/tot): 49/ 7885, tx: 0, lsn: 115/5AFF1048, prev 115/5AFEF160, desc: FPI_FOR_HINT , blkref #0: rel 1663/8786419/8843923 blk 1950389 FPW rmgr: XLOG len (rec/tot): 49/ 7885, tx: 0, lsn: 115/5AFF2F30, prev 115/5AFF1048, desc: FPI_FOR_HINT , blkref #0: rel 1663/8786419/8843923 blk 1950390 FPW rmgr: XLOG len (rec/tot): 49/ 7885, tx: 0, lsn: 115/5AFF4E18, prev 115/5AFF2F30, desc: FPI_FOR_HINT , blkref #0: rel 1663/8786419/8843923 blk 1950391 FPW rmgr: XLOG len (rec/tot): 49/ 7885, tx: 0, lsn: 115/5AFF6D00, prev 115/5AFF4E18, desc: FPI_FOR_HINT , blkref #0: rel 1663/8786419/8843923 blk 1950392 FPW rmgr: XLOG len (rec/tot): 49/ 7885, tx: 0, lsn: 115/5AFF8BE8, prev 115/5AFF6D00, desc: FPI_FOR_HINT , blkref #0: rel 1663/8786419/8843923 blk 1950393 FPW rmgr: XLOG len (rec/tot): 49/ 7885, tx: 0, lsn: 115/5AFFAAD0, prev 115/5AFF8BE8, desc: FPI_FOR_HINT , blkref #0: rel 1663/8786419/8843923 blk 1950397 FPW rmgr: XLOG len (rec/tot): 49/ 7885, tx: 0, lsn: 115/5AFFC9B8, prev 115/5AFFAAD0, desc: FPI_FOR_HINT , blkref #0: rel 1663/8786419/8843923 blk 1950394 FPW 根据 relnode 的信息 1663/8786419/8843923: 我们可以定位到对象: app_tapp_notification.t_notification_send_record
db_tapp=# SELECT * , pg_relation_filepath(oid) FROM pg_class where pg_relation_filepath(oid) like '%8843923%'; oid | relname | relnamespace | reltype | reloftype | relowner | relam | relfilenode | reltablespace | relpages | reltuples | relallvisible | reltoastrelid | relhasindex | relisshared | relpersistence | relkind | relnatts | relchecks | relhasr ules | relhastriggers | relhassubclass | relrowsecurity | relforcerowsecurity | relispopulated | relreplident | relispartition | relrewrite | relfrozenxid | relminmxid | relacl | reloptions | relpa rtbound | pg_relation_filepath ---------+----------------------------+--------------+---------+-----------+----------+-------+-------------+---------------+----------+---------------+---------------+---------------+-------------+-------------+----------------+---------+----------+-----------+-------- -----+----------------+----------------+----------------+---------------------+----------------+--------------+----------------+------------+--------------+------------+---------------------------------------------------------------------------------+------------+------ --------+---------------------- 8843923 | t_notification_send_record | 8843893 | 8843925 | 0 | 8786421 | 2 | 8843923 | 0 | 10540222 | 1.0176233e+08 | 0 | 8843934 | t | f | p | r | 23 | 0 | f | f | f | f | f | t | d | f | 0 | 166107848 | 87151 | {tapprw=arwdDxt/tapprw,tappro=r/tapprw,tappro_po=r/tapprw,tapp_dst_ro=r/tapprw} | | | base/8786419/8843923 业务上来说,这个表是个超级大表,记录APP推送消息的内容。
db_tapp=# select db_tapp-# schemaname, db_tapp-# relname, db_tapp-# n_live_tup, db_tapp-# n_dead_tup, db_tapp-# to_char(COALESCE(last_vacuum,null,'1900-01-01'),'YYYY-MM-DD hh24:mi:SS') as last_vacuum, db_tapp-# to_char(COALESCE(last_autovacuum,'1900-01-01'),'YYYY-MM-DD hh24:mi:SS') as last_autovacuum, db_tapp-# to_char(COALESCE(last_analyze,'1900-01-01'),'YYYY-MM-DD hh24:mi:SS') as last_analyze, db_tapp-# to_char(COALESCE(last_autoanalyze,'1900-01-01'),'YYYY-MM-DD hh24:mi:SS') as last_autoanalyze, db_tapp-# vacuum_count, db_tapp-# autovacuum_count, db_tapp-# analyze_count, db_tapp-# autoanalyze_count from pg_stat_user_tables where relname = 't_notification_send_record'; schemaname | relname | n_live_tup | n_dead_tup | last_vacuum | last_autovacuum | last_analyze | last_autoanalyze | vacuum_count | autovacuum_count | analyze_count | autoanalyze_count -----------------------+----------------------------+------------+------------+---------------------+---------------------+---------------------+---------------------+--------------+------------------+---------------+------------------- app_tapp_notification | t_notification_send_record | 108667382 | 79759 | 1900-01-01 00:00:00 | 1900-01-01 00:00:00 | 1900-01-01 00:00:00 | 2023-01-11 10:09:42 | 0 | 0 | 0 | 5 (1 row) 我们再来统计一下 WAL 日志里面的类型汇总 : ./pg_waldump ./wal/00000001000001120000004E -z
发现都是 full page writes (FPI ) , 写的都是: FPI_FOR_HINT 是表里面每条记录 hint的标记。 这个与参数 wal_log_hints 参数有关,开启这个参数后会写WAL里面写入额外日志信息。

我们去这个业务表上查询一下,是否有大量的插入和更新操作:
结果大大的出乎了我们的意料, 并没有存在大量的insert,update的操作。 只有600多条记录时今天insert或者update的记录。
db_tapp=# select count(1) from app_tapp_notification.t_notification_send_record where cdate > to_date('2023-03-31','YYYY-MM-DD'); count ------- 617 (1 row) db_tapp=# select count(1) from app_tapp_notification.t_notification_send_record where edate > to_date('2023-03-31','YYYY-MM-DD'); count ------- 623 (1 row) 于是找到开发,咨询了一下上午是不是有什么业务发生了:

得到了结论开发执行了 select count(*) from app_tapp_notification.t_notification_send_record.
app_tapp_notification.t_notification_send_record 这个表的数据量大致是 1亿多:
那么问题来了,主库查询大表 select count(*) 是否会产生大量的WAL日志呢?
ORACLE,MYSQL DBA的思维是 不可能的…
难道PG有这个问题? PG和ORACLE,MYSQL的最大区别就是 MVCC的机制。。。潜意识中似乎问题在这个大方向上。。。。
继续GOOGLE 一下: 看看有没有类似的文章.
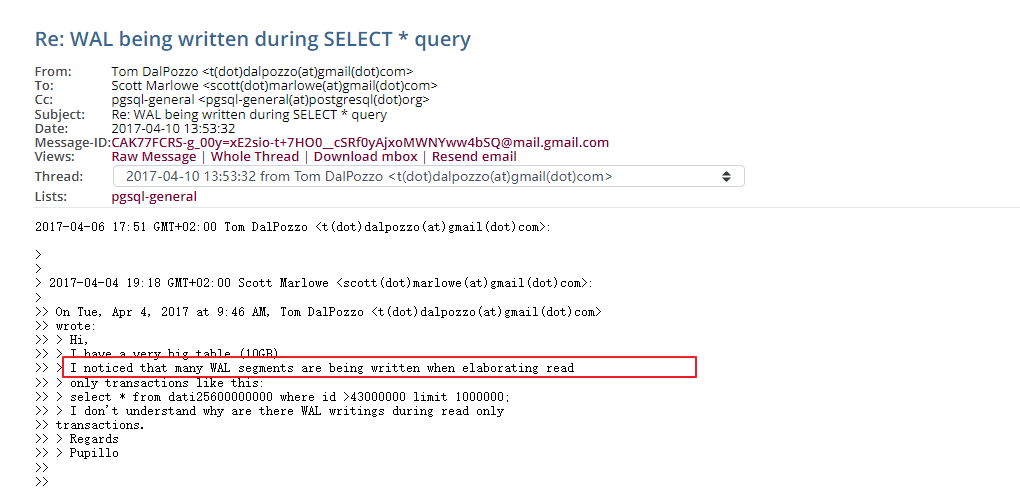
果然有人遇到了类似的情况:
https://www.postgresql.org/message-id/CAK77FCRS-g_00y%3DxE2sio-t%2B7HO0__cSRf0yAjxoMWNYww4bSQ%40mail.gmail.com
而且这个问题还有一个专业术语叫 hint bits:

我们查看一下 wiki: https://wiki.postgresql.org/wiki/Hint_Bits
select count(* ) 果然会更新 Hint bits :will update its hint bits to match the commit/abort status of the inserting/deleting transaction(s) as of the instant of the examination. A plain SELECT, count(*), or VACUUM on the entire table will check every tuple for visibility and set its hint bits.

这个hint bits 是由于我们开启了参数 wal_log_hints = on , 从而在每条元祖上记录了额外的记录
src/include/access/htup_details.h #define HEAP_XMIN_COMMITTED 0x0100 /* t_xmin committed 256 */ #define HEAP_XMIN_INVALID 0x0200 /* t_xmin invalid/aborted 512 */ #define HEAP_XMAX_COMMITTED 0x0400 /* t_xmax committed 1024 */ #define HEAP_XMAX_INVALID 0x0800 /* t_xmax invalid/aborted 2048 */ 
最后我们做一个实验在测试环境复现一下这个问题:
我们先关闭参数 wal_log_hints:
postgres@[local:/tmp]:2004=#34126 show wal_log_hints ; wal_log_hints --------------- on (1 row) postgres@[local:/tmp]:2004=#34126 select context from pg_settings where name = 'wal_log_hints'; context ------------ postmaster (1 row) postgres@[local:/tmp]:2004=#34126 alter system set wal_log_hints='off'; ALTER SYSTEM postgres@[local:/tmp]:2004=#34126 exit; 重启数据库生效:
/opt/postgreSQL/pg12/bin/pg_ctl -D /data/postgreSQL/2004/data restart 我们来创建一张大表:目标5000万的数据
postgres@[local:/tmp]:2004=#40524 create table tab_log_hint_off(id int, name varchar(200)); CREATE TABLE postgres@[local:/tmp]:2004=#40524 insert into tab_log_hint_off select generate_series(1,50000000),'jason'; INSERT 0 50000000 我们记录一下当前的WAL LOG的日志量列表: 当前的日志是 000000050000000100000045
-rw------- 1 postgres postgres 16M Mar 31 16:26 000000050000000100000044 drwx------ 2 postgres postgres 8.0K Mar 31 16:26 archive_status -rw------- 1 postgres postgres 16M Mar 31 16:26 000000050000000100000045 我们执行一下 select count(1):
postgres@[local:/tmp]:2004=#54829 show wal_log_hints; wal_log_hints --------------- off (1 row) postgres@[local:/tmp]:2004=#53719 select count(*) from tab_log_hint_off; count ---------- 50000000 (1 row) postgres@[local:/tmp]:2004=#53719 exit; INFRA [postgres@wqdcsrv3352 pg_wal]# ls -lhtr -rw------- 1 postgres postgres 16M Mar 31 16:26 000000050000000100000044 drwx------ 2 postgres postgres 8.0K Mar 31 16:26 archive_status -rw------- 1 postgres postgres 16M Mar 31 16:26 000000050000000100000045 我们来观察一下 000000050000000100000045 这个日志: 并没有出现 FPI_FOR_HINT

我们修改参数 wal_log_hints=on, 重启数据库:
postgres@[local:/tmp]:2004=#54829 alter system set wal_log_hints=on; ALTER SYSTEM INFRA [postgres@wqdcsrv3352 archive_wals]# /opt/postgreSQL/pg12/bin/pg_ctl -D /data/postgreSQL/2004/data restart 重启数据库会触发checkpoint 操作, 自动切换到下一个WAL: 生成新的000000050000000100000046
-rw------- 1 postgres postgres 16M Mar 31 16:28 000000050000000100000045 drwx------ 2 postgres postgres 8.0K Mar 31 16:28 archive_status -rw------- 1 postgres postgres 16M Mar 31 16:28 000000050000000100000046 再次执行一下 select count(1) ,
postgres@[local:/tmp]:2004=#65250 show wal_log_hints; wal_log_hints --------------- on (1 row) postgres@[local:/tmp]:2004=#65250 select count(*) from tab_log_hint_off; count ---------- 50000000 (1 row) 观察 WAL日志时候: 发现文件的最后修改时间变化了 证明有WAL log 记录写入
-rw------- 1 postgres postgres 16M Mar 31 16:47 000000050000000100000046 我们来分析一下 000000050000000100000046 的内容: 出现了大量的FPI_FOR_HINT 是符合我们的预期的


最后总结一下:
1)开启参数wal_log_hints = on,会触发写 hint bits, 从而产生额外的WAL日志。
这个参数wal_log_hints 开启的目的一般就是使用pg_rewind 重建standby数据库。 如果可以接受stanby 全部重建,可以不用pg_rewind,也就不需要开启这个参数wal_log_hints。 (默认值是OFF)
2)如果确实是需要pg_rewind这个操作,只能适当调大 WAL相关的参数:
max_wal_size + wal_keep_segments * wal_segment_size (P12以及之前的版本)
max_wal_size + wal_keep_size (P13以及之后的版本)
或者 适当调大checkpoint 的时间,让full page writes 写的频率稍微慢一些, 起到一定的缓解作用。
3)开启压缩WAL模式: wal_compression = on , 这个参数会压缩WAL日志,从而会节省了WAL的空间和网络传输带宽的流量,带来的副作用是CPU会有额外的消耗,
建议在开启这个参数之前,做一下性能测试的监控,确认开启后是否可以满足生产的要求
4)在从库上进行 select count(*), select * from 全表,大表等操作。最好是有一个独立的 standby database 作为独立查询节点。
Have a fun ? !
转载自:https://www.modb.pro/db/621695