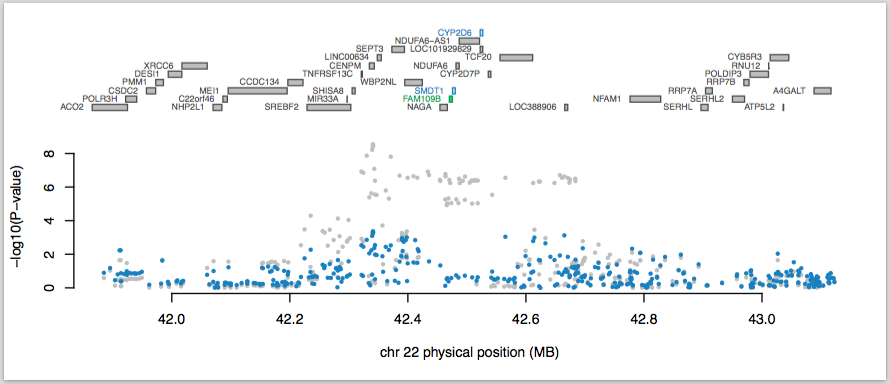
The top panel shows all of the genes in the locus. The marginally TWAS associated genes are highlighted in blue, and those that are jointly significant (in this case, FAM109B) highlighted in green. The statistics for the jointly significant genes are reported in the file PGC2.SCZ.TWAS.22.top.analysis.joint_included.dat (which contains the joint estimates and p-values) and the statistics for those genes that were dropped due to being conditionally non-significant are in the corresponding *.joint_dropped.dat file (which contains the conditional estimates and p-values).
The bottom panel shows a Manhattan plot of the GWAS data before (gray) and after (blue) conditioning on the green genes. You can see that this locus goes from being genome-wide significant to non-significant after conditioning on the predicted expression of FAM109B.
蓝色和绿色基因均是通过TWAS鉴定出来的与GWAS相关的基因
灰色点表示原始的 GWAS P 值
蓝色点表示校正了绿色基因后的 GWAS P 值
如图所示,经校正后。灰色的点变成了蓝色点(显著变为不显著),说明绿色基因影响了GWAS表型。