引言
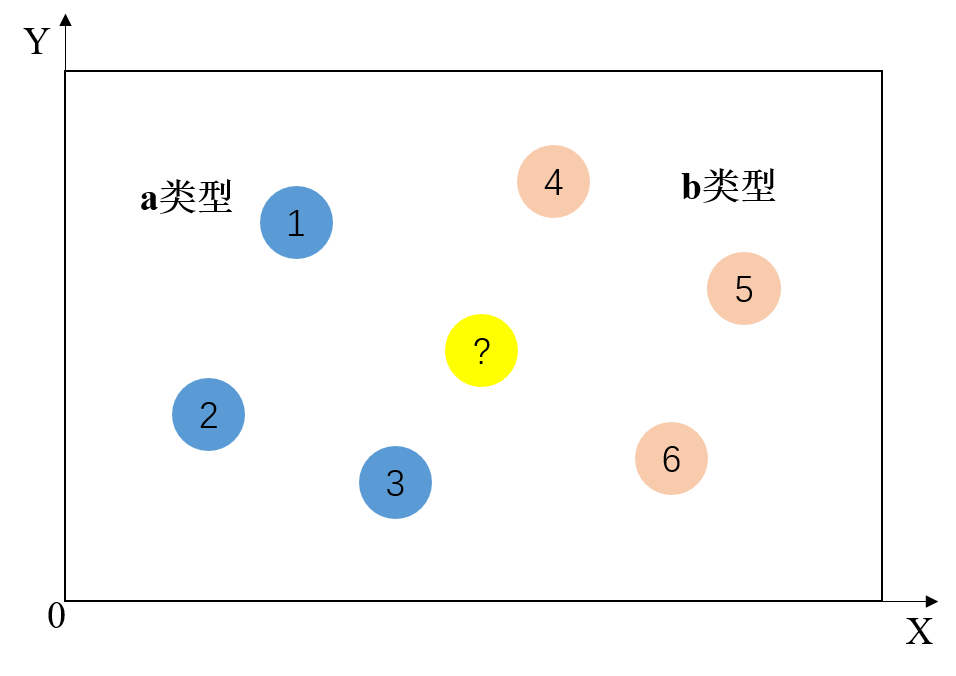
K近邻算法介绍
一个样本在特征空间中的k个最相似(即特征空间中最邻近)的样本中的大多数属于某一个类别,那么该样本也属于这个类别
求两点之间的距离,看距离谁是最近的,以此来区分我们要预测的这个数据是属于哪个分类
距离的表示
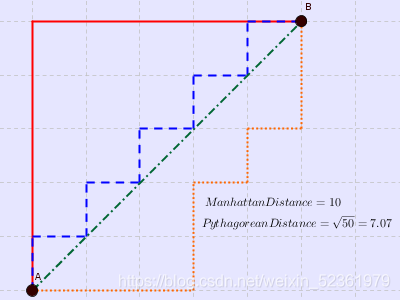
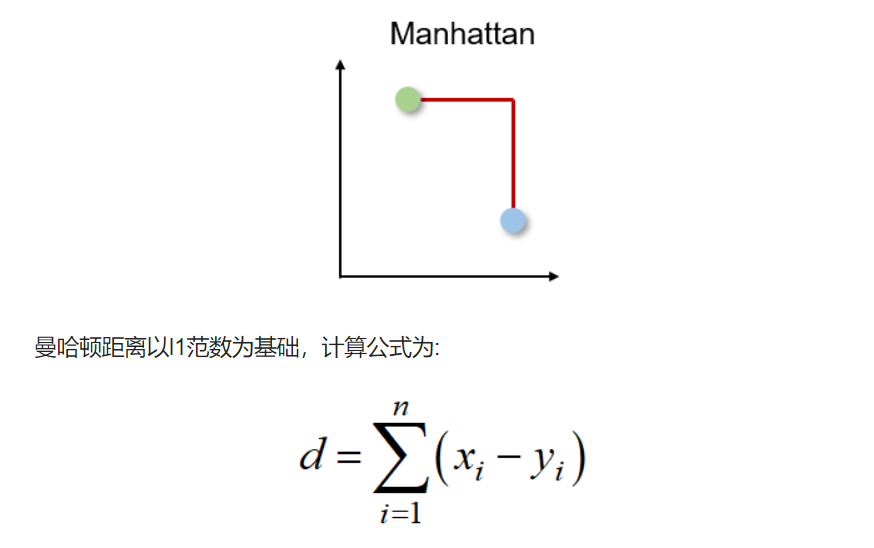
曼哈顿距离
出租车或城市街区距离
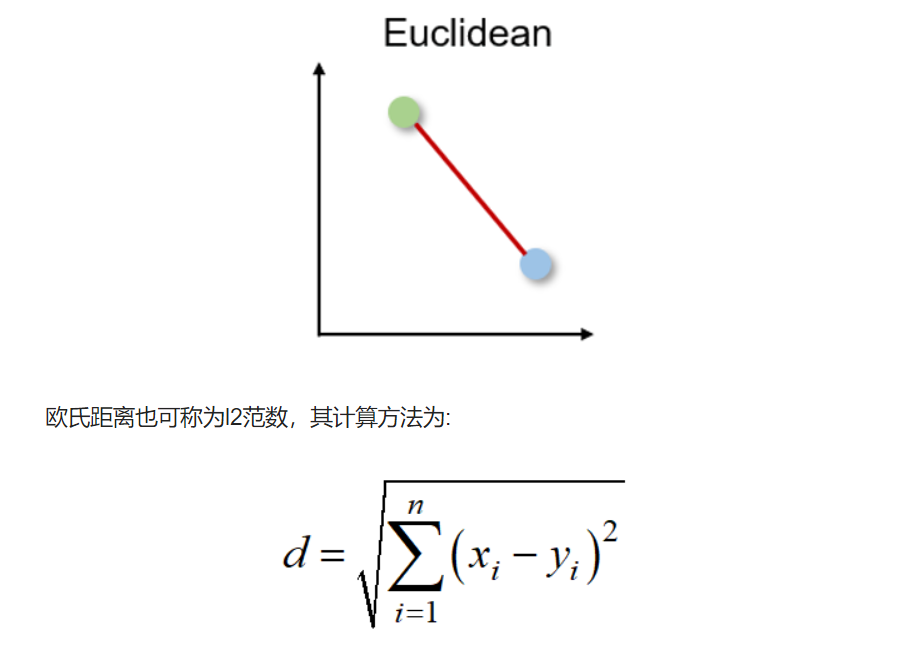
欧氏距离
两个向量之间的最短距离
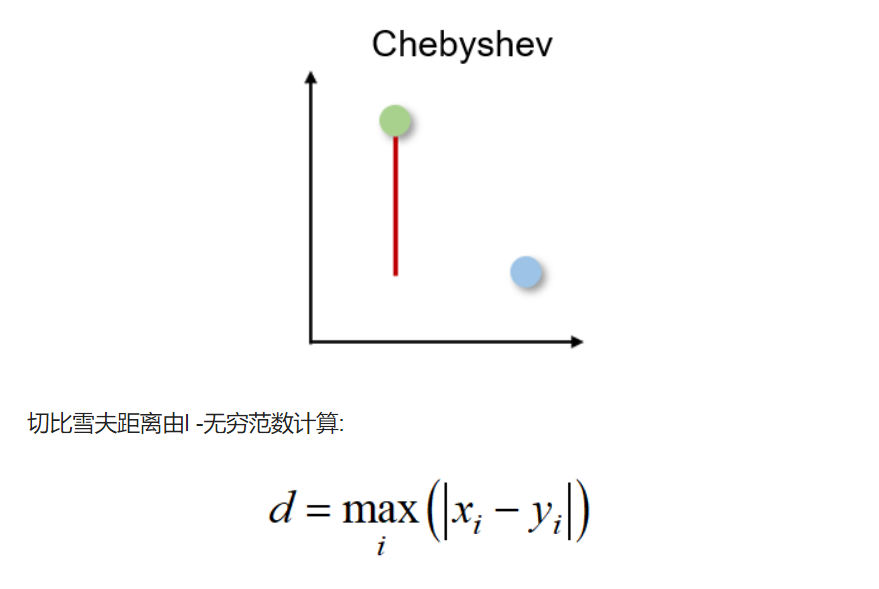
切比雪夫距离
也称为棋盘距离,因为它是两个实值向量之间任意维度上的最大距离。 它通常用于仓库物流中,其中最长的路径决定了从一个点到另一个点所需的时间。
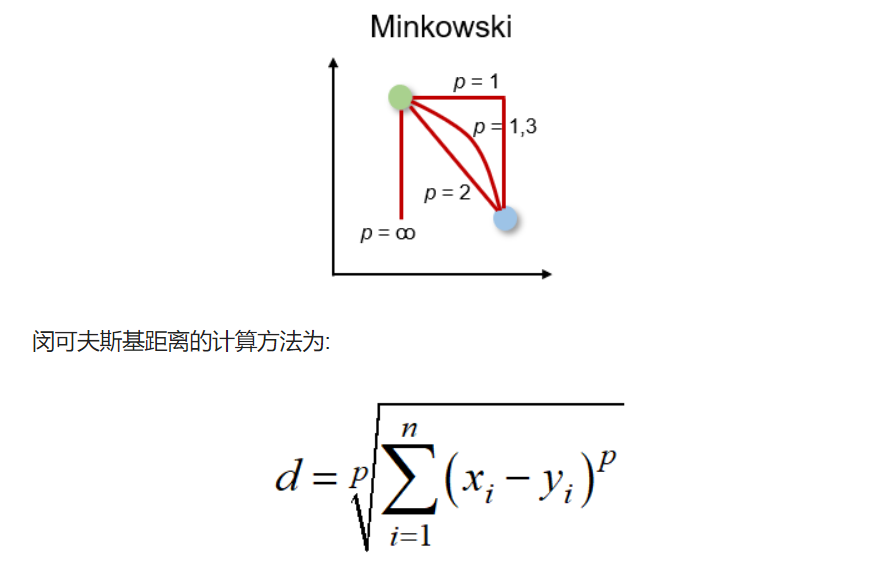
闵可夫斯基距离
高维时空的距离度量
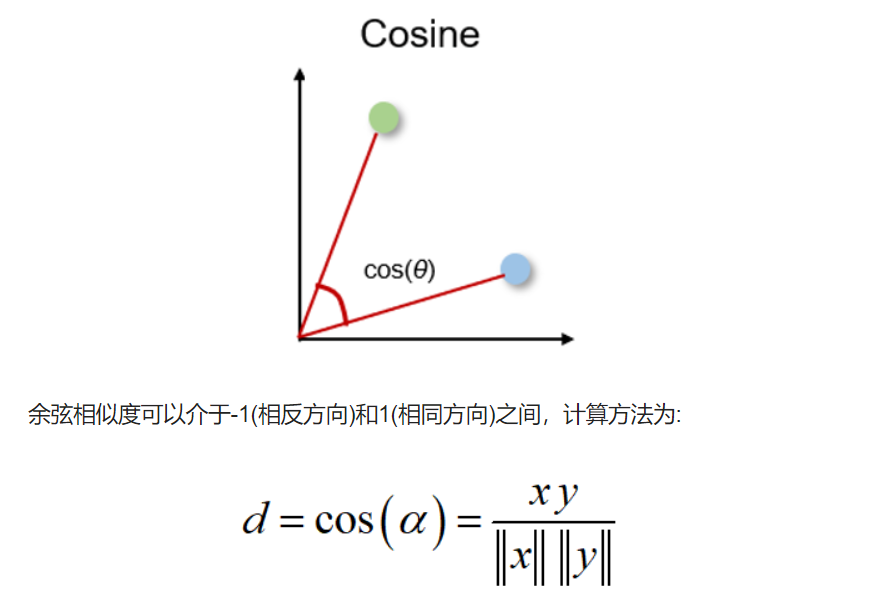
余弦相似度
余弦相似度是方向的度量,他的大小由两个向量之间的余弦决定,并且忽略了向量的大小。 余弦相似度通常用于与数据大小无关紧要的高维,例如,推荐系统或文本分析。
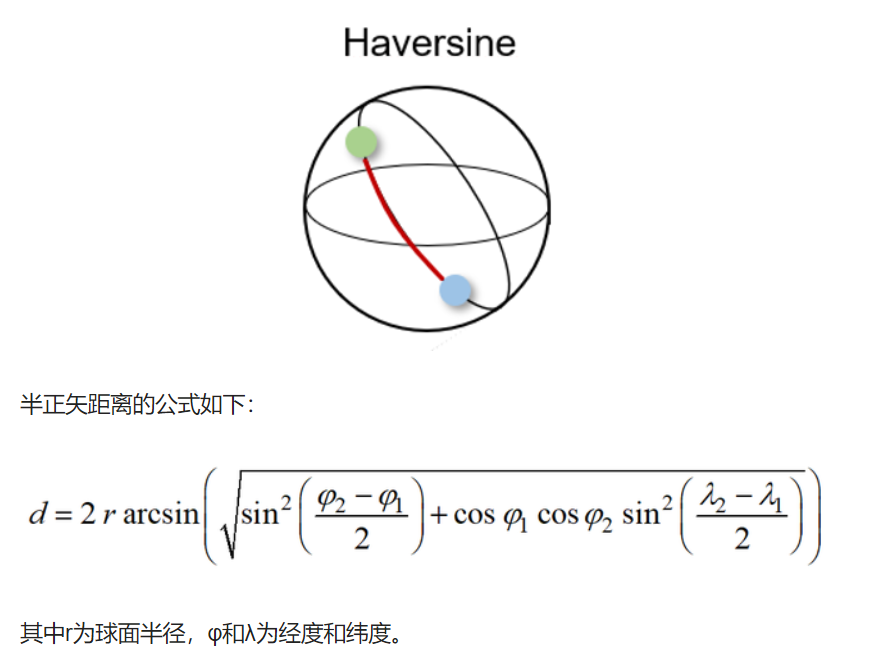
半正矢距离 Haversine distance
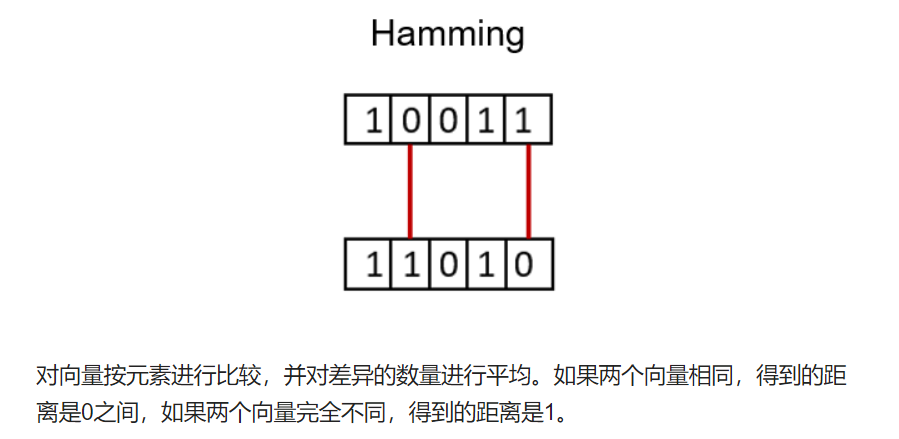
Hamming Distance
衡量两个二进制向量或字符串之间的差异
如果两个向量相同,得到的距离是0之间,如果两个向量完全不同,得到的距离是1
局限性:不能给出差异的大小
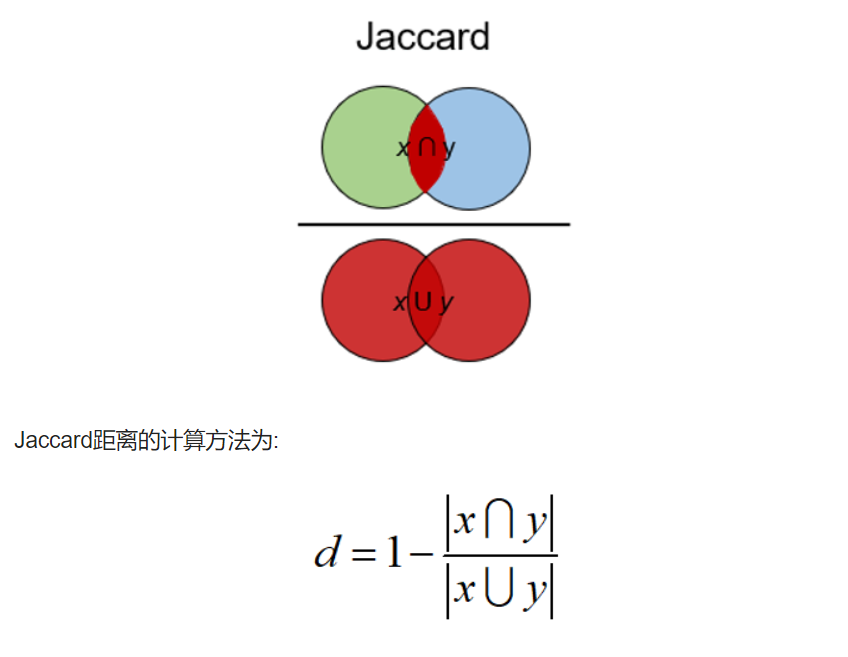
Jaccard Index
确定两个样本集之间的相似性。 它反映了与整个数据集相比存在多少一对一匹配。
Jaccard指数通常用于二进制数据比如图像识别的深度学习模型的预测与标记数据进行比较,或者根据单词的重叠来比较文档中的文本模式。
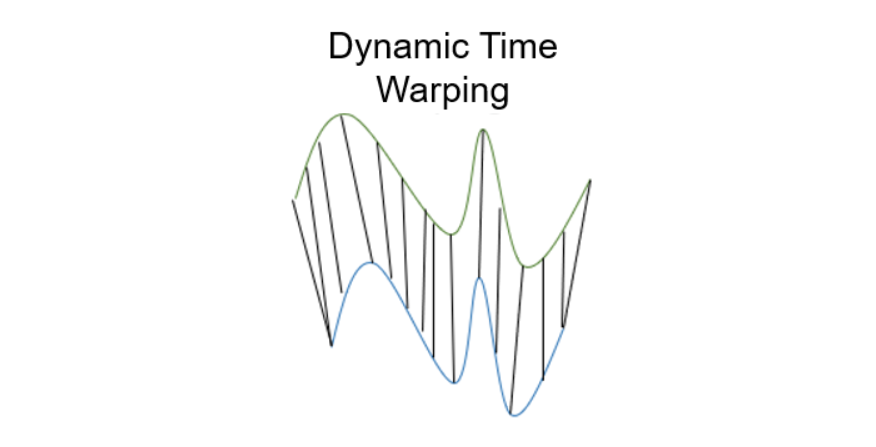
Dynamic Time Warping
动态时间规整是测量两个不同长度时间序列之间距离的一种重要方法。可以用于所有时间序列数据的用例,如语音识别或异常检测。
葡萄酒KNN聚类
基础知识
Alchole:乙醇含量的体积百分比
每100毫升的溶液中,溶质的体积:溶质的量(mol)/溶液体积(L)
Malic Acid:苹果酸
酸味强烈,刺激性强,具有一定的水果香气。葡萄酒中苹果酸来自于葡萄本身。
Ash:灰分含量
葡萄酒中的灰分是指在酒液中残留的无机物质。这些物质来自于葡萄及其种皮等原料的残渣以及酿造过程中使用的除酒精以外的溶剂和附加物,如硫酸盐和酸类等。
灰分含量在葡萄酒的质量和口感方面起着重要作用。适量的灰分可以增加酒液的稳定性和保质期,同时也能够提高酒液的色泽和口感。但过高的灰分含量可能会对酒液的质量产生不良影响,导致酒液发生变质或变得苦涩或刺激口感。因此,酿酒师需要控制灰分含量,以保证葡萄酒的质量和口感。
Alcalinity of ash:灰分碱度
葡萄酒中的灰分碱度是指葡萄酒中无机盐(即灰分)所带来的酸碱度影响。碱度越高,表示葡萄酒中的灰分含量和质量越高。
灰分碱度对葡萄酒的质量和口感同样非常重要。一般情况下,适度的灰分碱度可以提高葡萄酒的稳定性和保质期,同时也能够增加酒液的颜色和口感。但是,高碱度的葡萄酒可能会有刺激口感、涩味等问题,降低了葡萄酒的品质。因此,酿酒师需要在葡萄采摘和酿造过程中控制灰分含量和碱度,以保证葡萄酒的品质和口感。
Magnesium:镁
葡萄酒中的镁是一种微量元素,虽然含量很少,但它对葡萄酒的品质和口感有着重要的影响:
-
提升葡萄酒的口感和顺滑度:镁能够增加葡萄酒的结构和口感的平衡性,使其更加柔和和顺滑。
-
改善葡萄酒的质量和口感:适量地添加镁可以提高葡萄酒的口感和质量,同时还可以降低酸度和苦味,使葡萄酒更加平衡和优雅。
-
促进酒中其他成分的释放:镁可以促进葡萄酒中其它微量元素的释放,从而提高它们的效果。
Total phenols:总酚
-
抗氧化:总酚是一种天然的抗氧化剂,能够保护葡萄酒中的其他成分免受氧化作用的破坏,从而延长葡萄酒的保存时间和品质。它可以减轻自由基对葡萄酒的影响,防止葡萄酒退色和变质。
-
增强体力:总酚还对人体有益处。其中一些物质是天然的抗氧化剂,能够通过保护人体细胞抵御疾病和减轻炎症的影响。此外,它还可以提高人体的免疫力,并为人体提供额外的动力。
-
调节口感:总酚还可以影响葡萄酒的口感和芳香。如果葡萄酒中的总酚含量较高,则口感将会更加平衡和柔和,并且会有一个更加浓郁的气味和味道。
flavanoids:黄酮类化合物
黄酮类化合物是葡萄酒中的一种天然营养物质,它们属于多酚类物质,具有非常强的抗氧化性质:
-
增强免疫力:黄酮类化合物可以增强身体免疫力,在人体内具有抗炎和抗氧化作用。它们可以帮助身体应对感染病毒和其他有害细菌的攻击。
-
抗氧化:黄酮类化合物是一种天然的抗氧化剂,可以防止自由基对葡萄酒和人体的氧化作用,从而保护细胞免受损害。这可以减缓老化过程、预防癌症以及其他疾病。
-
保护心脏:黄酮类化合物可以降低血液中的胆固醇水平,减少动脉硬化的风险。这些化合物还能够降低血液中的血小板凝集程度,从而降低心脏病和中风的风险。
-
改善认知能力:黄酮类化合物还可以改善人类的认知能力。它们可以促进神经元的生长,从而增强记忆和学习能力。
大豆含有黄酮类化合物,特别是大豆异黄酮,它是一种植物雌激素,在大豆中的含量比较高。大豆异黄酮具有许多生物活性作用,例如抗氧化、抗肿瘤、降低高血压、降低胆固醇等。这些作用可以对人体健康产生积极影响,尤其是对女性的健康。研究表明,大豆异黄酮可以减轻更年期症状、防止乳腺癌、卵巢癌、子宫内膜癌等女性疾病的发生。此外,大豆异黄酮也有助于预防骨质疏松症和心脑血管疾病的发生。
nonflavanoid phenols:多酚类化合物
多酚类化合物,包括各种酚酸、酪醇和香豆素等。
-
抗氧化作用:具有很强的抗氧化作用,能够有效地清除体内的自由基,减少氧化应激,预防衰老和各种疾病。
-
抗炎作用:能够抑制炎症反应的发生,减轻炎症对人体的损害。
-
改善血液循环:可以促进血液循环,增加血管弹性和稳定性,预防心血管疾病的发生。
-
降低胆固醇:能够降低血液中的胆固醇水平,预防动脉硬化和心血管疾病的发生。
proanthocyanins:花青素
一种多酚类化合物,具有多种生物活性:
-
抗氧化作用:清除自由基,减少氧化应激,保护细胞免受氧化损伤。
-
改善心血管健康:减少血浆中的低密度脂蛋白胆固醇(LDL-C)水平,增加高密度脂蛋白胆固醇(HDL-C)水平,从而降低心血管疾病(如冠心病、高血压)的发病风险。
-
抗炎作用:抑制体内的炎症反应,减轻炎症对身体的损害。
-
抗肿瘤作用:抑制某些癌细胞的增殖和转移,具有抗肿瘤的作用。
还具有保护视网膜、增强免疫力、抵抗病毒等多种生物活性。
color_intensity:颜色强度
颜色强度是描述葡萄酒颜色深浅的一个指标,通常根据观察葡萄酒时穿透光线的程度来进行判断。颜色强度通常分为四个等级:
浅色:颜色淡,通常为淡黄色、淡绿色、淡粉色等。
中等色:颜色适中,通常为桔黄色、深黄色、浅紫色等。
深色:颜色较深,通常为深黄色、深紫色、深红色等。
极深色:颜色极浓,通常为暗红色、黑紫色、棕黑色等。
葡萄品种,酿造年份
hue:色调
葡萄酒的色调是由色素和其他化合物的存在和相对浓度所决定的。葡萄酒的色调可以影响人们对葡萄酒的感官体验,以及对葡萄酒的品质和特征的判断。
-
表示葡萄酒的品种和产地。不同品种和产地的葡萄酒具有不同的颜色,因此可以用色调来判断葡萄酒的品种和产地。
-
提供葡萄酒的质量和年份的线索。不同年份和质量的葡萄酒具有不同的色调,可以通过色调判断葡萄酒的成熟程度、保存状况和质量。
-
影响葡萄酒的口感和风味。颜色深的葡萄酒通常具有较强的单宁和酸度,口感较重,而颜色浅的葡萄酒通常具有较轻盈和清爽的口感。
因此,葡萄酒的色调不仅是鉴别和评价葡萄酒的重要标准,同时还可以帮助人们更好地了解葡萄酒的品种、产地、年份和口感。
od280/od315_of_diluted_wines:稀释葡萄酒样品的光密度比值
稀释葡萄酒样品的光密度比值是为了确定葡萄酒中酒精、酸度等成分的浓度。在测定葡萄酒样品的光密度之前,通常需要将样品进行适当的稀释,以使光密度值在光谱仪的检测范围之内并且在合理的精度范围内。
步骤:
-
准备一系列已知比例的稀释液,用蒸馏水或其他适当的溶液进行稀释。
-
取一定量的葡萄酒样品,加入稀释液中,按比例混合均匀。
-
将稀释后的葡萄酒样品分别置于光谱仪中进行测量。
-
记录测得的光密度值,并计算出稀释的比例和相应的光密度比值。
需要注意的是,当稀释液的稀释比例过高时,会导致光密度值过小,难以测定;而当稀释比例过低时,则会导致光密度值过大,无法读取。因此,在稀释时需要根据样品的浓度和光谱仪的检测范围选择合适的稀释比例。
proline:脯氨酸含量
脯氨酸是葡萄酒中重要的氨基酸之一,其含量通常用于评价葡萄酒的品质。脯氨酸的含量受到多种因素的影响,如葡萄品种、气候环境、酿造工艺等。因此,不同品种和产地的葡萄酒中脯氨酸含量也会有所差异。
根据文献报道,葡萄酒中脯氨酸的含量一般在150-400 mg/L之间。其中,白葡萄酒的脯氨酸含量通常较红葡萄酒低。
测定葡萄酒中脯氨酸含量的方法主要有高效液相色谱法(HPLC)、气相色谱法(GC)等,这些方法需要使用特殊仪器和试剂,对于一般的消费者并不容易实施。因此,如果您需要了解一瓶葡萄酒中脯氨酸的含量,建议查找其产地、酿造工艺等相关信息,或咨询专业品酒师和酿酒师的意见。
KNN聚类
from sklearn import datasets
wine = datasets.load_wine()  # 获取葡萄酒数据
wine
{'data': array([[1.423e+01, 1.710e+00, 2.430e+00, ..., 1.040e+00, 3.920e+00,
         1.065e+03],
        [1.320e+01, 1.780e+00, 2.140e+00, ..., 1.050e+00, 3.400e+00,
         1.050e+03],
        [1.316e+01, 2.360e+00, 2.670e+00, ..., 1.030e+00, 3.170e+00,
         1.185e+03],
        ...,
        [1.327e+01, 4.280e+00, 2.260e+00, ..., 5.900e-01, 1.560e+00,
         8.350e+02],
        [1.317e+01, 2.590e+00, 2.370e+00, ..., 6.000e-01, 1.620e+00,
         8.400e+02],
        [1.413e+01, 4.100e+00, 2.740e+00, ..., 6.100e-01, 1.600e+00,
         5.600e+02]]),
 'target': array([0, 0, 0, 0, 0, 0, 0, 0, 0, 0, 0, 0, 0, 0, 0, 0, 0, 0, 0, 0, 0, 0,
        0, 0, 0, 0, 0, 0, 0, 0, 0, 0, 0, 0, 0, 0, 0, 0, 0, 0, 0, 0, 0, 0,
        0, 0, 0, 0, 0, 0, 0, 0, 0, 0, 0, 0, 0, 0, 0, 1, 1, 1, 1, 1, 1, 1,
        1, 1, 1, 1, 1, 1, 1, 1, 1, 1, 1, 1, 1, 1, 1, 1, 1, 1, 1, 1, 1, 1,
        1, 1, 1, 1, 1, 1, 1, 1, 1, 1, 1, 1, 1, 1, 1, 1, 1, 1, 1, 1, 1, 1,
        1, 1, 1, 1, 1, 1, 1, 1, 1, 1, 1, 1, 1, 1, 1, 1, 1, 1, 1, 1, 2, 2,
        2, 2, 2, 2, 2, 2, 2, 2, 2, 2, 2, 2, 2, 2, 2, 2, 2, 2, 2, 2, 2, 2,
        2, 2, 2, 2, 2, 2, 2, 2, 2, 2, 2, 2, 2, 2, 2, 2, 2, 2, 2, 2, 2, 2,
        2, 2]),
 'frame': None,
 'target_names': array(['class_0', 'class_1', 'class_2'], dtype='<U7'),
 'DESCR': '.. _wine_dataset:\n\nWine recognition dataset\n------------------------\n\n**Data Set Characteristics:**\n\n    :Number of Instances: 178\n    :Number of Attributes: 13 numeric, predictive attributes and the class\n    :Attribute Information:\n \t\t- Alcohol\n \t\t- Malic acid\n \t\t- Ash\n\t\t- Alcalinity of ash  \n \t\t- Magnesium\n\t\t- Total phenols\n \t\t- Flavanoids\n \t\t- Nonflavanoid phenols\n \t\t- Proanthocyanins\n\t\t- Color intensity\n \t\t- Hue\n \t\t- OD280/OD315 of diluted wines\n \t\t- Proline\n\n    - class:\n            - class_0\n            - class_1\n            - class_2\n\t\t\n    :Summary Statistics:\n    \n    ============================= ==== ===== ======= =====\n                                   Min   Max   Mean     SD\n    ============================= ==== ===== ======= =====\n    Alcohol:                      11.0  14.8    13.0   0.8\n    Malic Acid:                   0.74  5.80    2.34  1.12\n    Ash:                          1.36  3.23    2.36  0.27\n    Alcalinity of Ash:            10.6  30.0    19.5   3.3\n    Magnesium:                    70.0 162.0    99.7  14.3\n    Total Phenols:                0.98  3.88    2.29  0.63\n    Flavanoids:                   0.34  5.08    2.03  1.00\n    Nonflavanoid Phenols:         0.13  0.66    0.36  0.12\n    Proanthocyanins:              0.41  3.58    1.59  0.57\n    Colour Intensity:              1.3  13.0     5.1   2.3\n    Hue:                          0.48  1.71    0.96  0.23\n    OD280/OD315 of diluted wines: 1.27  4.00    2.61  0.71\n    Proline:                       278  1680     746   315\n    ============================= ==== ===== ======= =====\n\n    :Missing Attribute Values: None\n    :Class Distribution: class_0 (59), class_1 (71), class_2 (48)\n    :Creator: R.A. Fisher\n    :Donor: Michael Marshall (MARSHALL%PLU@io.arc.nasa.gov)\n    :Date: July, 1988\n\nThis is a copy of UCI ML Wine recognition datasets.\nhttps://archive.ics.uci.edu/ml/machine-learning-databases/wine/wine.data\n\nThe data is the results of a chemical analysis of wines grown in the same\nregion in Italy by three different cultivators. There are thirteen different\nmeasurements taken for different constituents found in the three types of\nwine.\n\nOriginal Owners: \n\nForina, M. et al, PARVUS - \nAn Extendible Package for Data Exploration, Classification and Correlation. \nInstitute of Pharmaceutical and Food Analysis and Technologies,\nVia Brigata Salerno, 16147 Genoa, Italy.\n\nCitation:\n\nLichman, M. (2013). UCI Machine Learning Repository\n[https://archive.ics.uci.edu/ml]. Irvine, CA: University of California,\nSchool of Information and Computer Science. \n\n.. topic:: References\n\n  (1) S. Aeberhard, D. Coomans and O. de Vel, \n  Comparison of Classifiers in High Dimensional Settings, \n  Tech. Rep. no. 92-02, (1992), Dept. of Computer Science and Dept. of  \n  Mathematics and Statistics, James Cook University of North Queensland. \n  (Also submitted to Technometrics). \n\n  The data was used with many others for comparing various \n  classifiers. The classes are separable, though only RDA \n  has achieved 100% correct classification. \n  (RDA : 100%, QDA 99.4%, LDA 98.9%, 1NN 96.1% (z-transformed data)) \n  (All results using the leave-one-out technique) \n\n  (2) S. Aeberhard, D. Coomans and O. de Vel, \n  "THE CLASSIFICATION PERFORMANCE OF RDA" \n  Tech. Rep. no. 92-01, (1992), Dept. of Computer Science and Dept. of \n  Mathematics and Statistics, James Cook University of North Queensland. \n  (Also submitted to Journal of Chemometrics).\n',
 'feature_names': ['alcohol',
  'malic_acid',
  'ash',
  'alcalinity_of_ash',
  'magnesium',
  'total_phenols',
  'flavanoids',
  'nonflavanoid_phenols',
  'proanthocyanins',
  'color_intensity',
  'hue',
  'od280/od315_of_diluted_wines',
  'proline']}
print(wine['DESCR'])
.. _wine_dataset:

Wine recognition dataset
------------------------

**Data Set Characteristics:**

    :Number of Instances: 178
    :Number of Attributes: 13 numeric, predictive attributes and the class
    :Attribute Information:
 		- Alcohol
 		- Malic acid
 		- Ash
		- Alcalinity of ash
 		- Magnesium
		- Total phenols
 		- Flavanoids
 		- Nonflavanoid phenols
 		- Proanthocyanins
		- Color intensity
 		- Hue
 		- OD280/OD315 of diluted wines
 		- Proline

    - class:
            - class_0
            - class_1
            - class_2

    :Summary Statistics:

    ============================= ==== ===== ======= =====
                                   Min   Max   Mean     SD
    ============================= ==== ===== ======= =====
    Alcohol:                      11.0  14.8    13.0   0.8
    Malic Acid:                   0.74  5.80    2.34  1.12
    Ash:                          1.36  3.23    2.36  0.27
    Alcalinity of Ash:            10.6  30.0    19.5   3.3
    Magnesium:                    70.0 162.0    99.7  14.3
    Total Phenols:                0.98  3.88    2.29  0.63
    Flavanoids:                   0.34  5.08    2.03  1.00
    Nonflavanoid Phenols:         0.13  0.66    0.36  0.12
    Proanthocyanins:              0.41  3.58    1.59  0.57
    Colour Intensity:              1.3  13.0     5.1   2.3
    Hue:                          0.48  1.71    0.96  0.23
    OD280/OD315 of diluted wines: 1.27  4.00    2.61  0.71
    Proline:                       278  1680     746   315
    ============================= ==== ===== ======= =====

    :Missing Attribute Values: None
    :Class Distribution: class_0 (59), class_1 (71), class_2 (48)
    :Creator: R.A. Fisher
    :Donor: Michael Marshall (MARSHALL%PLU@io.arc.nasa.gov)
    :Date: July, 1988

This is a copy of UCI ML Wine recognition datasets.
https://archive.ics.uci.edu/ml/machine-learning-databases/wine/wine.data

The data is the results of a chemical analysis of wines grown in the same
region in Italy by three different cultivators. There are thirteen different
measurements taken for different constituents found in the three types of
wine.

Original Owners:

Forina, M. et al, PARVUS -
An Extendible Package for Data Exploration, Classification and Correlation.
Institute of Pharmaceutical and Food Analysis and Technologies,
Via Brigata Salerno, 16147 Genoa, Italy.

Citation:

Lichman, M. (2013). UCI Machine Learning Repository
[https://archive.ics.uci.edu/ml]. Irvine, CA: University of California,
School of Information and Computer Science.

.. topic:: References

  (1) S. Aeberhard, D. Coomans and O. de Vel,
  Comparison of Classifiers in High Dimensional Settings,
  Tech. Rep. no. 92-02, (1992), Dept. of Computer Science and Dept. of
  Mathematics and Statistics, James Cook University of North Queensland.
  (Also submitted to Technometrics).

  The data was used with many others for comparing various
  classifiers. The classes are separable, though only RDA
  has achieved 100% correct classification.
  (RDA : 100%, QDA 99.4%, LDA 98.9%, 1NN 96.1% (z-transformed data))
  (All results using the leave-one-out technique)

  (2) S. Aeberhard, D. Coomans and O. de Vel,
  "THE CLASSIFICATION PERFORMANCE OF RDA"
  Tech. Rep. no. 92-01, (1992), Dept. of Computer Science and Dept. of
  Mathematics and Statistics, James Cook University of North Queensland.
  (Also submitted to Journal of Chemometrics).
import pandas as pd

wine_data = wine.data  #获取葡萄酒的索引data数据,178行13列
wine_target = wine.target  #获取分类目标值

# 将数据转换成DataFrame类型
wine_data = pd.DataFrame(data = wine_data)
wine_target = pd.DataFrame(data = wine_target)

# 将wine_target插入到第一列,并给这一列的列索引取名为'class'
wine_data.insert(0,'class',wine_target)

# ==1== 变量.sample(frac=1)           表示洗牌,重新排序
# ==2== 变量.reset_index(drop=True)   使index从0开始排序

wine = wine_data.sample(frac=1).reset_index(drop=True)  #把DataFrame的行顺序打乱
wine
| class | 0 | 1 | 2 | 3 | 4 | 5 | 6 | 7 | 8 | 9 | 10 | 11 | 12 | |
|---|---|---|---|---|---|---|---|---|---|---|---|---|---|---|
| 0 | 2 | 13.73 | 4.36 | 2.26 | 22.5 | 88.0 | 1.28 | 0.47 | 0.52 | 1.15 | 6.62 | 0.78 | 1.75 | 520.0 |
| 1 | 2 | 13.17 | 2.59 | 2.37 | 20.0 | 120.0 | 1.65 | 0.68 | 0.53 | 1.46 | 9.30 | 0.60 | 1.62 | 840.0 |
| 2 | 1 | 12.47 | 1.52 | 2.20 | 19.0 | 162.0 | 2.50 | 2.27 | 0.32 | 3.28 | 2.60 | 1.16 | 2.63 | 937.0 |
| 3 | 0 | 13.73 | 1.50 | 2.70 | 22.5 | 101.0 | 3.00 | 3.25 | 0.29 | 2.38 | 5.70 | 1.19 | 2.71 | 1285.0 |
| 4 | 1 | 12.22 | 1.29 | 1.94 | 19.0 | 92.0 | 2.36 | 2.04 | 0.39 | 2.08 | 2.70 | 0.86 | 3.02 | 312.0 |
| ... | ... | ... | ... | ... | ... | ... | ... | ... | ... | ... | ... | ... | ... | ... |
| 173 | 1 | 11.46 | 3.74 | 1.82 | 19.5 | 107.0 | 3.18 | 2.58 | 0.24 | 3.58 | 2.90 | 0.75 | 2.81 | 562.0 |
| 174 | 1 | 12.64 | 1.36 | 2.02 | 16.8 | 100.0 | 2.02 | 1.41 | 0.53 | 0.62 | 5.75 | 0.98 | 1.59 | 450.0 |
| 175 | 1 | 11.84 | 0.89 | 2.58 | 18.0 | 94.0 | 2.20 | 2.21 | 0.22 | 2.35 | 3.05 | 0.79 | 3.08 | 520.0 |
| 176 | 0 | 14.22 | 3.99 | 2.51 | 13.2 | 128.0 | 3.00 | 3.04 | 0.20 | 2.08 | 5.10 | 0.89 | 3.53 | 760.0 |
| 177 | 1 | 11.66 | 1.88 | 1.92 | 16.0 | 97.0 | 1.61 | 1.57 | 0.34 | 1.15 | 3.80 | 1.23 | 2.14 | 428.0 |
178 rows × 14 columns
wine.info()
<class 'pandas.core.frame.DataFrame'>
RangeIndex: 178 entries, 0 to 177
Data columns (total 14 columns):
 #   Column  Non-Null Count  Dtype
---  ------  --------------  -----
 0   class   178 non-null    int32
 1   0       178 non-null    float64
 2   1       178 non-null    float64
 3   2       178 non-null    float64
 4   3       178 non-null    float64
 5   4       178 non-null    float64
 6   5       178 non-null    float64
 7   6       178 non-null    float64
 8   7       178 non-null    float64
 9   8       178 non-null    float64
 10  9       178 non-null    float64
 11  10      178 non-null    float64
 12  11      178 non-null    float64
 13  12      178 non-null    float64
dtypes: float64(13), int32(1)
memory usage: 18.9 KB
留出验证集
取出最后10行数据用作后续的验证预测结果是否正确,不易过多
#取后10行,用作最后的预测结果检验。并且让index从0开始,也可以不写.reset_index(drop=True)
wine_predict = wine[-10:].reset_index(drop=True)

# 让特征值等于去除'class'后的数据
wine_predict_feature = wine_predict.drop('class',axis=1)

# 让目标值等于'class'这一列
wine_predict_target = wine_predict['class']

wine = wine[:-10]  #去除后10行
features = wine.drop(columns=['class'],axis=1)  #删除class这一列,产生返回值
targets = wine['class']  #class这一列就是目标值
划分测试集和训练集
from sklearn.model_selection import train_test_split

x_train,x_test,y_train,y_test = train_test_split(features,targets,test_size=0.25)
标准化
均值为0,标准差为1,使数据满足标准正态分布
from sklearn.preprocessing import StandardScaler

scaler = StandardScaler()

# 对训练的特征值标准化
x_train = scaler.fit_transform(x_train)

# 对测试的特征值标准化
x_test = scaler.fit_transform(x_test)

# 对验证集的特征值标准化
wine_predict_feature = scaler.fit_transform(wine_predict_feature)
使用sklearn包的KNN算法
from sklearn.neighbors import KNeighborsClassifier  #导入k近邻算法库

# k近邻函数
knn = KNeighborsClassifier(n_neighbors=5,algorithm='auto')

# 把训练的特征值和训练的目标值传进去
knn.fit(x_train,y_train)
KNeighborsClassifier()In a Jupyter environment, please rerun this cell to show the HTML representation or trust the notebook.
On GitHub, the HTML representation is unable to render, please try loading this page with nbviewer.org.
KNeighborsClassifier()
准确率
# 评分法计算准确率
accuracy = knn.score(x_test,y_test)
accuracy
0.9285714285714286
预测,验证
# 预测,输入预测用的x值
result = knn.predict(wine_predict_feature)
result
array([0, 2, 1, 1, 0, 1, 2, 1, 0, 1])
wine_predict_target
0    0
1    2
2    1
3    1
4    0
5    1
6    1
7    1
8    0
9    1
Name: class, dtype: int32
compare = pd.DataFrame(wine_predict_target, index = range(len(result)))
compare.columns = ['actual']
compare
| actual | |
|---|---|
| 0 | 0 |
| 1 | 2 |
| 2 | 1 |
| 3 | 1 |
| 4 | 0 |
| 5 | 1 |
| 6 | 1 |
| 7 | 1 |
| 8 | 0 |
| 9 | 1 |
compare['predict'] = result
compare
| actual | predict | |
|---|---|---|
| 0 | 0 | 0 |
| 1 | 2 | 2 |
| 2 | 1 | 1 |
| 3 | 1 | 1 |
| 4 | 0 | 0 |
| 5 | 1 | 1 |
| 6 | 1 | 2 |
| 7 | 1 | 1 |
| 8 | 0 | 0 |
| 9 | 1 | 1 |
结论:。。。。。。