目录
即看即用
1、没有安装的先在程序运行的主机上安装,安装教程见:1.4安装。
2、使用:
命令:
valgrind --leak-check=full --log-file=leak.log /proc/path/proc_name
参数说明:--leak-check=full 信息显示具体泄漏位置
--log-file=leak.log 将检测信息输入到日志leak.log中
/proc/path/proc_name 需要检测的程序
3、报错信息和说明:
==29646== ERROR SUMMARY: 0 errors from 0 contexts (suppressed: 15 from 1)
==29646== malloc/free: in use at exit: 10 bytes in 1 blocks. //指示在程序退出时,还有多少内存没有释放。
==29646== malloc/free: 1 allocs, 0 frees, 10 bytes allocated. // 指示该执行过程malloc和free调用的次数。
==29646== For counts of detected errors, rerun with: -v // 提示如果要更详细的信息,用-v选项。
==29646== searching for pointers to 1 not-freed blocks.
==29646== checked 56,164 bytes.
==29646==
==29646== LEAK SUMMARY:
==29646== definitely lost: 10 bytes in 1 blocks. //确定的内存泄露(Definitely lost)
==29646== possibly lost: 0 bytes in 0 blocks. //可能的内存泄露(Possibly lost)
(发现了一个指向某块内存中部的指针,而不是指向内存块头部。这种指针一般是原先指向内存块头部,后来移动到了内存块的中部,还有可能该指针和该内存根本就没有关系,检测工具只是怀疑有内存泄漏)
==29646== still reachable: 0 bytes in 0 blocks.// still reachable: 表示泄漏的内存在程序运行完的时候,仍旧有指针指向它,因而,这种内存在程序运行结束之前可以释放。一般情况下valgrind不会报这种泄漏,除非使用了参数 --show-reachable=yes。
==29646== suppressed: 0 bytes in 0 blocks.
==29646== Rerun with --leak-check=full to see details of leaked memory.
==29661== 10 bytes in 1 blocks are definitely lost in loss record 1 of 1
==29661== at 0x401A846: malloc (vg_replace_malloc.c:149)
==29661== by 0x804835D: main (memleak.c:6)
==29776== Invalid write of size 1 //堆内存越界被查出来(非法写操作)
==29776== at 0x80483D2: main (invalidptr.c:7)
==29776== Address 0x4159034 is 2 bytes after a block of size 10 alloc'd
==29776== at 0x401A846: malloc (vg_replace_malloc.c:149)
==29776== by 0x80483C5: main (invalidptr.c:6)
==29776==
==29776== Source and destination overlap in memcpy(0x4159029, 0x4159028, 5) //踩内存
==29776== at 0x401C96D: memcpy (mc_replace_strmem.c:116)
==29776== by 0x80483E6: main (invalidptr.c:9)
==29776==
==29776== Invalid free() / delete / delete[] //重复释放
==29776== at 0x401B3FB: free (vg_replace_malloc.c:233)
==29776== by 0x8048406: main (invalidptr.c:16)
==29776== Address 0x4159028 is 0 bytes inside a block of size 10 free'd
==29776== at 0x401B3FB: free (vg_replace_malloc.c:233)
==29776== by 0x80483F8: main (invalidptr.c:15)
==29776==
==29776== Use of uninitialised value of size 4 //非法指针(size 4 ,32bit设备),导致coredump
==29776== at 0x804840D: main (invalidptr.c:19)
==29776==
==29776== Process terminating with default action of signal 11 (SIGSEGV): dumping core
==29776== Bad permissions for mapped region at address 0x80482AD
==29776== at 0x804840D: main (invalidptr.c:19)
==29776==
详细
简介
https://www.ibm.com/developerworks/cn/linux/l-cn-valgrind/index.html
Valgrind是运行在Linux上一套基于仿真技术的程序调试和分析工具,是公认的最接近Purify的产品,它包含一个内核——一个软件合成的CPU,和一系列的小工具,每个工具都可以完成一项任务——调试,分析,或测试等。Valgrind可以检测内存泄漏和内存越界,还可以分析cache的使用等,灵活轻巧而又强大。
Valgrind的最新版是3.2.3,该版本包含下列工具:
1、memcheck:检查程序中的内存问题,如泄漏、越界、非法指针等。
2、callgrind:检测程序代码覆盖,检测程序代码的运行时间和调用过程,以及分析程序性能
3、cachegrind:分析CPU的cache命中率、丢失率,用于进行代码优化。
4、helgrind:用于检查多线程程序的竞态条件。
5、massif:堆栈分析器,指示程序中使用了多少堆内存等信息。
6、lackey:
7、nulgrind:
Valgrind工具详解
Valgrind是一套Linux下,开放源代码(GPL V2)的仿真调试工具的集合。Valgrind由内核(core)以及基于内核的其他调试工具组成。内核类似于一个框架(framework),它模拟了一个CPU环境,并提供服务给其他工具;而其他工具则类似于插件 (plug-in),利用内核提供的服务完成各种特定的内存调试任务。Valgrind的体系结构如下图所示:


valgrind支持的工具:memcheck addrcheck cachegrind Massid helgrind Callgrind,运行时必须指明想用的工具,如果省略工具名,默认运行memcheck
1,memcheck
1),使用未初始化的内存
2),读/写已经被释放的内存
3),读/写内存越界
4),读/写不恰当的内存栈空间
5),内存泄露,指向一块内存的指针永远丢失
6),使用malloc/new/new[]和free/delete/delete[]不匹配
7),memcpy()相关函数中的src和dst的内存重叠
常用选项:--leak-check=<no|summary|yes|full> [default:summary]
2,cachegrind
Cache分析器,它模拟CPU中的一级缓存I1,Dl和二级缓存,能够精确地指出程序中cache的丢失和命中。如果需要,它还能够为我们提供cache丢失次数,内存引用次数,以及每行代码,每个函数,每个模块,整个程序产生的指令数。这对优化程序有很大的帮助。
作一下广告:valgrind自身利用该工具在过去几个月内使性能提高了25%-30%。据早先报道,kde的开发team也对valgrind在提高kde性能方面的帮助表示感谢。
3,helgrind
查找多线程中的竞争数据寻找内存中被多个线程访问,而又没有一贯加锁的区域,这些区域往往是线程之间失去同步的地方,而且会导致难以发掘的错误。Helgrind实现了名为“Eraser”的竞争检测算法,并做了进一步改进,减少了报告错误的次数。不过,Helgrind仍然处于实验阶段。
4,Callgrind
收集程序运行时的一些数据,函数调用关系等信息,汉可以有选择的进行cache模拟,在运行结束后,它会把分析数据写入一个文件,callgrind_annotate可以吧这个文件的内容转化成可读的形式
一般用法:
valgrind --tool=callgrind ./test 会在当前目录下生成callgrind.out.[pid]
killall callgrind 结束程序
callgrind_annotate --auto=yes callgrind.out.[pid] > log
vi log
5,Massif
堆栈分析器,能测量程序在堆栈中使用了多少内存
6,lackey
lackey是一个实例程序,以其为模板可以创建你自己的工具,在程序结束后,它打印一些基本的关于程序执行统计数据
5. Massif
堆栈分析器,它能测量程序在堆栈中使用了多少内存,告诉我们堆块,堆管理块和栈的大小。Massif能帮助我们减少内存的使用,在带有虚拟内存的现代系统中,它还能够加速我们程序的运行,减少程序停留在交换区中的几率。
Massif对内存的分配和释放做profile。程序开发者通过它可以深入了解程序的内存使用行为,从而对内存使用进行优化。这个功能对C++尤其有用,因为C++有很多隐藏的内存分配和释放
此外,lackey和nulgrind也会提供。Lackey是小型工具,很少用到;Nulgrind只是为开发者展示如何创建一个工具。我们就不做介绍了。
Valgrind的参数(所有工具都适应)
--tool=<name>
-h --help
--version
-q --quiet 安静的运行,只打印错误信息
--verbose 更详细的信息
--trace-children=<yes|no> 跟踪子进程,默认no
--trace-fds=<yes|no> 跟踪打开的文件描述符,默认no
--time-stamp=<yes|no> 增加时间戳到LOG信息,默认no
--log-fd=<number> 输出log信息到文件描述符
--log-file-exactly=<file> 输出log信息到file
--xml=yes 将信息以xml格式输出,只有memcheck可用
--num-callers=<number>
--error-exitcode=<number> 如果发现错误则返回错误码
--db-attach=<yes|no> 当出现错误,valgrind会自动启动调试器,默认no
--db-command=<command> 启动调试器的命令行选项
valgrind(memcheck)包含7类错误
1,illegal read/illegal write errors
提示信息:[invalid read of size 4]
2,use of uninitialised values
提示信息:[Conditional jump or move depends on uninitialised value]
3,use of uninitialised or unaddressable values in system calls
提示信息:[syscall param write(buf) points to uninitilaised bytes]
4,illegal frees
提示信息:[invalid free()]
5,when a heap block is freed with an inappropriate deallocation function
提示信息:[Mismatched free()/delete/delete[]]
6,overlapping source and destination blocks
提示信息:[source and destination overlap in memcpy(,)]
7,memory leak detection
1),still reachable
内存指针还在还有机会使用或释放,指针指向的动态内存还没有被释放就退出了
2),definitely lost
确定的内存泄露,已经不能访问这块内存
3),indirectly lost
指向该内存的指针都位于内存泄露处
4),possibly lost
可能的内存泄露,仍然存在某个指针能够快速访问某块内存,但该指针指向的已经不是内存首位置
Invalid write of size 1 : 堆内存越界访问
Source and destination overlap in memcpy : 内存重叠
Invalid free() / delete / delete[] : 重复释放
Use of uninitialised value of size 4 : 非法指针
HEAP SUMMARY:堆内存使用摘要
LEAK SUMMARY : 泄露摘要
ERROR SUMMARY: 错误总数
--trace-fds=yes
FILE DESCRIPTORS:3 OPEN AT EXIT :文件描述符
原文链接:https://blog.csdn.net/yinliyinli/article/details/51346431
安装
在线安装
红帽系:yum install valgrind
得班系:apt-get install valgrind
离线安装
valgrind下载:
http://valgrind.org/downloads/valgrind-3.12.0.tar.bz2
valgrind安装:
1. tar -jxvf valgrind-3.12.0.tar.bz2
2. cd valgrind-3.12.0
3. ./configure
4. make
5. make install
输入valgrind–h显示valgrind的参数及提示,说明安装成
使用
Valgrind使用起来非常简单,你甚至不需要重新编译你的程序就可以用它。当然如果要达到最好的效果,获得最准确的信息,还是需要按要求重新编译一下的。比如在使用memcheck的时候,最好关闭优化选项。
valgrind命令的格式如下:
valgrind [valgrind-options] your-prog [your-prog options]
一些常用的选项如下:
|
选项 |
作用 |
|
-h --help |
显示帮助信息。 |
|
--version |
显示valgrind内核的版本,每个工具都有各自的版本。 |
|
-q --quiet |
安静地运行,只打印错误信息。 |
|
-v --verbose |
打印更详细的信息。 |
|
--tool=<toolname> [default: memcheck] |
最常用的选项。运行valgrind中名为toolname的工具。如果省略工具名,默认运行memcheck。 |
|
--db-attach=<yes|no> [default: no] |
绑定到调试器上,便于调试错误。 |
检测内存泄漏
示例代码如下:
保存为memleak.c并编译,然后用valgrind检测。
$ gcc -o memleak memleak.c(valgrind和purify最大的不同在于:valgrind只接管程序执行的过程,编译时不需要valgrind干预,而purify会干预程序编译过程)
$ valgrind --tool=memcheck ./memleak我们得到如下错误信息:
[konten@tencent test_valgrind]$ valgrind ./memleak
==29646== Memcheck, a memory error detector.
==29646== Copyright (C) 2002-2007, and GNU GPL'd, by Julian Seward et al.
==29646== Using LibVEX rev 1732, a library for dynamic binary translation.
==29646== Copyright (C) 2004-2007, and GNU GPL'd, by OpenWorks LLP.
==29646== Using valgrind-3.2.3, a dynamic binary instrumentation framework.
==29646== Copyright (C) 2000-2007, and GNU GPL'd, by Julian Seward et al.
==29646== For more details, rerun with: -v
==29646==
==29646==
==29646== ERROR SUMMARY: 0 errors from 0 contexts (suppressed: 15 from 1)
==29646== malloc/free: in use at exit: 10 bytes in 1 blocks. //指示在程序退出时,还有多少内存没有释放。
==29646== malloc/free: 1 allocs, 0 frees, 10 bytes allocated. // 指示该执行过程malloc和free调用的次数。
==29646== For counts of detected errors, rerun with: -v // 提示如果要更详细的信息,用-v选项。
==29646== searching for pointers to 1 not-freed blocks.
==29646== checked 56,164 bytes.
==29646==
==29646== LEAK SUMMARY:
==29646== definitely lost: 10 bytes in 1 blocks.
==29646== possibly lost: 0 bytes in 0 blocks.
==29646== still reachable: 0 bytes in 0 blocks.
==29646== suppressed: 0 bytes in 0 blocks.
==29646== Rerun with --leak-check=full to see details of leaked memory.
[konten@tencent test_valgrind]$
以上结果中,红色的是手工添加的说明信息,其他是valgrind的输出。可以看到,如果我们仅仅用默认方式执行,valgrind只报告内存泄漏,但没有显示具体代码中泄漏的地方。
因此我们需要使用 “--leak-check=full”选项启动 valgrind,我们再执行一次:
[konten@tencent test_valgrind]$ valgrind --leak-check=full ./memleak
==29661== Memcheck, a memory error detector.
==29661== Copyright (C) 2002-2007, and GNU GPL'd, by Julian Seward et al.
==29661== Using LibVEX rev 1732, a library for dynamic binary translation.
==29661== Copyright (C) 2004-2007, and GNU GPL'd, by OpenWorks LLP.
==29661== Using valgrind-3.2.3, a dynamic binary instrumentation framework.
==29661== Copyright (C) 2000-2007, and GNU GPL'd, by Julian Seward et al.
==29661== For more details, rerun with: -v
==29661==
==29661==
==29661== ERROR SUMMARY: 0 errors from 0 contexts (suppressed: 15 from 1)
==29661== malloc/free: in use at exit: 10 bytes in 1 blocks.
==29661== malloc/free: 1 allocs, 0 frees, 10 bytes allocated.
==29661== For counts of detected errors, rerun with: -v
==29661== searching for pointers to 1 not-freed blocks.
==29661== checked 56,164 bytes.
==29661==
==29661== 10 bytes in 1 blocks are definitely lost in loss record 1 of 1
==29661== at 0x401A846: malloc (vg_replace_malloc.c:149)
==29661== by 0x804835D: main (memleak.c:6)
==29661==
==29661== LEAK SUMMARY:
==29661== definitely lost: 10 bytes in 1 blocks.
==29661== possibly lost: 0 bytes in 0 blocks.
==29661== still reachable: 0 bytes in 0 blocks.
==29661== suppressed: 0 bytes in 0 blocks.
[konten@tencent test_valgrind]$
和上次的执行结果基本相同,只是多了上面蓝色的部分,指明了代码中出现泄漏的具体位置。
以上就是用valgrind检查内存泄漏的方法,用到的例子比较简单,复杂的代码最后结果也都一样。
其他内存问题
我们下面的例子中包括常见的几类内存问题:堆中的内存越界、踩内存、栈中的内存越界、非法指针使用、重复free。
编译: gcc -o invalidptr invalidptr.c -g
执行:valgrind --leak-check=full ./invalidptr
结果如下:
[konten@tencent test_valgrind]$ valgrind --leak-check=full ./invalidptr
==29776== Memcheck, a memory error detector.
==29776== Copyright (C) 2002-2007, and GNU GPL'd, by Julian Seward et al.
==29776== Using LibVEX rev 1732, a library for dynamic binary translation.
==29776== Copyright (C) 2004-2007, and GNU GPL'd, by OpenWorks LLP.
==29776== Using valgrind-3.2.3, a dynamic binary instrumentation framework.
==29776== Copyright (C) 2000-2007, and GNU GPL'd, by Julian Seward et al.
==29776== For more details, rerun with: -v
==29776==
==29776== Invalid write of size 1 //堆内存越界被查出来
==29776== at 0x80483D2: main (invalidptr.c:7)
==29776== Address 0x4159034 is 2 bytes after a block of size 10 alloc'd
==29776== at 0x401A846: malloc (vg_replace_malloc.c:149)
==29776== by 0x80483C5: main (invalidptr.c:6)
==29776==
==29776== Source and destination overlap in memcpy(0x4159029, 0x4159028, 5) //踩内存
==29776== at 0x401C96D: memcpy (mc_replace_strmem.c:116)
==29776== by 0x80483E6: main (invalidptr.c:9)
==29776==
==29776== Invalid free() / delete / delete[] //重复释放
==29776== at 0x401B3FB: free (vg_replace_malloc.c:233)
==29776== by 0x8048406: main (invalidptr.c:16)
==29776== Address 0x4159028 is 0 bytes inside a block of size 10 free'd
==29776== at 0x401B3FB: free (vg_replace_malloc.c:233)
==29776== by 0x80483F8: main (invalidptr.c:15)
==29776==
==29776== Use of uninitialised value of size 4
==29776== at 0x804840D: main (invalidptr.c:19)
==29776== //非法指针,导致coredump
==29776== Process terminating with default action of signal 11 (SIGSEGV): dumping core
==29776== Bad permissions for mapped region at address 0x80482AD
==29776== at 0x804840D: main (invalidptr.c:19)
==29776==
==29776== ERROR SUMMARY: 4 errors from 4 contexts (suppressed: 15 from 1)
==29776== malloc/free: in use at exit: 0 bytes in 0 blocks.
==29776== malloc/free: 1 allocs, 2 frees, 10 bytes allocated.
==29776== For counts of detected errors, rerun with: -v
==29776== All heap blocks were freed -- no leaks are possible.
Segmentation fault
[konten@tencent test_valgrind]$
从上面的结果看出,除了栈内存越界外,其他常见的内存问题都可以用valgrind简单的查出来。
3、显示代码覆盖
用callgrind工具能方便的显示程序执行的代码覆盖情况。
看如下例子:
4、显示线程竞态条件 <该版本暂不支持>
用helgrind工具可以在多线程代码中找到可能产生竞态条件的地方。
memcheck 工具的常用选型
1、leak-check
--leak-check=<no|summary|yes|full> [default: summary]
用于控制内存泄漏检测力度。
no,不检测内存泄漏;
summary,仅报告总共泄漏的数量,不报告具体泄漏位置;
yes/full,报告泄漏总数、泄漏的具体位置。
2、show-reachable
--show-reachable=<yes|no> [default: no]
用于控制是否检测控制范围之外的泄漏,比如全局指针、static指针等。
对应以上代码,若--show-reachable为no,则valgrind不报告内存泄漏,否则会报告。
3、undef-value-errors
--undef-value-errors=<yes|no> [default: yes]
用于控制是否检测代码中使用未初始化变量的情况。
对应以下代码:
若 --undef-value-errors=no,则valgrind不报告错误,否则报告“Use of uninitialised value ...”的错误。
其他选项

五 Valgrind的编译安装
1、下载源代码,下载地址http://valgrind.org/downloads/current.html#current ,截止目前为止,最新版本是3.2.3
2、编译,在源代码目录下执行:
./configure --prefix=[你自己的安装目录]
make;make install
便好了。
3、配置缺省选项
valgrind提供3种方式用于设置缺省选项:
a、~/.valgrindrc文件;
b、环境变量$VALGRIND_OPTS;
c、当前目录下的.valgrindrc文件;
优先顺序为 a、b、c
.valgrindrc的格式为:
--ToolName:OptionName=OptionVal
如:
--memcheck:leak-check=yes
--memcheck:show-reachable=yes
附录 其他类似工具
purify
实例分析:
原文链接:https://blog.csdn.net/dengjin20104042056/article/details/103915097
03. 使用未初始化的内存
程序中我们定义了一个指针p,但并未给他分配空间,但我们却使用它了。
程序示例:
valgrind检测出到我们的程序使用了未初始化的变量。

04. 使用野指针
p所指向的内存被释放了,p变成了野指针,但是我们却继续使用这片内存。
程序示例:
valgrind检测到我们使用了已经free的内存,并给出这片内存是哪里分配和哪里释放的。

05. 动态内存越界访问
我们动态地分配了一片连续的存储空间,但我们在访问个数组时发生了越界访问。
程序示例:
valgrind检测出越界信息如下。

注意:
valgrind不检查非动态分配数组的使用情况。
06. 分配空间后没有释放
内存泄漏的原因在于我们使用free或者new分配空间之后,没有使用free或者delete释放内存。
程序示例:
valgrind的记录显示上面的程序用了1次malloc,却调用了0次free。

可以使用–leak-check=full进一步获取内存泄漏的信息,比如malloc具体行号。

07. 不匹配使用delete或者free
一般我们使用malloc分配的空间,必须使用free释放内存。使用new分配的空间,使用delete释放内存。
程序示例:
不匹配地使用malloc/new/new[] 和 free/delete/delete[]则会被提示mismacth

08. 两次释放同一块内存
一般情况下,内存分配一次,只释放一次。如果多次释放,可能会出现double free。
程序示例:
多次释放同一内存,出现非法释放内存。

09. 总结
内存泄露问题非常难定位,对于小工程项目来说,简单去检查代码中new和delete的匹配对数就基本能定位到问题,但是一旦代码量上升到以万单位时,仅靠肉眼检查来定位问题那就非常困难了,所以我们需要利用工具帮助我们找出问题所在。在Linux系统下内存检测工具首推Valgrind,一款非常好用的开源内存管理工具。Valgrind其实是一个工具集,内存错误检测只是它众多功能的一个,但我们用得最多的功能正是它——memcheck。
总之,valgrind工具可以检测下列与内存相关的问题 :
未释放内存的使用
对释放后内存的读/写
对已分配内存块尾部的读/写
内存泄露
不匹配的使用malloc/new/new[] 和 free/delete/delete[]
重复释放内存
10. 附录
更多实例:
https://blog.csdn.net/abcjennifer/article/details/49227333
内存泄漏是coding中经常容易出现的问题, 而且很难查。 本文中总结了几个常见的内存泄漏问题, 分别举例实现, 并列出用代码分析工具——valgrind中memcheck检查的结果, 一 一对错误进行排查。
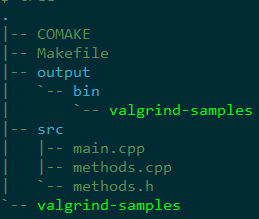
本文围绕工程valgrind-sample进行讲解。 先看下工程结构:
methods类写了几个可能存在内存操作问题的函数, main.cpp调用methods类函数:
methods.h:
main.cpp:
下面分别看这几个函数可能会遇到什么问题。
1. sample::printx()
问题显而易见, 变量赋值前引用, 但C编译器并不会报错。
valgrind ./valgrind-sample:
2. sample::access_violation()
问题如code所示,
line3: 指针pt申请了空间,但是没有释放;
line8: pt申请了5个int的空间,p经过4次循环(i=3时)已达到最后申请的p[4], 在i=4时p所指向的空间没有申请过; (下面valgrind报告中 Invalid write of size 4)
line9: 同line8 (下面valgrind报告中 Invalid read of size 4 )
valgrind ./valgrind-sample:
3. sample::mem_overlap()
问题出在memcpy上, 将str指针位置开始copy 5个char到str+1所指空间,会造成内存覆盖。strncpy也是同理。
valgrind ./valgrind-sample:
4. sample::nonfree()
问题如code所示。
line 4: 用malloc申请空间的指针用free释放;用new申请的空间用delete释放 (valgrind中Mismatched free() / delete / delete []);
line 5: 由于ptr=str, ptr已被释放,str无需再释放,此处释放了已经被释放的内存(valgrind中 Invalid free() / delete / delete[]);
line 6: 用到了已经被释放的内存(valgrind中Invalid write of size 1);
valgrind ./valgrind-sample:
最后,整个methods.cpp文件如下:
methods.cpp:
valgrind的原理
valgrind--memcheck原理
基本原理:
memcheck实现了一个仿真的CPU,被监控的程序被这个仿真CPU解释执行,从而有机会在所有的内存读写指令发生的时候,检测地址的合法性和读操作的合法性。
一,如何知道那些地址是合法的(内存已分配)?
维护一张合法地址表(Valid-address (A) bits),当前所有可以合法读写(已分配)的地址在其中有对应的表项。该表通过以下措施维护
全局数据(data, bss section)--在程序启动的时候标记为合法地址
局部变量--监控sp(stack pointer)的变化,动态维护
动态分配的内存--截获 分配/释放 内存的调用 :malloc, calloc, realloc, valloc, memalign, free, new, new[], delete and delete[]
系统调用--截获mmap映射的地址
其他--可以显示知会memcheck某地字段是合法的
二,如何知道某内存是否已经被赋值?
维护一张合法值表(Valid-value (V) bits),指示对应的bit是否已经被赋值。因为虚拟CPU可以捕获所有对内存的写指令,所以这张表很容易维护。
局限:
-memcheck无法检测global和stack上的内存溢出,因为溢出的地方也在Valid-address (A) bits中。这是由memcheck 的工作原理决定的。
-慢,20到30倍,被虚拟CPU解释一遍,当然慢
-内存占用高,因为要维护两张表格,而这两张表的维度正比于程序的内存
参考:https://blog.csdn.net/u014652595/article/details/23660347
