整个监控系统分为三部分:prometheus,grafana,xxxx_exporter(各种类型的数据采集器,在本例中就是node_exporter, mysqld_exporter)
1、在主监控服务器上安装prometheus作为主服务
2、在主监控服务器上安装grafana用于界面展示
3、在需要监控的服务器安装xxxx_exporter用于采集数据并提供一个端口便于prometheus来定时拉取数据
1、安装prometheus
- 地址:https://prometheus.io/download/,下载合适自己系统的版本,本例使用的是prometheus-2.45.0.linux-386.tar.gz,并上传到服务器,也可以直接
wget https://github.com/prometheus/prometheus/releases/download/v2.45.0/prometheus-2.45.0.linux-386.tar.gz - 解压:
tar -zxvf prometheus-2.45.0.linux-386.tar.gz - 解压后移动到
/usr/local/,同时修改文件夹名称为prometheus:mv prometheus-2.45.0.linux-386 /usr/local/prometheus - 文件的属主可能不正确,修改文件属主和所属组为root(根据自己情况):
chown -R root:root /usr/local/prometheus,-R递归修改文件夹内所有文件 - 启动prometheus:
./prometheus,但是这样启动会占用控制台,可以在命令前面加上:setsid,使其后台运行:setsid ./prometheus - 开放promethus端口:启动后,根据打印的日志可以发现程序使用的端口是9090,以下命令--add-port添加端口,--permanent设置为永久,添加后需要--reload重新加载
firewall-cmd --add-port=9090/tcp --permanent
firewall-cmd --reload
firewall-cmd --list-all
这时,使用浏览器访问 服务器IP:9090,就可以看到prometheus自带的一个web页面了
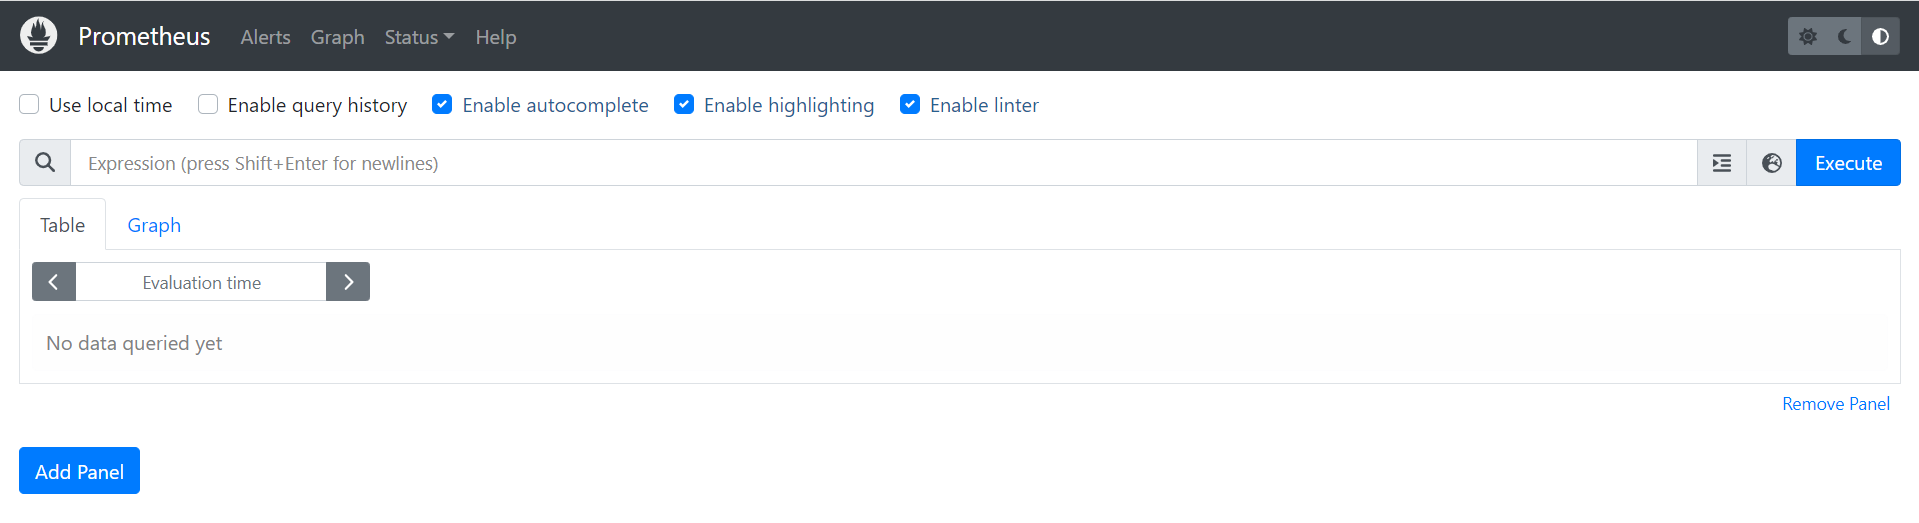
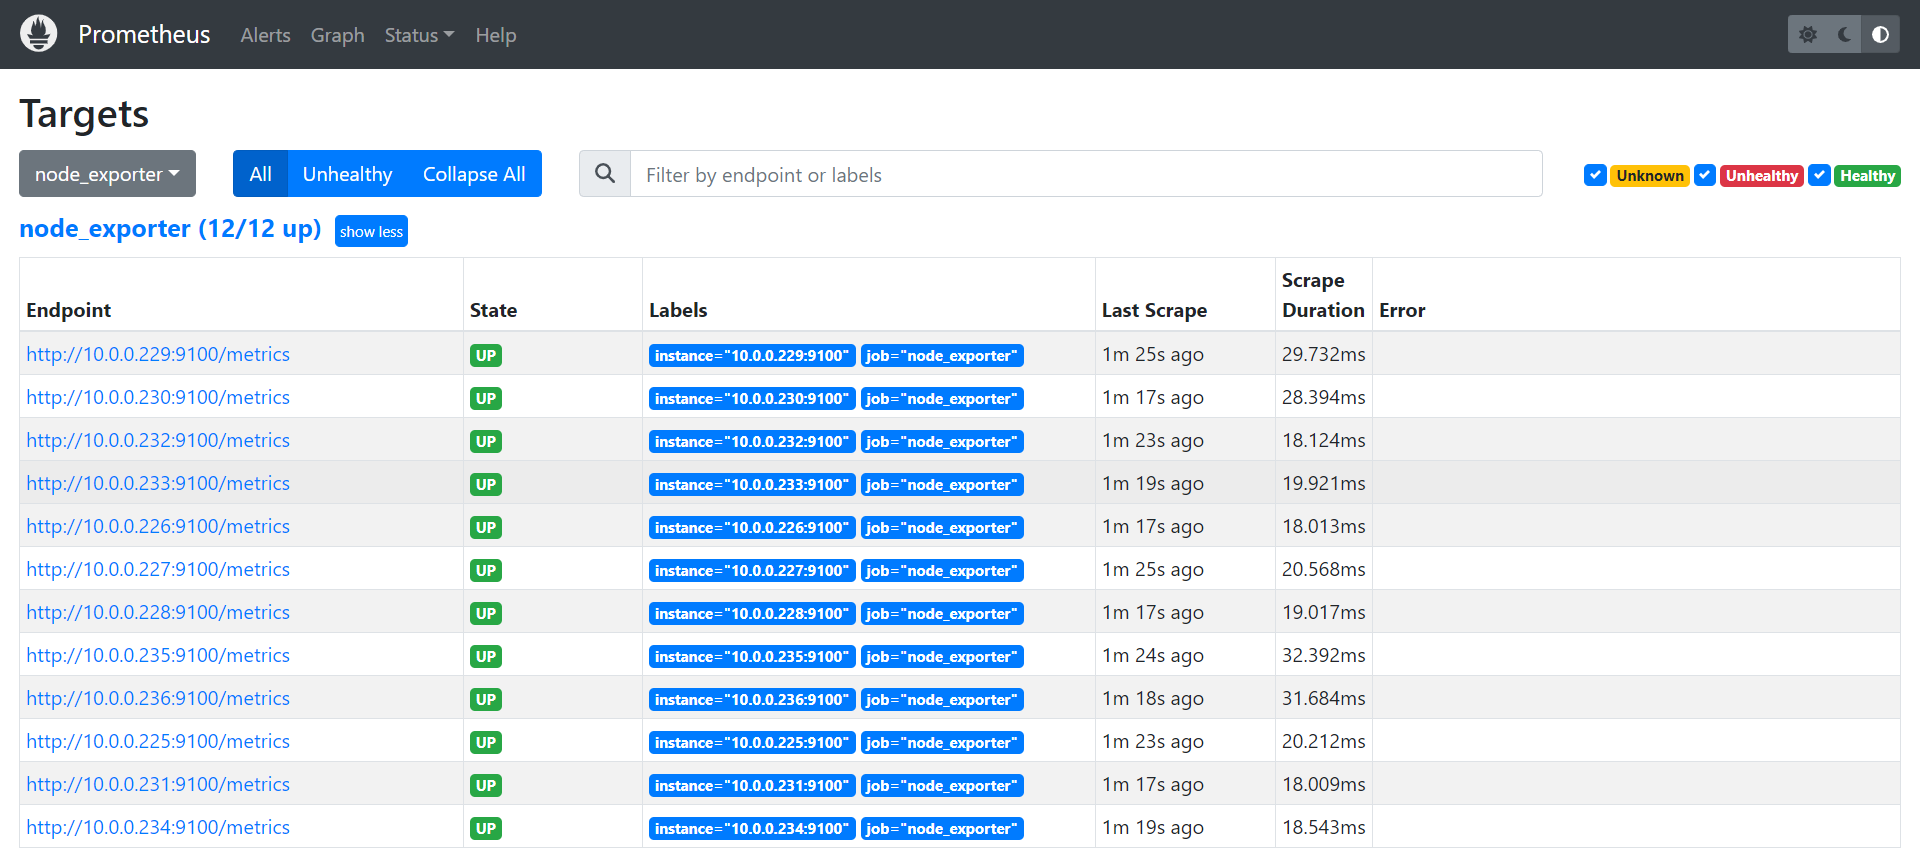
在Status页签的Targets菜单会列出所有已经接入到prometheus的数据源
/usr/local/prometheus/prometheus.yml是配置文件,后面会修改到
2、安装grafana
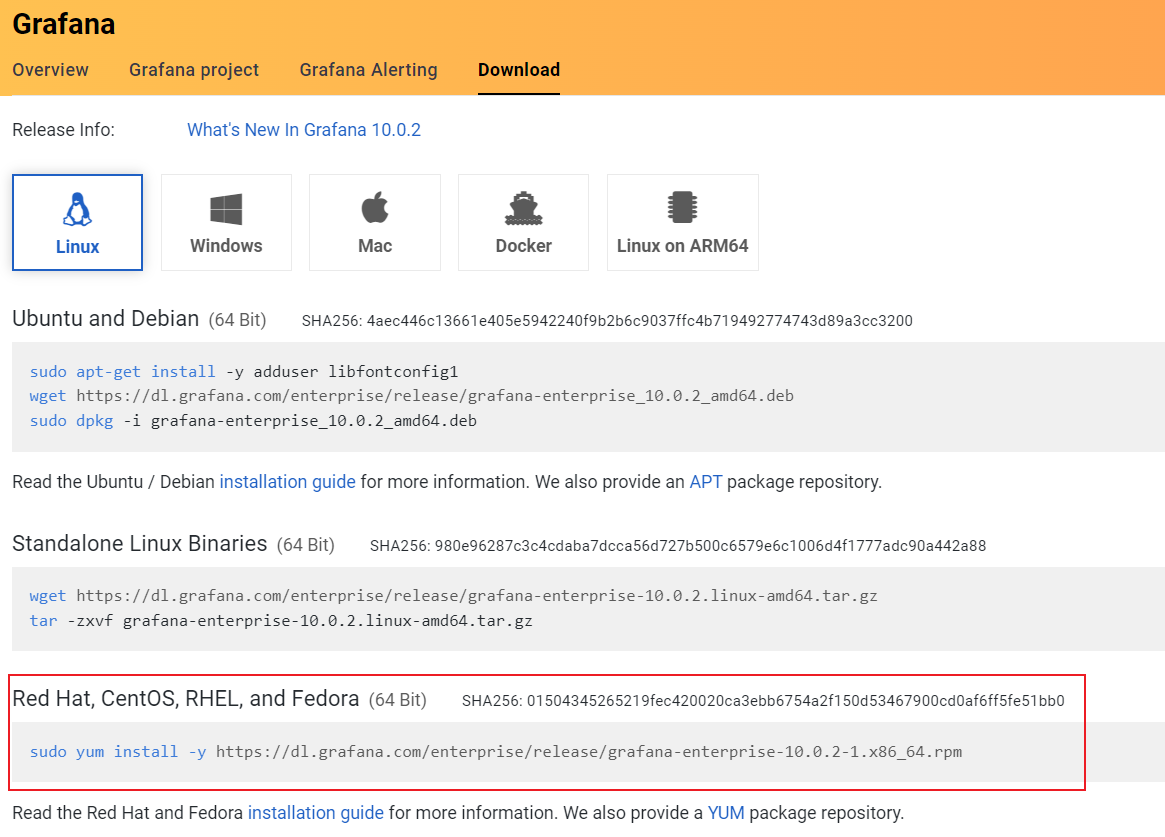
- 地址:https://grafana.com/grafana/download, 但是官方的链接下载速度可能会很慢,可以使用华为的镜像:https://mirrors.huaweicloud.com
- 安装rpm文件:
rpm -ivh grafana-enterprise-10.0.2-1.x86_64.rpm
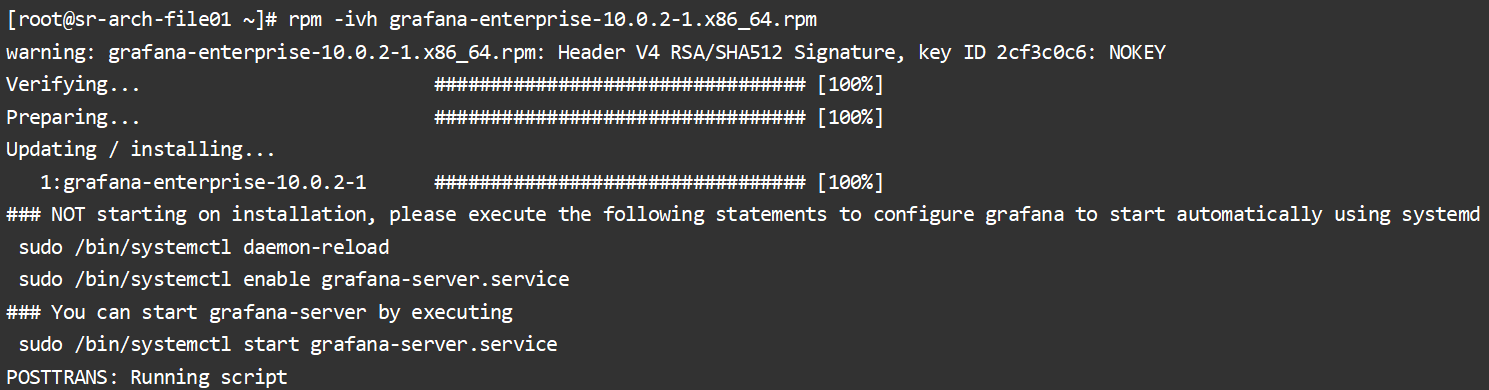
注意看最后给出的提示,grafana的服务名称为:grafana-server
- 启动grafana-server:
systemctl start grafana-server - 查看服务状态:
systemctl status grafana-server,根据日志得知,其端口为3000,配置文件路径 /etc/grafana/grafana.ini,故要想访问grafana,需开放防火墙3000端口,参考1.6开放prometheus端口的命令 - 访问web界面:服务器IP:3000,默认用户名密码为admin/admin,第一次登录需要修改密码
3、安装node_exporter
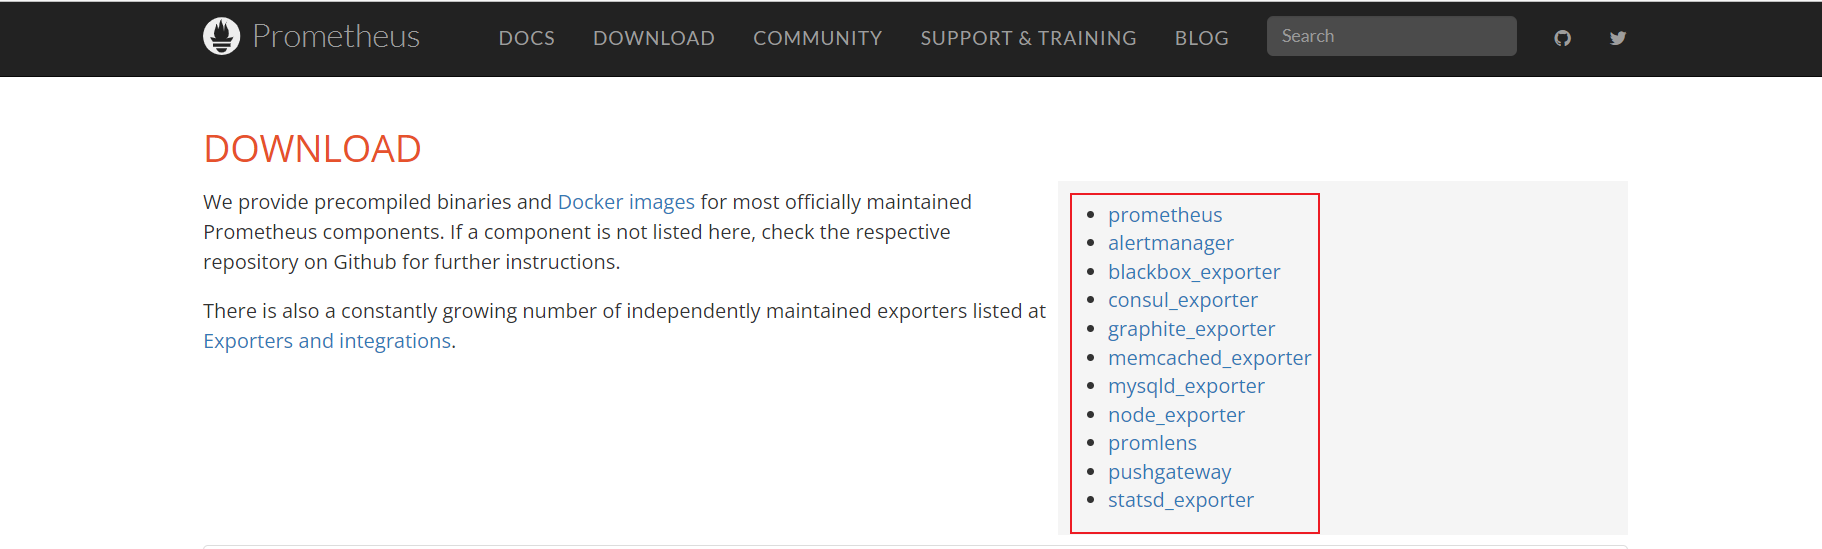
prometheus本身并不具备抓取各种数据的能力,需要依赖exporter,node_exporter的下载页面和prometheus相同:https://prometheus.io/download/, 右侧列出的就是prometheus支持的所有exporter插件,注意node_exporter插件应安装在需要监控的linux服务器上,
- 下载安装node_exporter,本例使用node_exporter-1.6.1.linux-amd64.tar.gz
- 解压后,发现其只包含三个文件:
- LICENSE
- node_exporter
- NOTICE
- 启动node_exporter:
./node_exporter,若想后台运行,可以选择使用setsid或者nohup命令,node_exporter使用9100端口 - 开放端口:prometheus需要通过该端口来定时抓取node_exporter的数据
4、配置prometheus
- prometheus需要知道从哪里抓取数据,prometheus配置文件为:${PROMETHEUS_HOME}/prometheus.yml,需要在scrape_configs节点下增加子节点
scrape_configs:
  - job_name: 'node_exporter'
    static_configs:
      - targets: ['10.0.0.225:9100', '10.0.0.226:9100']
- job_name:分组名称,任意的字符串
- targets:数组,标识目标服务器的IP:PORT
- 重启prometheus,此时在prometheus的web页面应可以看到各监控节点的状态(如果status列显示为down或其他状态,请检查prometheus与该节点服务器的连通性,或node_exporter是否正在运行)
只要节点的状态在这个页面正常,其就可以接入grafana了
5、配置grafana
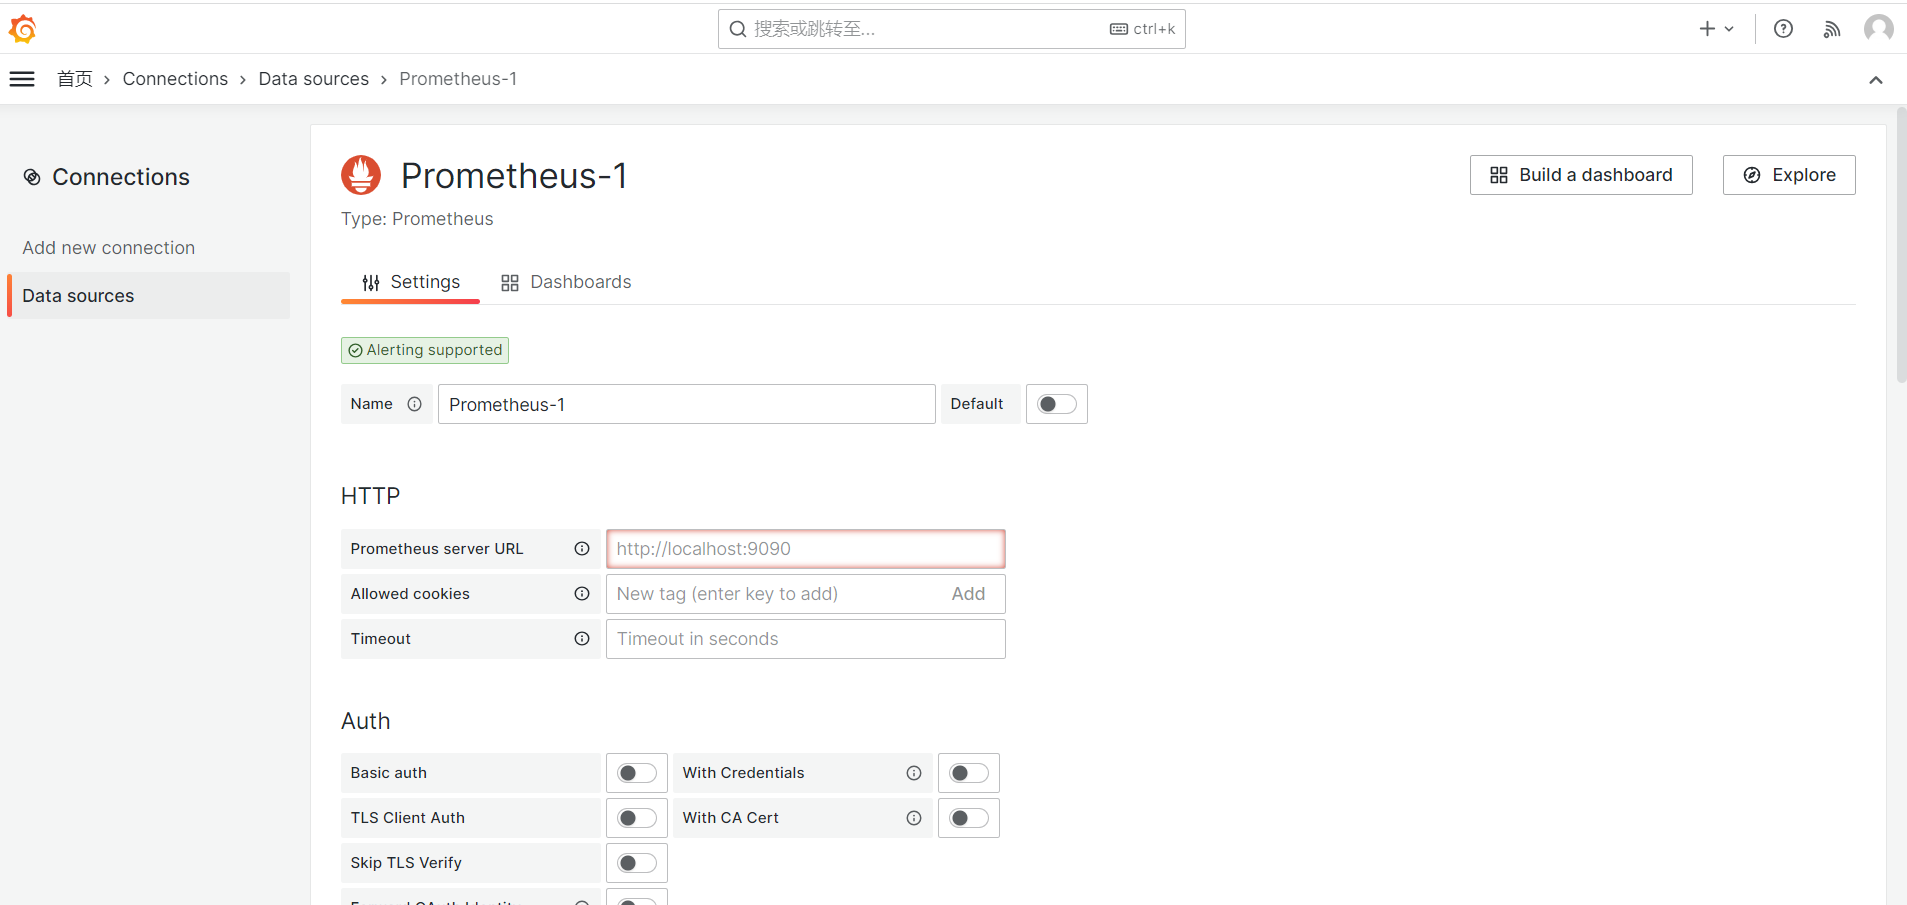
- 在grafana页面上创建prometheus数据源:Connections > Data sources,填写prometheus的服务器ip,端口9090,然后确认
- 创建监控面板
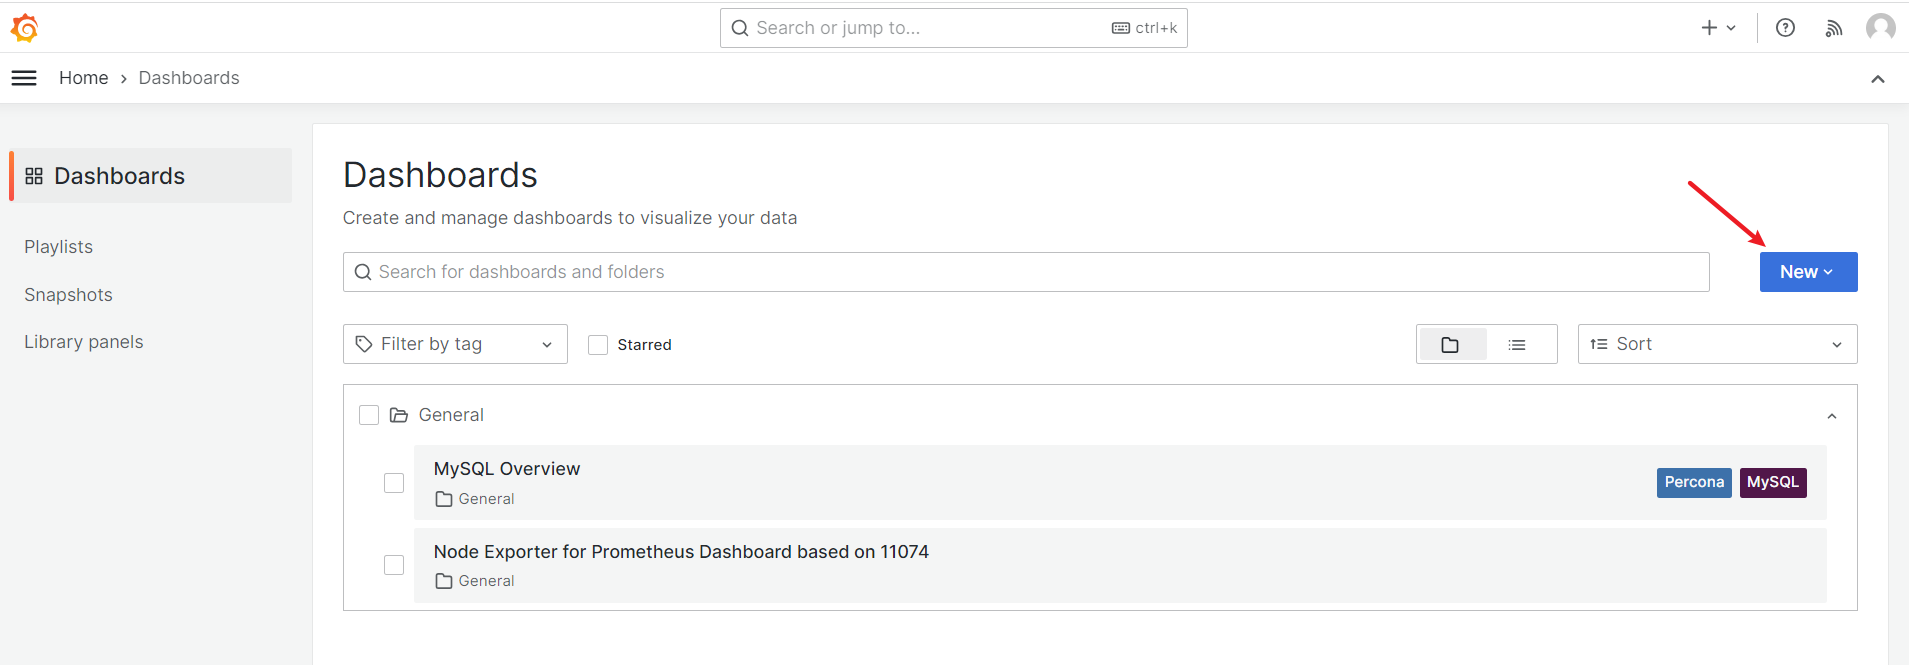
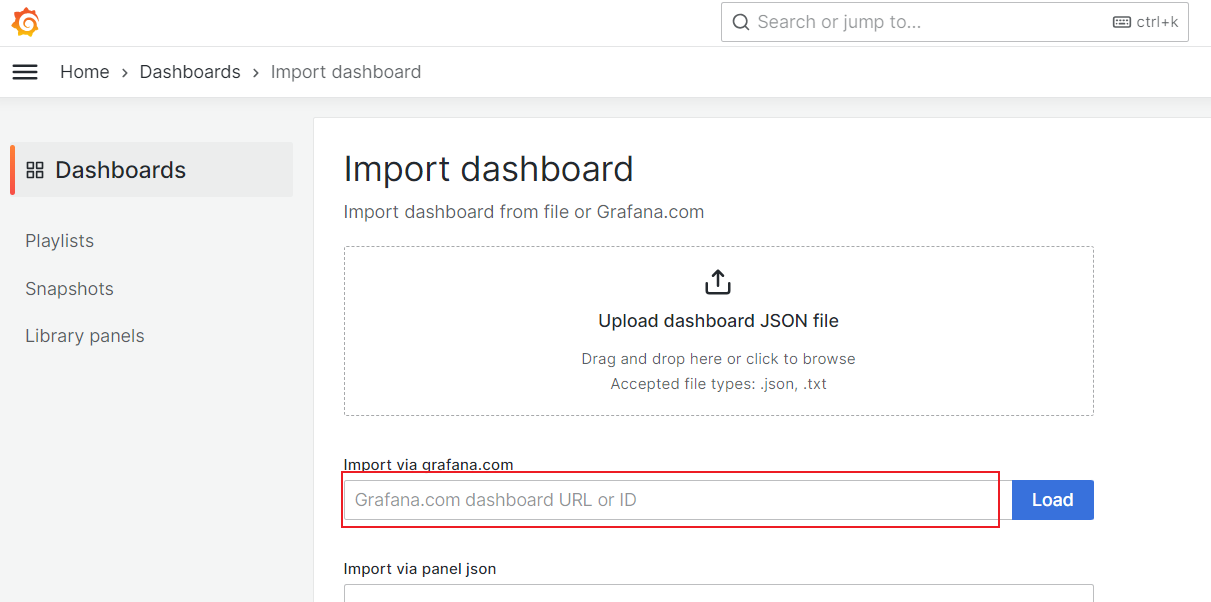
在DashBoards页面创建面板,grafana官网有很多优秀的模板,可以直接导入使用,选择 new > import
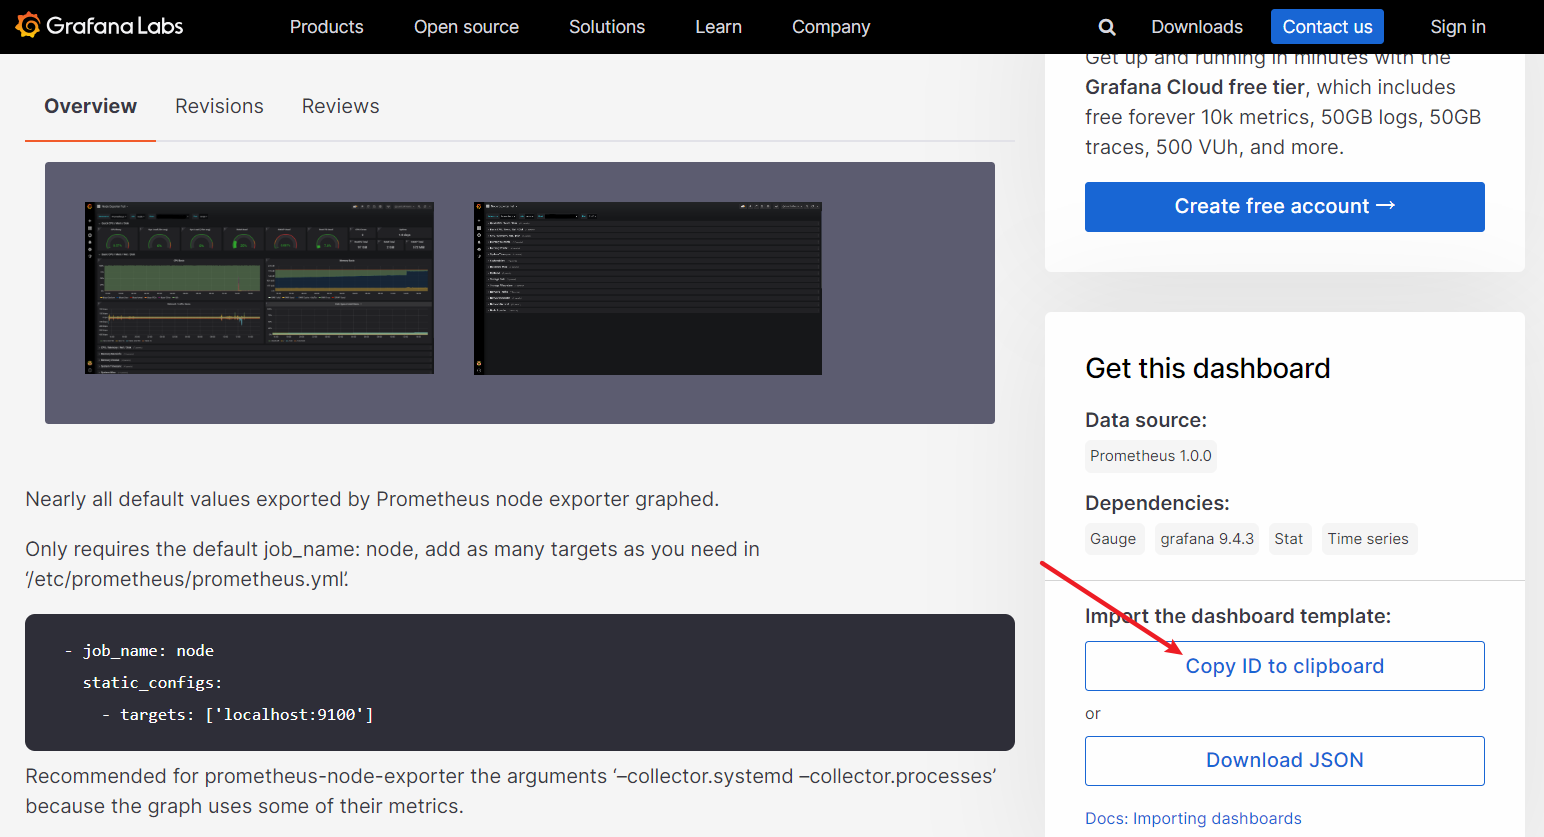
在官网选择一个模板:https://grafana.com/grafana/dashboards/?pg=graf&plcmt=dashboard-below-text, 选择好后复制该模板的ID,在导入界面加载即可,最后选择prometheus作为数据源
然后在Dashboards下就能看到导入的面板了,该面板自动将node_exporter内的数据使用图形化显示
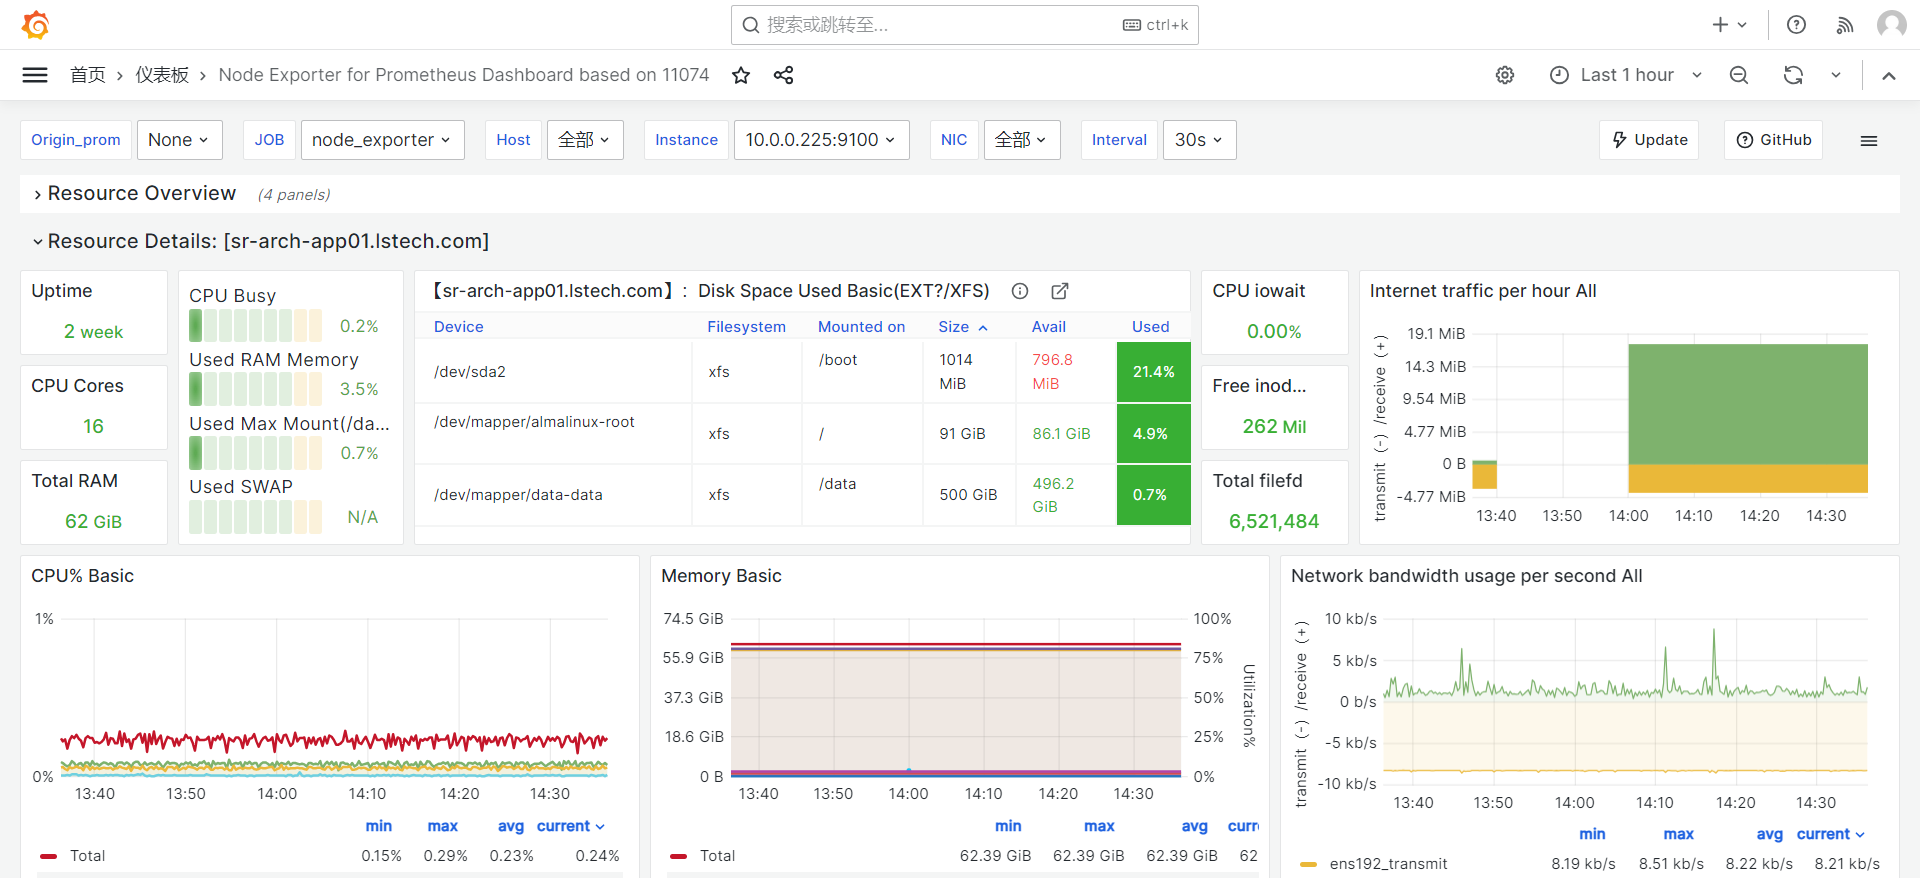
若想将新的服务器纳入监控范围,只需要在对应的服务器上安装node_exporter,然后重新配置prometheus.yml,grafana就能自动识别出来
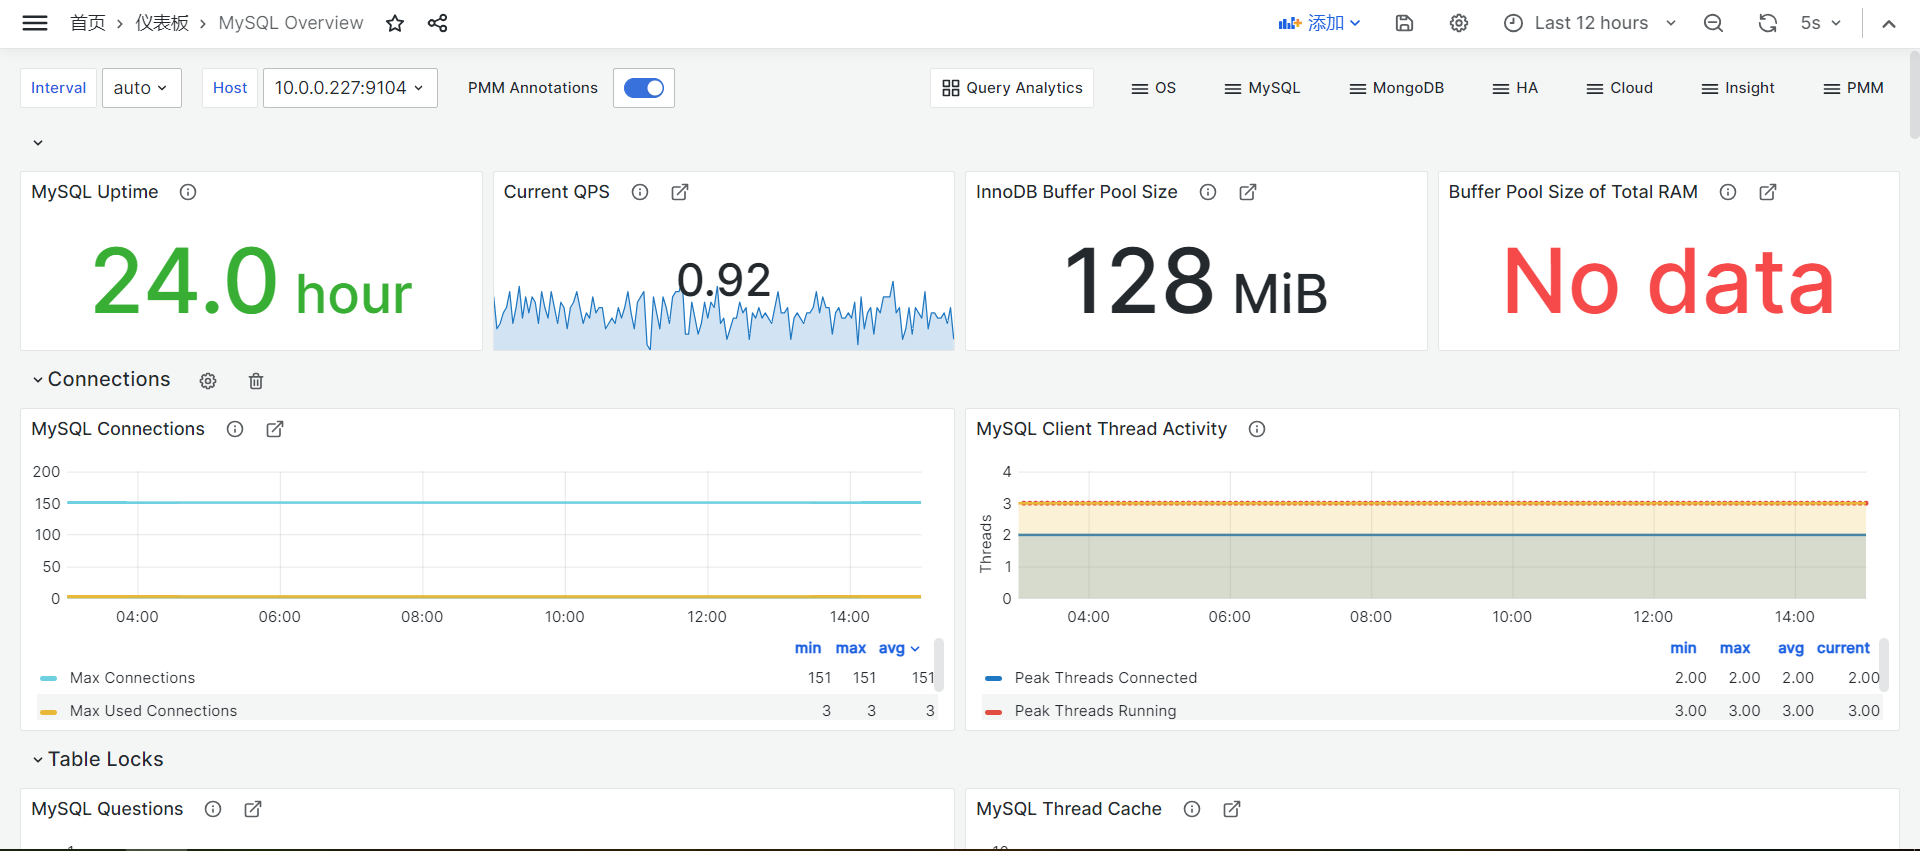
6、监控Mysql
监控mysql的操作步骤和3,4,5类似,不同的地方在于,mysqld_exporter需要配置mysql的用户名密码,且该mysql用户需要具备以下特殊权限,mysqld_exporter需要的端口为9104
- REPLICATION CLIENT
- PROCESS
- 在mysql新建用户,本例使用monitor:
CREATE USER 'monitor'@'localhost' IDENTIFIED BY '123456';
GRANT REPLICATION CLIENT, PROCESS ON *.* TO 'monitor'@'localhost';
flush privileges;
- 在${mysqld_exporter_home}/下新建文件:
.my.cnf,编辑用户名和密码
[client]
user=monitor
password=123456
- 启动mysqld_exporter时需要指定配置文件
./mysqld_exporter --config.my-cnf=/usr/local/mysqld_exporter/.my.cnf
其余步骤和监控node_exporter时一样,另注意,创建mysql监控面板时,数据源依然是prometheus
- prometheus grafana Linux Mysqlprometheus grafana linux mysql prometheus grafana环境linux prometheus grafana prometheus模板grafana prometheus grafana docker alertmanager prometheus grafana prometheus windows grafana jmeter node-exporter prometheus exporter grafana node_exporter prometheus exporter grafana 磁盘prometheus内存grafana