通用曲线控件定制之重点难点篇(附源码,功能丰富灵活) 浮云E绘图

发布时间 2023-07-09 10:17:25作者: 浮云绘图

 上篇已经介绍通用曲线控件源码定制之设计实现,详细描述了通用曲线控件的功能部件及其结构关系,并且实现了核心类的源码,本文由浮云E绘图继续介绍通用曲线控件定制开发的重点和难点,并附完整源码。


一. 曲线控件源码类使用流程

根据上文通用曲线控件源码定制之设计实现篇可知曲线控件结构关系如下图

浮云绘图曲线控件源码类使用流程


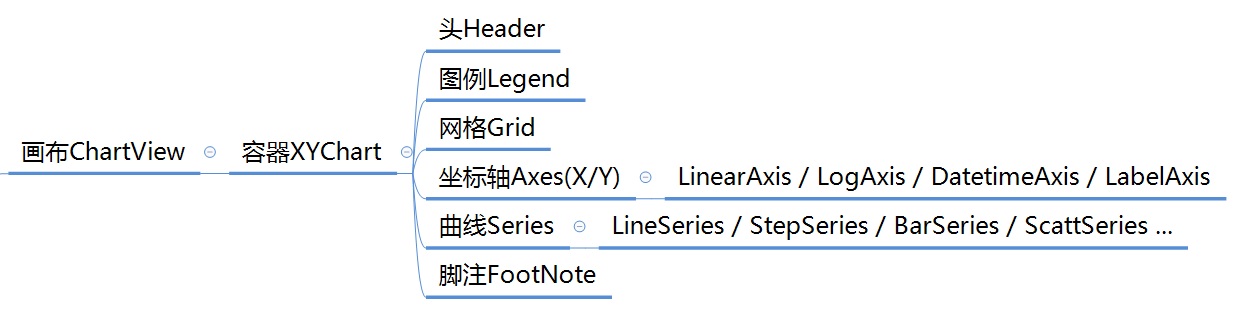
先创建曲线画布View --> 接着创建曲线数据管理器Chart --> 创建XY坐标轴,设定曲线头Header、脚注FootNote、网格Grid --> 添加对应坐标轴类型对应的曲线Series数据集。

  1 // 作者:浮云绘图,专业定制CAD等图形编辑、曲线控件、报表等工具源码开发
  2 // QQ:316868127
  3 
  4 // 1画布ChartView关联容器Chart
  5 public class ChartView extends View{   
  6     private AbstractChart _chart;
  7 
  8     public ChartView(Context context, AbstractChart chart) 
  9     {
 10         super(context);
 11         _chart = chart;
 12     }
 13 
 14     private volatile boolean _isDrawing = false;
 15     @Override
 16     protected void onDraw(Canvas canvas) {
 17         _isDrawing = true;
 18         
 19         super.onDraw(canvas);
 20         _chart.draw(canvas, _paint);
 21         
 22         _isDrawing = false;
 23     }
 24 }
 25 
 26 
 27 //-----------------------------------------------------------
 28 // 2容器XYChart,支持双X轴和双Y轴
 29 public class XYChart extends AbstractChart {
 30 //    private PointD _origin = new PointD(0, 0);                    //仅XAndY坐标系原点
 31     private RectF _plotArea = new RectF(0,0,0,0);
 32     private int _plotBackColor = Color.argb(255, 230, 230, 230);
 33     
 34     private AbstractAxis _axisX;
 35     private AbstractAxis _axisY;
 36     private AbstractAxis _axisX2;
 37     private AbstractAxis _axisY2;
 38 
 39     
 40     public XYChart(AbstractAxis axisX, AbstractAxis axisY) {
 41         this(axisX, axisY, null, null);
 42     }
 43     
 44     public XYChart(AbstractAxis axisX, AbstractAxis axisY, 
 45             AbstractAxis axisX2, AbstractAxis axisY2){
 46         _axisX = axisX;
 47         _axisY = axisY;
 48         _axisX2 = axisX2;
 49         _axisY2 = axisY2;
 50         
 51         _axisX.setVisible(true);
 52         _axisY.setVisible(true);
 53         _axisX.setType(EnAxisType.X);
 54         _axisY.setType(EnAxisType.Y);
 55         
 56         if(axisX2 != null) {
 57             _axisX2.setVisible(true);
 58             _axisX2.setType(EnAxisType.X2);
 59             _axisX2.getGrid().setVisible(false);
 60         }
 61         if(axisY2 != null){
 62             _axisY2.setVisible(true);
 63             _axisY2.setType(EnAxisType.Y2);
 64             _axisY2.getGrid().setVisible(false);
 65         }
 66     }
 67     
 68     @Override
 69     protected void drawSeries(Canvas canvas, Paint paint) {
 70         // TODO Auto-generated method stub
 71         for (int i = 0; i < _series.size(); i++) {
 72             AbstractSeries ser = _series.get(i);
 73             ser.drawLine(canvas, paint,_plotArea);
 74         }
 75     }
 76     
 77     public void draw(Canvas canvas, Paint paint){
 78         canvas.save();
 79         canvas.clipRect(_clientArea);
 80         super.calcChartArea(paint);
 81 
 82         // 背景
 83         super.drawBackground(canvas, paint);
 84 
 85         // 轴、网格
 86         drawAxis(canvas, paint);
 87 
 88         // 曲线、图例、标题
 89         super.draw(canvas, paint);
 90         canvas.restore();
 91     }
 92 }
 93 
 94 
 95 //-----------------------------------------------------------
 96 // 3坐标轴Axis
 97 public abstract class AbstractAxis {
 98     protected EnAxisType _type;
 99     protected boolean _visible = false;
100 //    protected boolean _reversed = false;
101 //    protected boolean _autoScale = true;
102     protected double _dMax; // 最大值
103     protected double _dMin; // 最小值
104 //    protected double _dMajor; // 大刻度间隔
105     protected double _origin = Double.MAX_VALUE; // XY轴起点
106     protected boolean _autoOrigin = true;
107 
108     // 标题--abcd
109     protected String _title = "Axis";
110     protected FontStyle _titleFontStyle;
111 //    protected EnAxisTitleAlign _titleAlign;
112     protected boolean _titleVisible = true;
113 
114     // 轴线
115     protected LineStyle _axisLineStyle;
116 
117     // 刻度线
118     protected LineStyle _scaleLineStyle;
119     protected int _majorScaleLineLength = 5; // 大刻度线长
120     protected int _scaleLabelToValueLength = 2;
121     protected boolean _showTickMarks = true ;
122 
123     // 刻度值
124     protected float _scaleValeAngle;
125     protected FontStyle _scaleFontStyle;
126     protected int _scaleValueColor = Color.BLACK;
127     protected boolean _showLabels = true;
128 
129     // 网格,Grid与Axis由强关系,同步大小的刻度线和值
130     protected Grid _grid;
131 
132     protected AbstractAxis() {
133         _dMax = Double.MIN_VALUE;
134         _dMin = Double.MAX_VALUE;
135 
136         _titleFontStyle = new FontStyle(11, Color.BLACK);
137         _axisLineStyle = new LineStyle(1, Color.BLACK);
138         _scaleLineStyle = new LineStyle(1, Color.BLACK);
139         _scaleFontStyle = new FontStyle(10, Color.CYAN);
140 
141         _grid = new Grid();
142     }
143 
144     public void draw(Canvas canvas, Paint paint, RectF plotArea,
145             List<Double> labels) {
146         draw(canvas, paint, plotArea, labels, 0);
147     }
148 }
149 
150 
151 
152 public class LinearAxis extends AbstractAxis {
153 ......
154 }
155 
156 
157 
158 //-----------------------------------------------------------
159 // 4网格Grid
160 public class Grid {
161     private EnGridType _type = EnGridType.X;
162     private boolean _visible = true;
163     private LineStyle _majorGridLineStyle;
164 //    private LineStyle _minorGridLineStyle;
165     
166     public Grid(){
167         _majorGridLineStyle = new LineStyle(1, Color.LTGRAY);
168     }
169 }
170 
171 
172 
173 //-----------------------------------------------------------
174 5 曲线Series,曲线必须先指定坐标参考系,即轴类型,才有意义。
175 public abstract class AbstractSeries {
176     protected String _title = "Series";
177     protected int _color = Color.BLUE;
178 
179     protected AbstractAxis _axisX;
180     protected AbstractAxis _axisY;
181     
182     protected Object _dataX;
183     protected Object _dataY;
184     
185     public AbstractSeries(AbstractAxis axisX, AbstractAxis axisY, String name, Object dataX, Object dataY){
186         _axisX = axisX;
187         _axisY = axisY;
188         _title = name;
189         _dataX = dataX;
190         _dataY = dataY;
191     }
192     
193     public void drawLine(Canvas canvas,Paint paint, RectF plotArea){
194         canvas.clipRect(plotArea);
195         draw(canvas, paint, plotArea);
196         canvas.restore();
197     }
198 ......
199 }
200 
201 
202 
203 
204 public class LineSeries extends AbstractSeries{
205     private int _width = 1;
206     private ScattSeries _scatt;
207     
208     public LineSeries(AbstractAxis axisX, AbstractAxis axisY, String name,
209             Object dataX, Object dataY) {
210         super(axisX, axisY, name, dataX, dataY);
211         // TODO Auto-generated constructor stub
212     }
213 ......
214 }
215 
216 
217 
218 // 使用曲线控件示例
219 public class DemoActivity extends Activity {
220     private ChartView _jchart;
221     private XYChart _chart;
222 
223 @Override
224     protected void onCreate(Bundle savedInstanceState) {
225         super.onCreate(savedInstanceState);
226         setContentView(R.layout.jchart_layout);
227         
228         _chart = new XYChart(new LinearAxis(), new LinearAxis(), null, null);
229         _jchart = new ChartView(this, _chart);
230         _chart.setRect(0, 0, 720, 1080);
231     }
232 }


二、曲线控件源码定制开发的重点难点

1. 提升绘图效率

如果曲线数据量很大(十万个点以上),就需要考虑提升绘图效率,或者曲线绘制时(特别在移动时),会出现卡顿。根本原则时只绘制可见部分和变化部分,主要手段有1>绘图缓存技术,2>合理利用无效区,3>必要时交换贴图。

具体可以参看绘图效率完整解决方案——三种手段提高GDI/GDI+绘图效率

 1     // 作者:浮云绘图,专业定制开发工控、军工等领域的CAD/流程图等绘图编辑器、海量数据高性能的工业曲线控件等
 2     // QQ:316868127
 3 
 4     // ChartView类
 5     private volatile boolean _isDrawing = false;
 6     @Override
 7     protected void onDraw(Canvas canvas) {
 8         _isDrawing = true;
 9         
10         super.onDraw(canvas);
11         _chart.draw(canvas, _paint);
12         
13         _isDrawing = false;
14     }
15 
16 
17     // XYChart类
18     public void draw(Canvas canvas, Paint paint){
19         canvas.save();
20         canvas.clipRect(_clientArea);
21         super.calcChartArea(paint);
22 
23         // 背景
24         super.drawBackground(canvas, paint);
25 
26         // 轴、网格
27         drawAxis(canvas, paint);
28 
29         // 曲线、图例、标题
30         super.draw(canvas, paint);
31         canvas.restore();
32     }


2. 准确计算曲线各部件的区域大小

曲线控件包含头、图例、脚注、坐标轴、网格、曲线数据等区域块,每块内排列和部件不同,以及是否可见,都影响其他区域大小,如果计算各区域不精准,容易出现错位或擦除不干净等问题。下文仅贴出一部分计算代码。

 1 private void calcPlotArea(Paint paint, List<Double> labelsX, List<Double> labelsY,
 2                     List<Double> labelsX2, List<Double> labelsY2){
 3         double bottom,top,left,right;
 4         
 5         int outLenX = _axisX.getAxisOutLength(paint, labelsX);
 6         double yPixelPerUnit = (_chartArea.height() - outLenX/2) / (_axisY.WorldToPhysical(_axisY.getMax()) - _axisY.WorldToPhysical(_axisY.getMin()));    //- outLenX/2无奈之举
 7         double yOrgOffset = (_axisY.WorldToPhysical(_axisY.getOrigin()) - _axisY.WorldToPhysical(_axisY.getMin()))*yPixelPerUnit;
 8         if (outLenX - yOrgOffset > 0){
 9             bottom = _chartArea.bottom - (outLenX - yOrgOffset);
10         }else bottom = _chartArea.bottom;
11         
12         int outLenY = _axisY.getAxisOutLength(paint, labelsY);
13         double xPixelPerUnit= (_chartArea.width() - outLenY/2) / (_axisX.WorldToPhysical(_axisX.getMax()) - _axisX.WorldToPhysical(_axisX.getMin()));    //- outLenX/2无奈之举;
14         double xOrgOffset = (_axisX.WorldToPhysical(_axisX.getOrigin()) - _axisX.WorldToPhysical(_axisX.getMin()))*xPixelPerUnit;
15         if (outLenY - xOrgOffset > 0){
16             left = _chartArea.left + (outLenY - xOrgOffset);
17         }else left = _chartArea.left;
18         
19         if (_axisX2 != null && _axisX2.getVisible()) {
20             int outLenX2 = _axisX2.getAxisOutLength(paint, labelsX2);
21             top = _chartArea.top + outLenX2;
22         }else top = _chartArea.top;
23         
24         if (_axisY2 != null && _axisY2.getVisible()) {
25             int outLenY2 = _axisY2.getAxisOutLength(paint, labelsY2);
26             right = _chartArea.right - outLenY2;
27         }else right = _chartArea.right;
28         
29         _plotArea.set((float)left, (float)top, (float)right, (float)bottom);
30     }


3. 实时测量时的十字标线和透明TipWnd框

通用曲线控件源码定制实时测量时的十字标线和透明TipWnd框


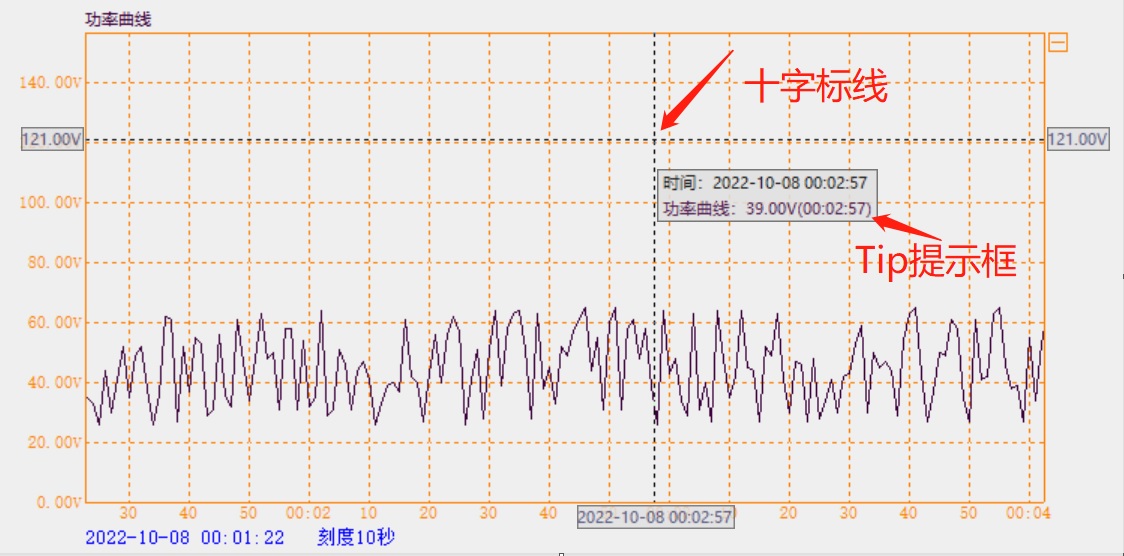
曲线控件经常需根据鼠标移动位置,实时画十字线,并且在透明提示框中显示鼠标位置对应的实时XY值。

十字标线需要实时画新线,并且擦除上一次旧线。如果用普通的画线方式,每当鼠标移动就重绘曲线,会闪烁,无法满足正常需要。此时的的解决方法是画异或线。异或线的具体定义请自查资料,下文贴出异或线画笔的实现C++代码。

 1 // 异或线画笔实现C++类
 2 
 3 CXorPen::CXorPen(HWND hWnd, int drawMode)
 4 {
 5 //    std::cout << " MFC CXorPen:: " << __FUNCTION__ << std::endl;
 6 
 7     m_hWnd = hWnd;
 8     m_hdc = ::GetDC(hWnd);
 9 
10     HPEN hPen = ::CreatePen(PS_DOT, 1, 0x000000);
11     m_hPenOld = ::SelectObject(m_hdc, hPen);
12 
13     ::SetROP2(m_hdc, drawMode);
14 }
15 
16 CXorPen::~CXorPen()
17 {
18 //    std::cout << " MFC CXorPen:: " << __FUNCTION__ << std::endl;
19 
20     ::SelectObject(m_hdc, m_hPenOld);
21     ::ReleaseDC(m_hWnd, m_hdc);
22 }
23 
24 void CXorPen::MoveTo(int x, int y)
25 {
26     ::MoveToEx(m_hdc, x, y, NULL);
27 }
28 
29 void CXorPen::LineTo(int x, int y)
30 {
31     ::LineTo(m_hdc, x, y);
32 }
33 
34 void CXorPen::DrawLine(int x1, int y1, int x2, int y2)
35 {
36     ::MoveToEx(m_hdc, x1, y1, NULL);
37     ::LineTo(m_hdc, x2, y2);
38 }
39 
40 void CXorPen::DrawRectangle(int x1, int y1, int x2, int y2)
41 {
42     ::Rectangle(m_hdc, x1, y1, x2, y2);
43 }


异或十字标线和透明TipWnd框的完整实现类,后续会专门介绍。浮云E绘图的通用曲线控件定制之重点难点篇就介绍到这里,有需要定制开发绘图工具的请联系。

下载 通用曲线控件源码,功能丰富,可灵活扩展