封面 《Unless Terminalia》
[js 检测开发者工具是否打开 | qxdn 的乐园](https://qianxu.run/2023/01/26/js-check-devtool/)
前言
在使用浏览器对一些网站进行分析的时候经常会遇到打开开发者工具后跳出 debugger 或者说是跳转到了别的网页。下面我会讲一些网站是如何做到的和应对方法。
debugger
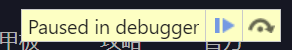
一种常见的方法是使用 debugger,比如米游社用的是这种,当打开开发者工具时会有 debugger 跳出效果如下,效果类似于程序中的断点,点继续调试的时候也是如此,让人忙于处理 debugger
实现起来为如下代码
1
2
3
4
5
6
7
8
9
10
|
<!DOCTYPE html>
<body>
    <script>
        function check() {
            debugger;
            setTimeout(check, 1);
        }
        check();
    </script>
</body>
|
破解方法
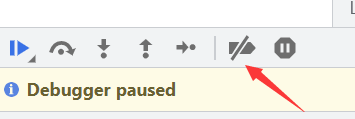
对于这种方法,我们只需要禁用 debugger 就行,最简单的方法就是点击开发中工具中的 deactivated breakpoints
禁用右键和 F12
禁用 F12 和右键,使得无法打开开发者工具。这种方法有点掩耳盗铃
1
2
3
4
5
6
7
8
9
10
11
12
13
14
15
16
17
18
|
<!DOCTYPE html>

<body>
    <script>
        // F12
        window.onkeydown = window.onkeyup = window.onkeypress = function (event) {
            // 判断是否按下F12,F12键码为123
            if (event.keyCode = 123) {
                event.preventDefault(); // 阻止默认事件行为
                window.event.returnValue = false;
            }
        }
        // 右键
        document.oncontextmenu = function () {
            event.returnValue = false;
        }
    </script>
</body>
|
破解方法
按下 ctrl+shift+I 或者点击 chrome 浏览器头像右侧的地方里面的更多工具->开发者工具
检测窗口大小变化
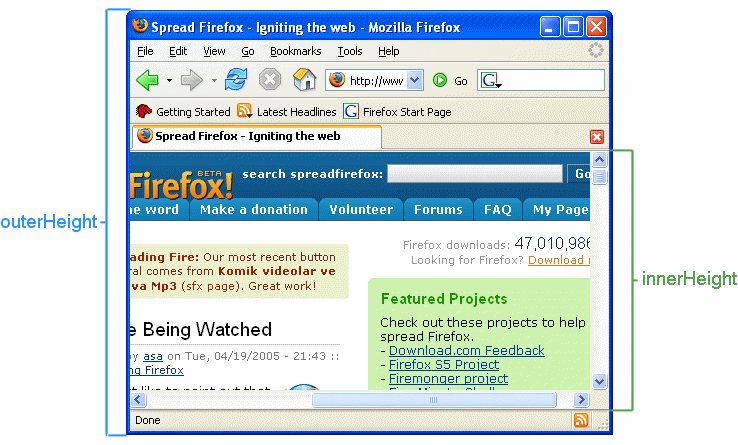
window.outerHeight 和 window.outerWidth 返回整个浏览器窗口的高度,宽度,包括侧边栏(如果存在)。window.innerHeight 和 window.innerWidth 返回浏览器视窗大小,如果有滚动条也包含滚动条。具体区分可见下图
这里实现直接照搬别人的 github,附带上该库的 例程
1
2
3
4
5
6
7
8
9
10
11
12
13
14
15
16
17
18
19
20
21
22
23
24
25
26
27
28
29
30
31
32
33
34
35
36
37
38
39
40
41
42
43
44
45
46
47
48
49
50
51
52
53
54
55
|
<!DOCTYPE html>

<body>
    <script>
        const devtools = {
            isOpen: false,
            orientation: undefined,
        };

        // inner和outer之间大小的阈值
        const threshold = 170;
        // 定义监听开发者工具事件
        const emitEvent = (isOpen, orientation) => {
            globalThis.dispatchEvent(new globalThis.CustomEvent('devtoolschange', {
                detail: {
                    isOpen,
                    orientation,
                },
            }));
        };

        const main = ({ emitEvents = true } = {}) => {
            const widthThreshold = globalThis.outerWidth - globalThis.innerWidth > threshold;
            const heightThreshold = globalThis.outerHeight - globalThis.innerHeight > threshold;
            const orientation = widthThreshold ? 'vertical' : 'horizontal';

            if (
                !(heightThreshold && widthThreshold)
                && ((globalThis.Firebug && globalThis.Firebug.chrome && globalThis.Firebug.chrome.isInitialized) || widthThreshold || heightThreshold)
            ) {
                // 有超过阈值 是打开的
                if ((!devtools.isOpen || devtools.orientation !== orientation) && emitEvents) {
                    emitEvent(true, orientation);
                }

                devtools.isOpen = true;
                devtools.orientation = orientation;
            } else {
                // 开发者工具未打开
                if (devtools.isOpen && emitEvents) {
                    emitEvent(false, undefined);
                }

                devtools.isOpen = false;
                devtools.orientation = undefined;
            }
        };

        main({ emitEvents: false });
        setInterval(main, 500);
        window.addEventListener('devtoolschange', event => {
            console.log(event.detail.isOpen)
        });
    </script>
</body>
|
破解方法
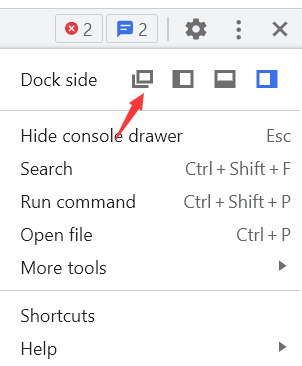
这种方法需要设置一个阈值,容易误触发。破解方法就是将开发者工具设置为独立窗口,这样就无法检测到窗口变化。
重写 toString
在我的 chrome 109.0.5414.119 上没有复现成功
1
2
3
4
5
6
7
8
9
10
11
12
13
14
|
//方法1
var x = document.createElement('div');
Object.defineProperty(x, 'id', {
    get:function(){
        // 开发者工具被打开
    }
});
console.log(x);
//方法2
var c = new RegExp("1");
c.toString = function(){
  // 开发者工具被打开
}
console.log(c);
|
破解方法
对于一些使用 console 判断的可以把 console 的输出失效。这里可以用插件完成
后记
以上就是一些常见的检测方法了,还有一些可能没有说到,可以看一看 devtools-detector 里面的实现。
因为前端是源码给到浏览器用户的,其实想要避免被扒还是有点困难,一些组织办法只是增加扒代码一方的麻烦,或者过滤掉一部分人。
参考文献
前端 JS 攻防对抗
如何解决反调试困扰 - chrome extension
Window.outerHeight
devtools-detect
fuck-debugger-extensions
Find out whether Chrome console is open
devtools-detector