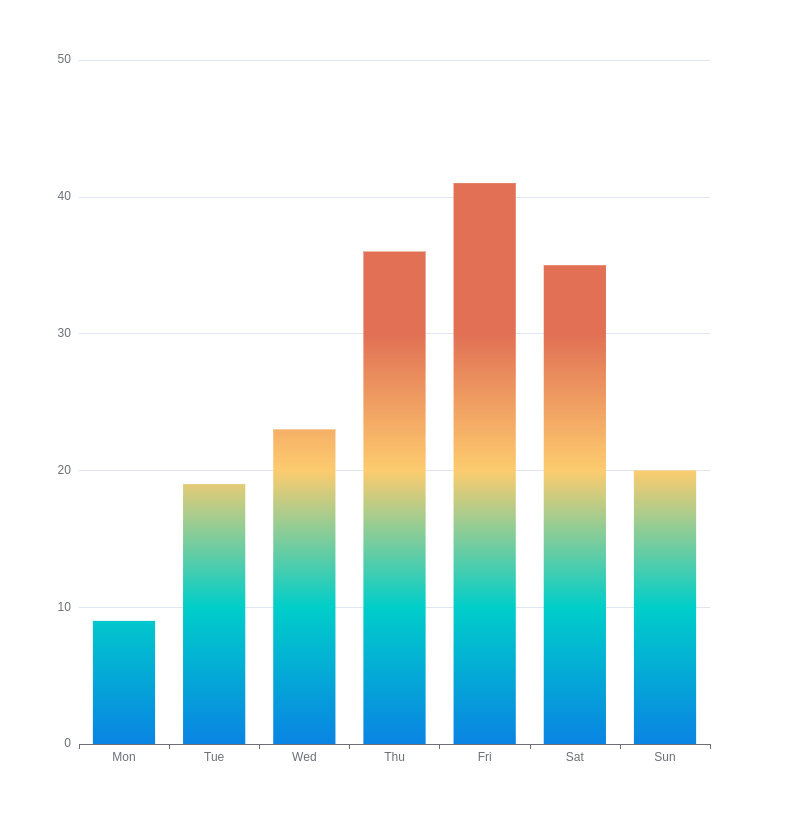
ECharts渐变直方图,根据具体的值调整色带,使所有颜色看起来协调一致。
直接在series数组中的对象中添加如下代码即可:
itemStyle: {
  color: function (params) {
    const cs = ['rgba(9, 132, 227, 1)', 'rgba(0, 206, 201, 1)', 'rgba(253, 203, 110, 1)', 'rgba(225, 112, 85, 1)']
    const step = 10
    const v = params.value
    const count = Math.floor(v / step) + 1
    const getGradientColor = (color1, color2, ratio) => {
      console.log(color1, color2)
      const rgba1 = color1.match(/\d+/g).map(Number);
      const rgba2 = color2.match(/\d+/g).map(Number);
      const r = Math.round(rgba1[0] + (rgba2[0] - rgba1[0]) * ratio);
      const g = Math.round(rgba1[1] + (rgba2[1] - rgba1[1]) * ratio);
      const b = Math.round(rgba1[2] + (rgba2[2] - rgba1[2]) * ratio);
      const a = Math.round(rgba1[3] + (rgba2[3] - rgba1[3]) * ratio);
      return `rgba(${r}, ${g}, ${b}, ${a})`;
    }
    let ecs = []
    for (let i = 0; i < count; i++) {
      const scale = 1 - i * step / v
      ecs = [...ecs, { offset: scale, color: cs[Math.min(3, i)] }]
    }
    const c = getGradientColor(cs[Math.min(3, count - 1)], cs[Math.min(3, count)], v % step / step)
    ecs = [...ecs, { offset: 0, color: c }]
    return new echarts.graphic.LinearGradient(0, 0, 0, 1, ecs)
  }
}
效果如下: