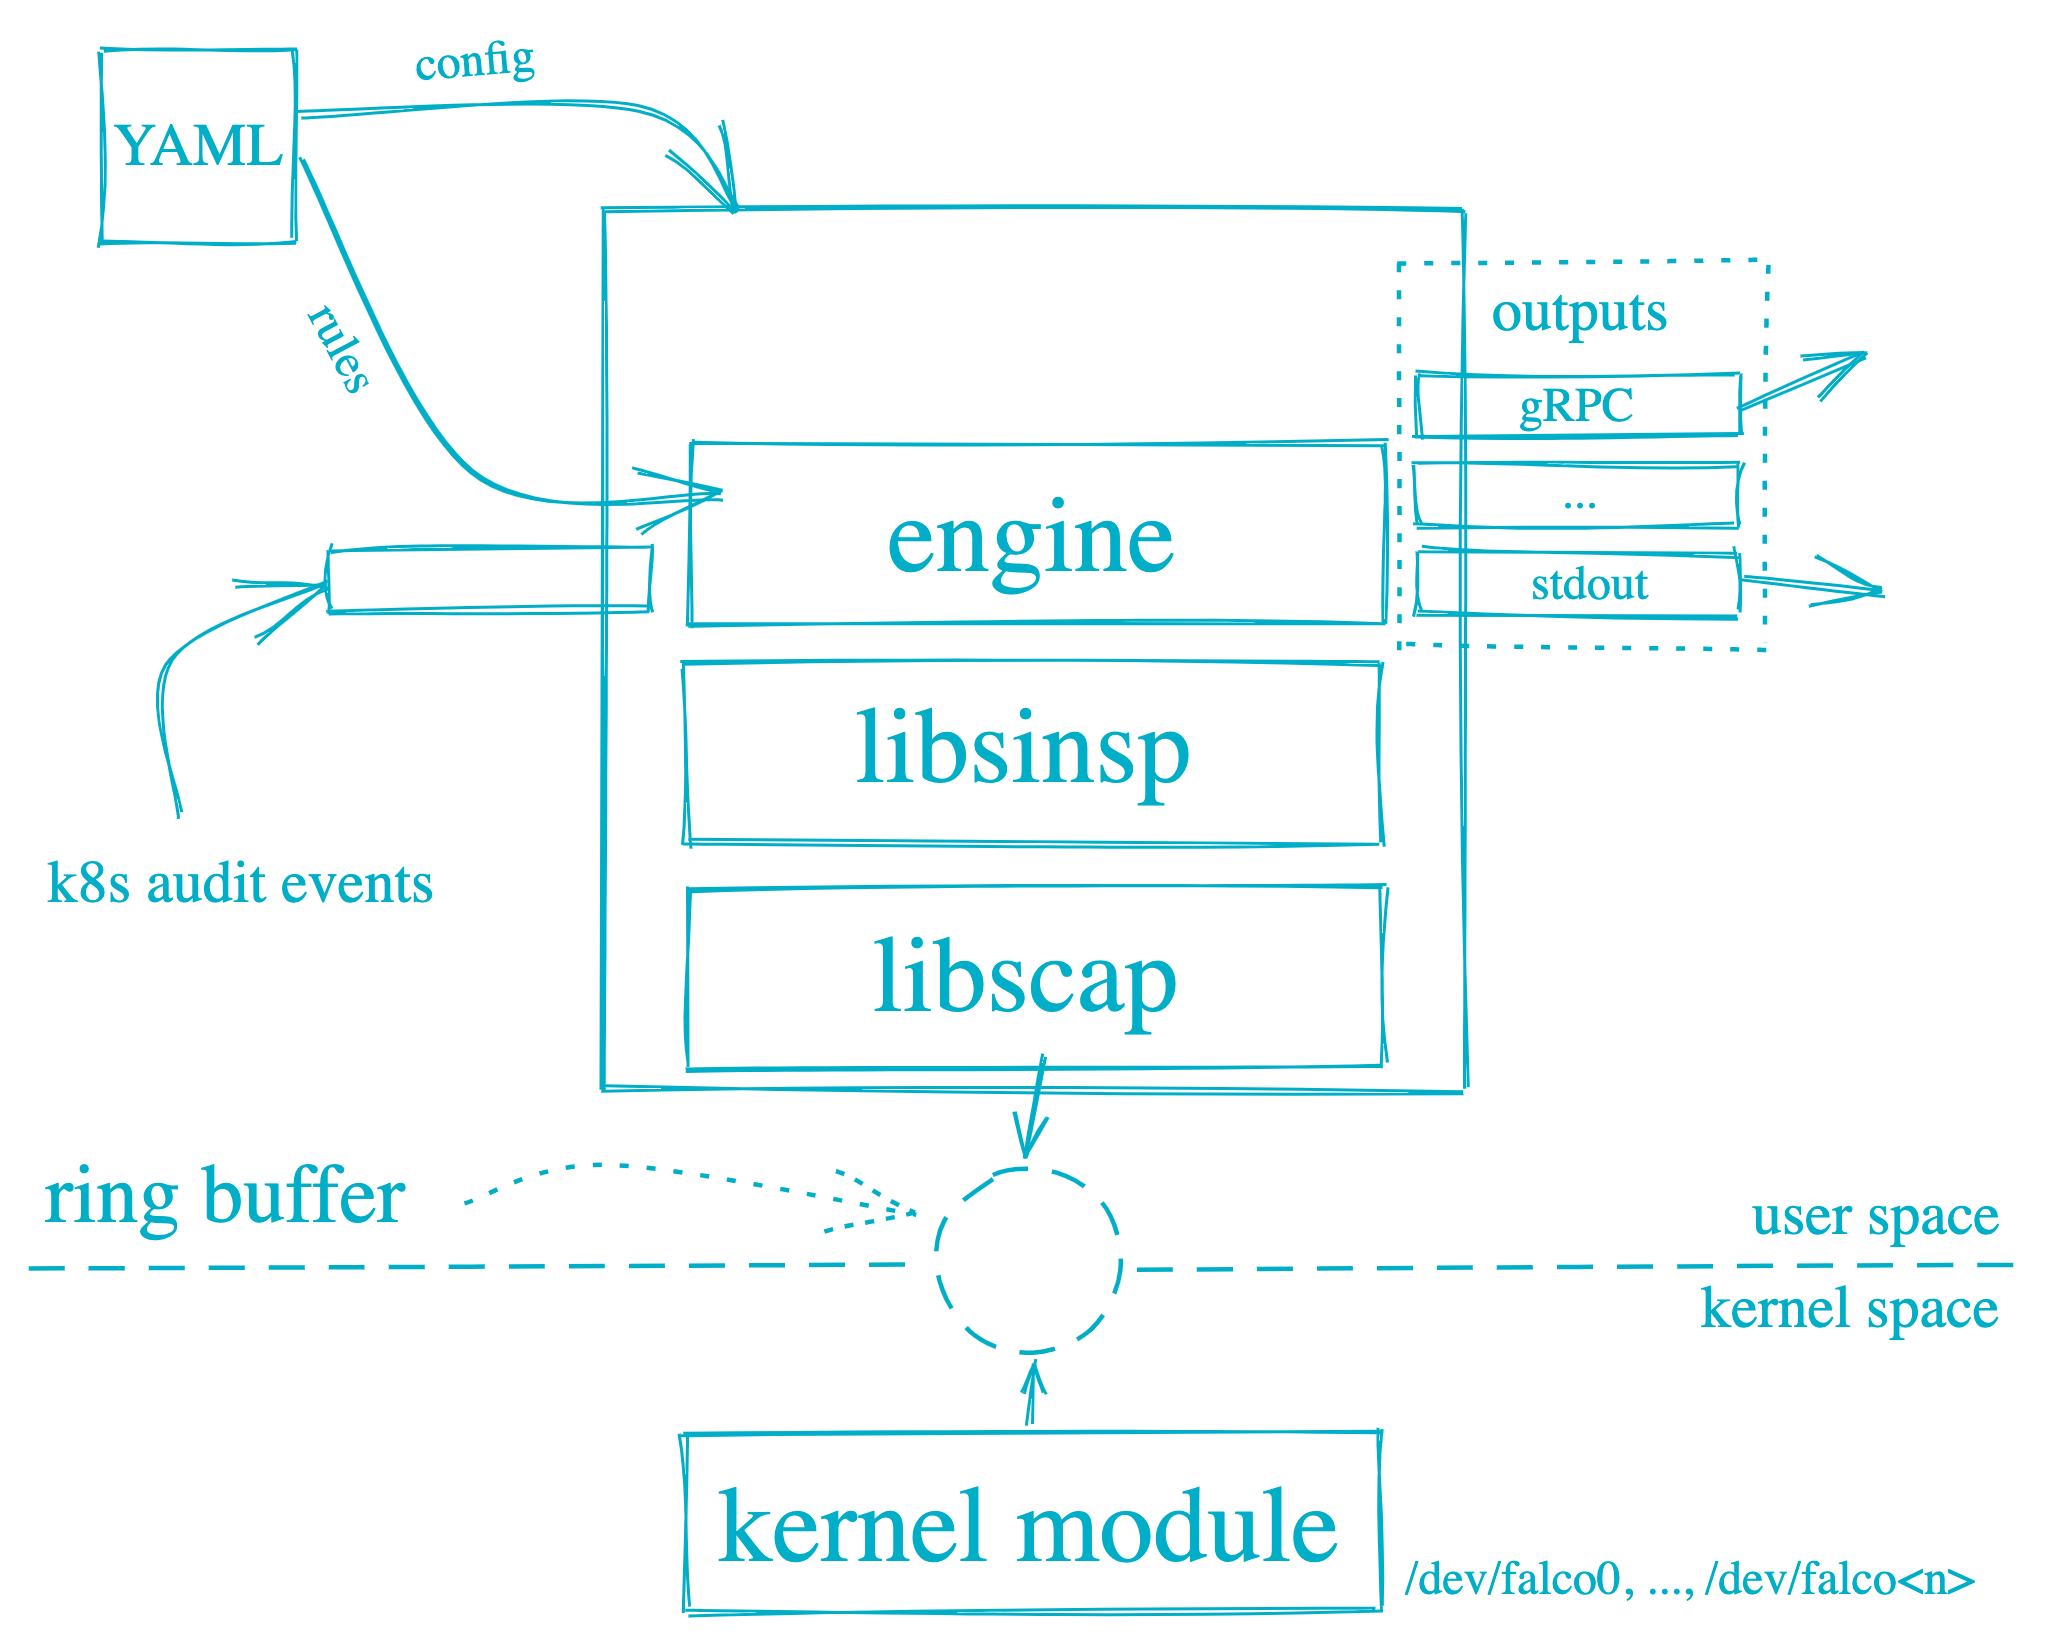
Falco是一个开源的云原生安全工具,使用C++编写,主要用于监控、检测和响应运行中的容器环境中的安全事件。官方GitHub仓库(https://github.com/falcosecurity/falco). Falco可以检测和警告涉及Linux系统调用的任何行为。Falco的原理如下图所示,Falco警报是基于特定的system calls, arguments, and properties of the calling process触发的。Falco在用户空间和内核空间运行。系统调用由Falco内核模块解释。然后使用用户空间中的库分析系统调用。然后使用配置Falco规则的规则引擎对事件进行筛选。然后,可疑事件被警告到配置为Syslog、文件、标准输出和其他的输出。
Falco的底层依赖sysdig开发的探针模块,架构图如下
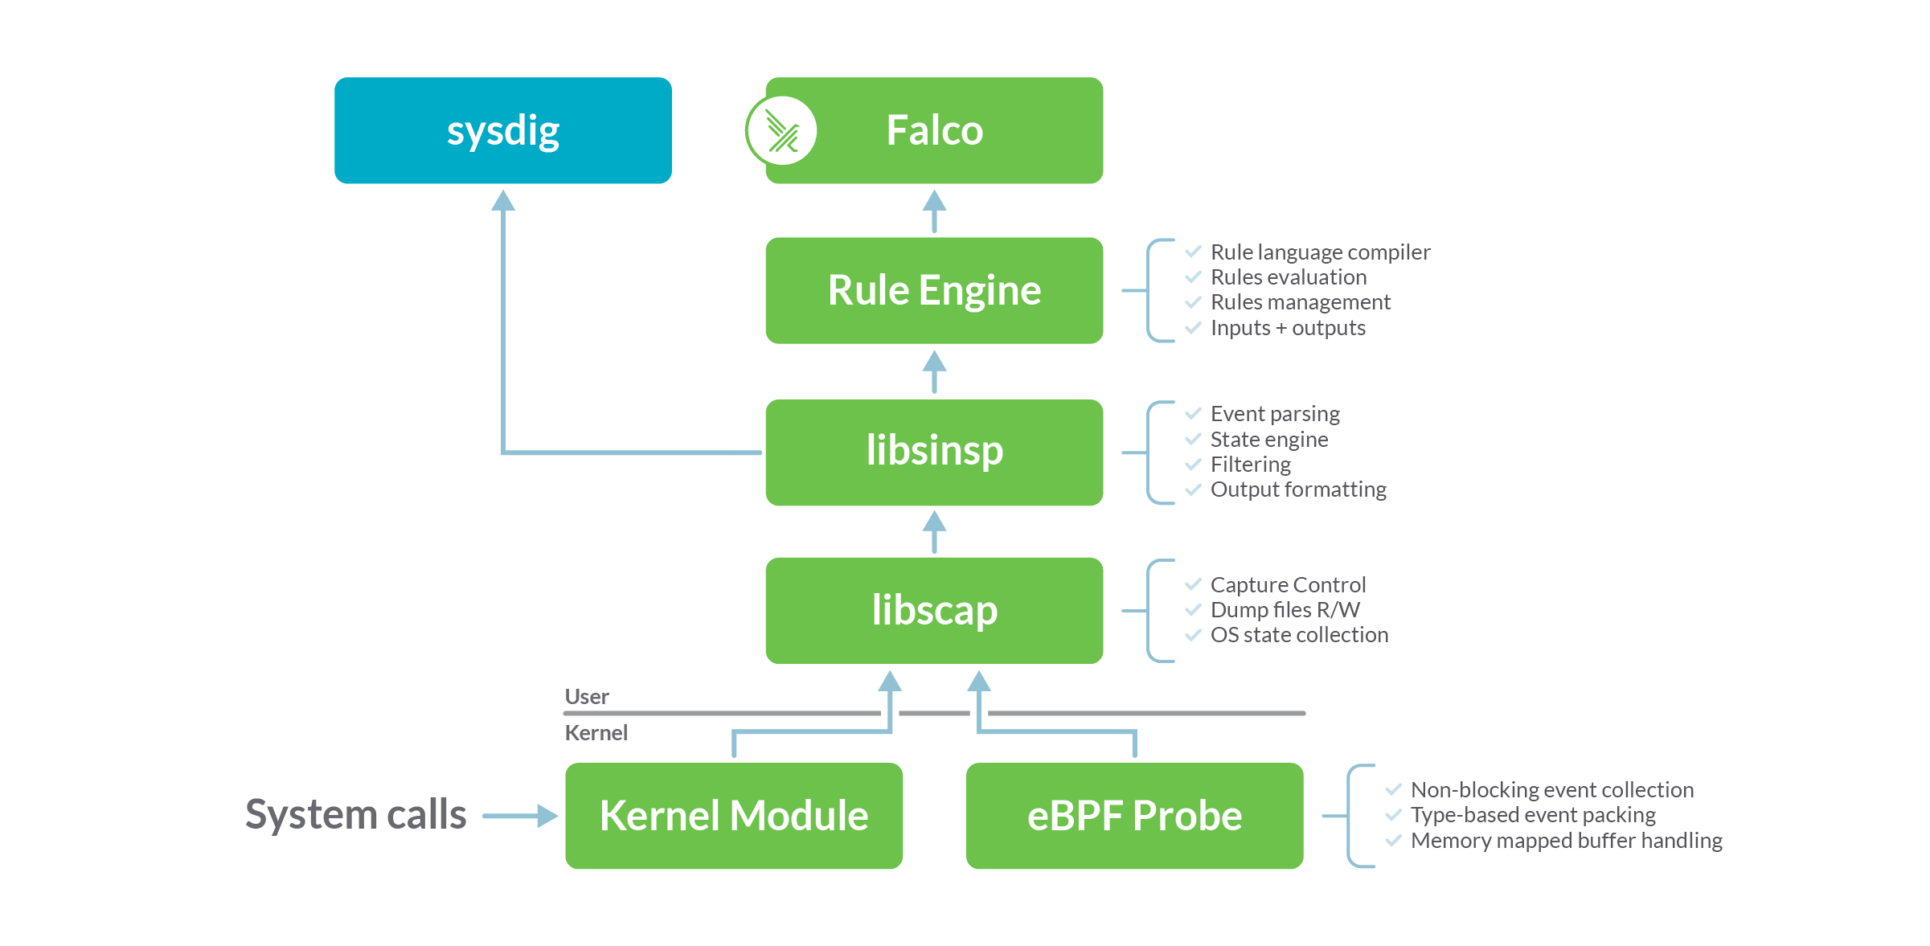
Falco和sysdig在相同的数据源上运行:系统调用。该数据源是使用内核模块或eBPF探针收集的。这两种方法在功能上是等效的,但是内核模块的效率稍微高一些,而eBPF方法更安全、更现代。Falco默认使用内核模块来收集系统调用,如果需要用eBPF探针则使用命令 falco --modern-bpf来运行进程
安装二进制falco
1. curl -L -O https://download.falco.org/packages/bin/x86_64/falco-0.34.1-x86_64.tar.gz
   curl -L -O https://download.falco.org/?prefix=packages/bin/aarch64/falco-0.34.1-x86_64.tar.gz
2. tar -xvf falco-0.34.1-x86_64.tar.gz
   cp -R falco-0.34.1-x86_64/* /
3. apt update -y
   apt install -y dkms make linux-headers-$(uname -r)
   # If you use the falco-driver-loader to build the BPF probe locally you need also clang toolchain
   apt install -y clang llvm
4. # If you want to install the kernel module
   falco-driver-loader module
   # If you want to install the eBPF probe
   falco-driver-loader bpf
5. # Kernel module (default driver)
   falco
   # eBPF probe
FALCO_BPF_PROBE="" falco
// modern eBPF probe
falco --modern-bpf
// For more info see all available options
falco --help
还可以以Daemonset的形式部署:https://github.com/falcosecurity/deploy-kubernetes/tree/main/kubernetes/falco/templates, 在已有集群中apply 这6个文件即可。这些YAML文件中有挂载本地文件的动作但是这些POD不依赖本地文件,但是,我目前运行起来后并不能实时告警(通过kubectl logs查看)过好久才有log. 关于falco daemonset 的配置说明可参考https://falco.org/docs/reference/daemon/config-options/
规则rule
关于容器创建的rule定义如下:
点击查看代码
- macro: container
  condition: (container.id != host)

- macro: container_started
  condition: >
    ((evt.type = container or
     (spawned_process and proc.vpid=1)) and
     container.image.repository != incomplete)
- macro: spawned_process
  condition: evt.type = execve and evt.dir = <
Condition语法
支持的syscall event
Condition支持的字段和输出
从以上定义可以看出是事件的类型是容器或者创建进程并且该进程的vpid为1,并且要满足容器的镜像仓库地址完整。其中evt.type可以通过事件的属性https://falco.org/docs/reference/rules/supported-fields/ (或者通过二进制文件falco --list=syscall查询)意思是该事件的名称是container,很显然这个事件名称并不是像open这样的原始事件名称,我们后续再探究。下一个spawned_process是一个宏:事件名是execve并且是出方向,并且vpid属性(the id of the process generating the event as seen from its current PID namespace)是1.
falco的eBPF探针
以falco-0.34.1为例,探针代码在falco-0.34.1-x86_64/usr/src/falco-4.0.0+driver/bpf下面的probe.c中定义,有以下几种类型:
BPF_PROBE("raw_syscalls/", sys_enter, sys_enter_args)
BPF_PROBE("raw_syscalls/", sys_exit, sys_exit_args)
BPF_PROBE("sched/", sched_process_exit, sched_process_exit_args)
BPF_PROBE("sched/", sched_switch, sched_switch_args)
BPF_PROBE("exceptions/", page_fault_user, page_fault_args)
BPF_PROBE("exceptions/", page_fault_kernel, page_fault_args)
BPF_PROBE("signal/", signal_deliver, signal_deliver_args)
BPF_PROBE("sched/", sched_process_exec, sched_process_exec_args)
下面以tracepoint:syscalls:sys_enter为例分析下,Falco是如何利用eBPF来采集系统调用的详细信息的。
点击查看代码
BPF_PROBE("raw_syscalls/", sys_enter, sys_enter_args)
{
      ...
      // 获取系统调用的系统调用相关信息
      id =bpf_syscall_get_nr(ctx);
      sc_evt =get_syscall_info(id);
      evttype = sc_evt->enter_event_type;
      ...
      // 调用具体系统调用的信息采集方法
#ifdef BPF_SUPPORTS_RAW_TRACEPOINTS
      call_filler(ctx, ctx, evt_type, settings, drop_flags);
#else
      /* Duplicated here to avoid verifier madness */
      structsys_enter_args stack_ctx;

      memcpy(stack_ctx.args, ctx->args,sizeof(ctx->args));
      if(stash_args(stack_ctx.args))
            return0;
      call_filler(ctx,&stack_ctx, evt_type, settings, drop_flags);#endif
      return0;
}
点击查看代码
static __always_inline void call_filler(void *ctx,
                              void *stack_ctx,
                              enum ppm_event_typeevt_type,
                              struct sysdig_bpf_settings *settings,
                              enum syscall_flags drop_flags)
{
      ...
      bpf_tail_call(ctx,&tail_map, filler_info->filler_id);
      bpf_printk("Can't tail call fillerevt=%d, filler=%d\n",
               state->tail_ctx.evt_type,
               filler_info->filler_id);
      ...}
点击查看代码
struct bpf_map_def __bpf_section("maps") tail_map ={
      .type = BPF_MAP_TYPE_PROG_ARRAY,
      .key_size =sizeof(u32),
      .value_size =sizeof(u32),
      .max_entries = PPM_FILLER_MAX,
};
点击查看代码
#define FILLER(x,is_syscall)                               \
static__always_inline int__bpf_##x(struct filler_data *data);         \
                                                      \
__bpf_section(TP_NAME "filler/" #x)                         \
static__always_inline int bpf_##x(void*ctx)                     \
{                                                     \
      struct filler_data data;                              \
      intres;                                        \
                                                      \
      res=init_filler_data(ctx,&data,is_syscall);             \
      if(res==PPM_SUCCESS){                             \
            if(!data.state->tail_ctx.len)                        \
                  write_evt_hdr(&data);                     \
            res=__bpf_##x(&data);                         \
      }                                               \
                                                      \
      if(res==PPM_SUCCESS)                               \
            res=push_evt_frame(ctx,&data);               \
                                                      \
      if(data.state)                                       \
            data.state->tail_ctx.prev_res=res;                  \
                                                      \
      bpf_tail_call(ctx,&tail_map,PPM_FILLER_terminate_filler);\
      bpf_printk("Can't tail call terminate filler\n");           \
      return 0;                                       \
}                                                     \
                                                      \
static__always_inline int __bpf_##x(struct filler_data *data)          \

FILLER(sys_open_x,true)
{
      ...
      // 调用参数采集
      res = bpf_val_to_ring(data, dev);
      return res;
}
FILLER(sys_empty,true)
...
点击查看代码
static __always_inline int __bpf_sys_open_x(struct filler_data *data);

__bpf_section(TP_NAME "filler/" sys_open_x)
static __always_inline int bpf_sys_open_x(void *ctx)
{
      ...
      // 调用实际的信息获取的方法,采集系统调用信息
      res = __bpf_sys_open_x(&data);
      ...
      if(res == PPM_SUCCESS)
            // 将采集的数据发送给用户态程序
            res = push_evt_frame(ctx,&data);
      ...
}

static __always_inline int __bpf_sys_open_x(struct filler_data *data)
{
...
      // 调用参数采集,并将结果填充到data结构体中
      if(retval <0||!bpf_get_fd_dev_ino(retval,&dev,&ino))
            dev =0;
      res = bpf_val_to_ring(data, dev);
      return res;
}
static __always_inline int push_evt_frame(void *ctx,
                                struct filler_data *data)
{
      ...

#ifdef BPF_FORBIDS_ZERO_ACCESS
      int res = bpf_perf_event_output(ctx,
                              &perf_map,
                              BPF_F_CURRENT_CPU,
                              data->buf,
                              ((data->state->tail_ctx.len -1)& SCRATCH_SIZE_MAX)+1);
#else
      int res = bpf_perf_event_output(ctx,
                              &perf_map,
                              BPF_F_CURRENT_CPU,
                              data->buf,
                              data->state->tail_ctx.len & SCRATCH_SIZE_MAX);
#endif
点击查看代码
struct bpf_map_def __bpf_section("maps") perf_map ={
      .type = BPF_MAP_TYPE_PERF_EVENT_ARRAY,
      .key_size =sizeof(u32),
      .value_size =sizeof(u32),// 只能是 sizeof(u32) ,代表的是 perf_event 的文件描述符
      .max_entries =0,//是perf_event 的文件描述符数量。
};
在这时用户态程序就可以从perf 缓冲区中获取到记录数据,传入Falco的规则引擎中进行匹配分析。
参考文献
[1]. http://blog.nsfocus.net/falco-ebpf/
[2]. https://lwn.net/Articles/645169/
[3]. https://www.ebpf.top/post/bpf_ring_buffer