项目概要
网络爬虫通常被称为爬虫,是搜索引擎的重要组成部分。
随着信息技术的飞速进步,作为搜索引擎的一个组成部分,爬虫一直是研究的热点,它为大数据时代提供了数据支撑。而数据分析正是利用爬取的数据进行分析得到有益结论,通常的手段便是进行可视化分析。
本项目爬取前程无忧网站,选取数据库工程师、网络工程师、算法工程师三个热门技术为关键词,为我们在找工作过程中提供一定帮助。
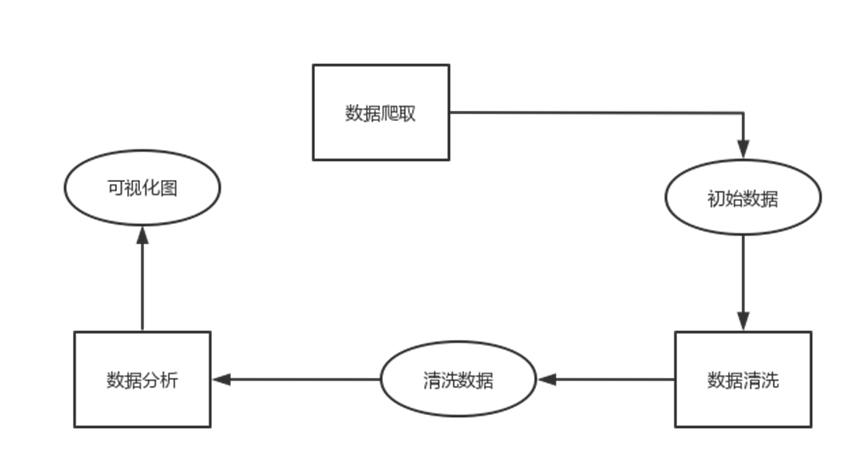
项目架构上首先进行数据爬取,将数据存储到excel表中,接着进行数据清洗并将数据存入mongodb数据库,最后将数据进行分析并可视化。
项目实现
数据展示(以数据工程师为例)
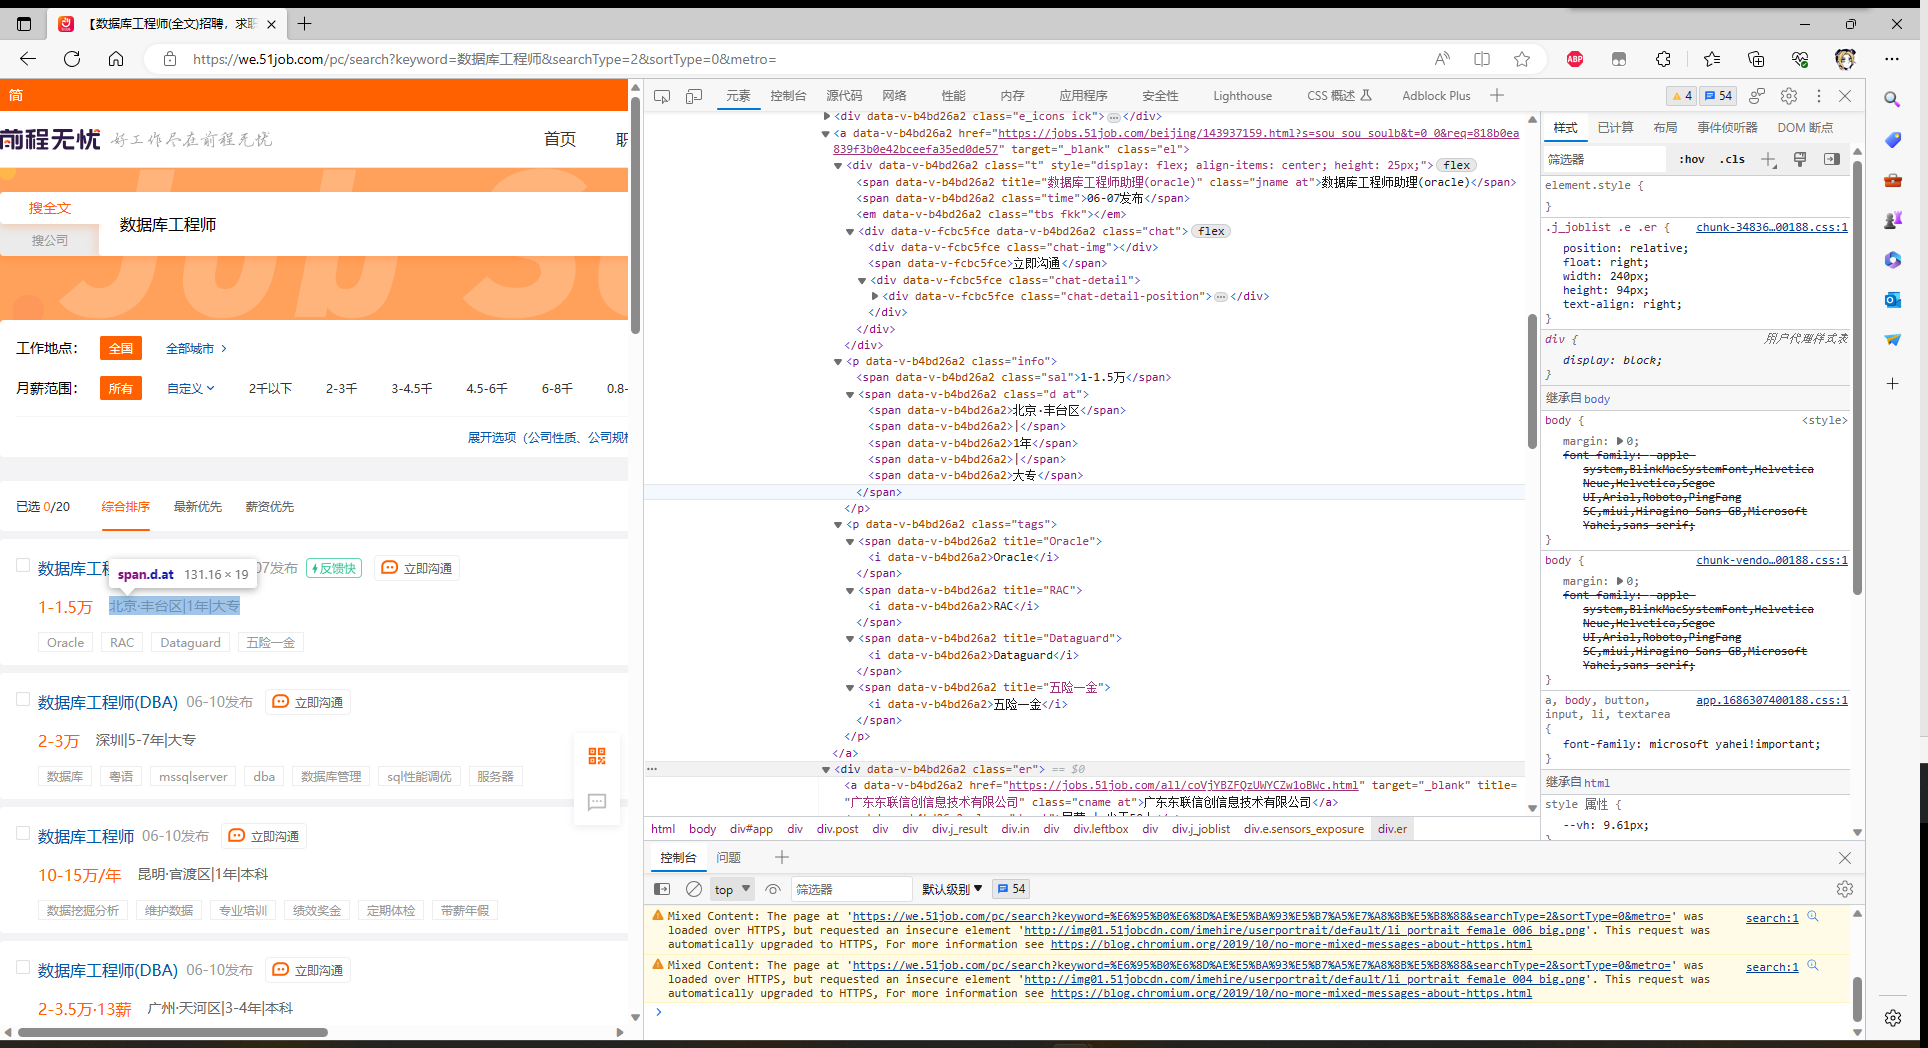
爬取页面展示

html页面解析
数据爬取
代码开始时导入所需的库。这包括Selenium库用于模拟浏览器行为,ChromeOptions用于配置浏览器选项,By类用于定位元素,time库用于添加延时,pandas库用于数据处理,lxml库用于解析HTML,random库用于随机延时。
from selenium import webdriver
from selenium.webdriver import ChromeOptions
from selenium.webdriver.common.by import By
from time import sleep
import pandas as pd
from lxml import etree
import random
然后定义主函数main(),在主函数中,首先初始化一个空列表resLs来存储爬取到的数据。然后使用for循环遍历关键字列表,这里的关键字是数据库工程师, 网络工程师, 算法工程师。
接着配置浏览器和访问网页。在每次迭代开始之前,配置ChromeOptions并实例化一个ChromeDriver。然后使用driver.get()方法访问前程无忧网页,URL中包含了关键字参数和其他筛选条件。
然后在for循环中,首先使用随机延时模拟操作。然后使用JavaScript代码window.scrollBy(0, 50)模拟页面滚动以加载更多的职位列表。接下来使用driver.page_source获取当前页面的HTML源代码,并使用lxml库的etree模块解析HTML。使用XPath表达式提取所需的职位信息,例如职位名称等。将这些信息存储在字典dic中并打印出来。将字典dic添加到resLs列表中,以便稍后转换为Excel文件。
接着进行数据存储。在每次迭代结束时,使用pandas库将resLs列表转换为DataFrame,并使用to_excel()方法将数据保存为Excel文件。
下面进行翻页处理。如果当前页不是最后一页,通过定位页面的跳转输入框和跳转按钮,清空输入框并输入下一页的页码,然后模拟点击跳转按钮,这样可以实现翻页功能。这里使用了find_element()方法和By类来定位元素。
在程序的最后部分,通过设置pz为50,确定了要爬取的页数。然后遍历关键字列表,配置浏览器选项访问网页,并调用主函数main()进行数据爬取。最后关闭浏览器。
具体代码
# coding=gbk
# -*- coding:uft-8 -*-
# 数据爬取

from selenium import webdriver
from selenium.webdriver import ChromeOptions
from selenium.webdriver.common.by import By
from time import sleep
import pandas as pd
from lxml import etree
import random


def main():
    resLs = []
    for p in range(pz):
        p += 1
        print(f'爬取第{p}页>>>')
        sleep(2)
        for i in range(140):
            sleep(random.random() / 10)
            driver.execute_script('window.scrollBy(0, 50)')
        res = driver.page_source
        tree = etree.HTML(res)
        for li in tree.xpath('//div[@class="j_joblist"]/div'):
            name = li.xpath('.//span[@class="jname at"]/text()')[0]
            href = li.xpath('./a/@href')[0]
            time = li.xpath('.//span[@class="time"]/text()')[0]
            sala = (li.xpath('.//span[@class="sal"]/text()') + [''])[0]
            addr = (li.xpath('.//span[@class="d at"]/span/text()') + [''] * 5)[0]
            exp = (li.xpath('.//span[@class="d at"]/span/text()') + [''] * 5)[2]
            edu = (li.xpath('.//span[@class="d at"]/span/text()') + [''] * 5)[4]
            comp = li.xpath('.//a[@class="cname at"]/text()')[0]
            kind = li.xpath('.//p[@class="dc at"]/text()')[0].split('|')[0].strip()
            num = (li.xpath('.//p[@class="dc at"]/text()')[0].split('|') + [''])[1].strip()
            ind = (li.xpath('.//p[@class="int at"]/text()') + [''])[0]
            dic = {
                '标题': name,
                '薪资': sala,
                '地区': addr,
                '经验': exp,
                '学历': edu,
                '公司': comp,
                '类型': kind,
                '规模': num,
                '行业': ind
            }
            print(dic)
            resLs.append(dic)
        pd.DataFrame(resLs).to_excel(f'data/{key}.xlsx', index=False, encoding='utf-8')
        if p != pz:
            driver.find_element(By.ID, 'jump_page').clear()
            driver.find_element(By.ID, 'jump_page').send_keys(p + 1)
            sleep(random.random())
            driver.find_element(By.CLASS_NAME, 'jumpPage').click()


if __name__ == '__main__':
    pz = 50
    for key in ['数据库工程师', '网络工程师', '算法工程师']:
        options = ChromeOptions()
        options.add_experimental_option('excludeSwitches', ['enable-automation'])
        driver = webdriver.Chrome(options=options)
        js = open('stealth.min.js').read()
        driver.execute_cdp_cmd('Page.addScriptToEvaluateOnNewDocument', {'source': js})
        driver.get(f'https://we.51job.com/pc/search?keyword={key}&searchType=2&sortType=0&metro=')
        sleep(2)
        main()
        driver.quit()
数据入库
具体代码
# coding=gbk
# -*- coding:uft-8 -*-
# 数据入库

import pymongo
import pandas as pd


def clearSalary(string):
    try:
        firstNum = string.split('-')[0]
        firstNum = eval(firstNum.strip('千万'))
        if '千' in string:
            num = firstNum * 1000
        elif '万' in string:
            num = firstNum * 10000
        if '年' in string:
            num /= 12
        return num
    except:
        return None


def clear(df):
    df['薪资'] = df['薪资'].apply(clearSalary)
    df.duplicated(keep='first')
    df.dropna(how='any', inplace=True)
    return df


def insert():
    df = pd.read_excel(f'data/{key}.xlsx', engine='openpyxl')
    df = clear(df)
    resLs = df.to_dict(orient='records')
    for res in resLs:
        res['key'] = key
        collection.insert_one(res)
        print(res)


if __name__ == '__main__':
    client = pymongo.MongoClient('mongodb://root:abc_123456@localhost:27017')
    db = client.test
    collection = db.job
    for key in ['数据库工程师', '网络工程师', '算法工程师']:
        insert()
爬取结果

数据清洗
首先清洗薪资数据,定义了函数clearSalary,用于清洗薪资数据。该函数根据输入的字符串判断薪资范围,并将其转换为数值。通过计算将薪资单位转换为元,如果薪资是按年计算的,还需要将其转换为按月计算的数值。最后返回清洗后的数值或None。
下面定义了函数clear,该函数接收一个DataFrame作为输入,并调用clearSalary函数清洗薪资列。然后使用duplicated方法查找重复值并去除,使用dropna方法去除含有空值的行。最后返回清洗后的DataFrame。
接着定义了函数insert,用于将清洗后的数据插入数据库。在函数中首先使用pandas库的read_excel方法读取之前爬取的Excel文件,然后调用clear函数进行数据清洗。接下来将DataFrame转换为字典列表。
在主程序的最后部分,首先使用pymongo库的MongoClient方法连接到MongoDB数据库。在for循环中,遍历关键字列表,在每次迭代中调用insert函数将清洗后的数据插入数据库。
具体代码
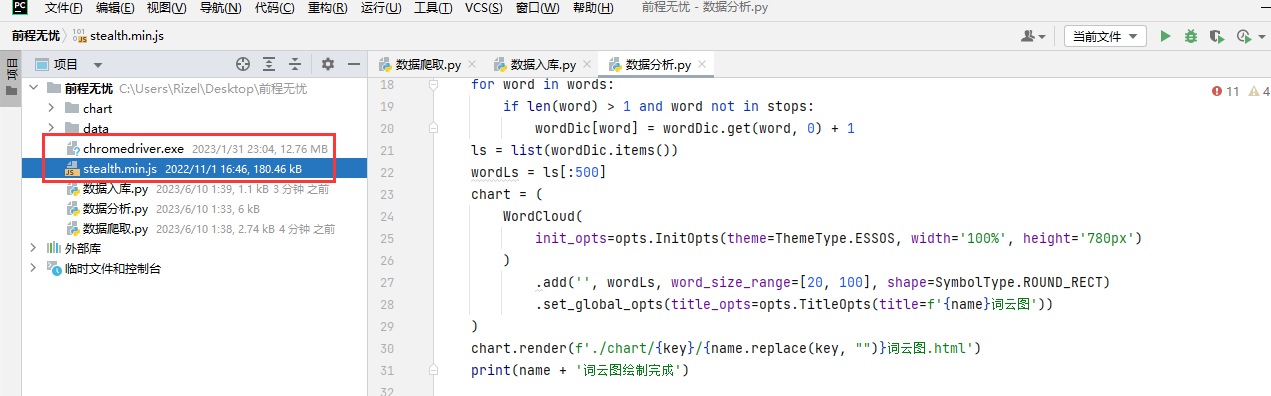
# coding=gbk
# -*- coding:uft-8 -*-
# 数据分析

import jieba
import pandas as pd
from pyecharts import options as opts
from pyecharts.charts import Bar, WordCloud, Pie, Line
from pyecharts.globals import ThemeType, SymbolType
import pymongo


def createWordCould(txt, name):
    print(name + '词云图绘制')
    words = jieba.cut(txt)
    wordDic = {}
    stops = []
    for word in words:
        if len(word) > 1 and word not in stops:
            wordDic[word] = wordDic.get(word, 0) + 1
    ls = list(wordDic.items())
    wordLs = ls[:500]
    chart = (
        WordCloud(
            init_opts=opts.InitOpts(theme=ThemeType.ESSOS, width='100%', height='780px')
        )
            .add('', wordLs, word_size_range=[20, 100], shape=SymbolType.ROUND_RECT)
            .set_global_opts(title_opts=opts.TitleOpts(title=f'{name}词云图'))
    )
    chart.render(f'./chart/{key}/{name.replace(key, "")}词云图.html')
    print(name + '词云图绘制完成')


def posiDraw(posiLs, name):
    print(f'{name}排行柱状图绘制')
    dic = {}
    for posi in posiLs:
        dic[posi] = dic.get(posi, 0) + 1
    items = list(dic.items())
    items.sort(key=lambda x: x[1], reverse=True)
    posiLs = [item[0] for item in items][:9]
    numLs = [item[1] for item in items][:9]
    chart = (
        Bar(
            init_opts=opts.InitOpts(theme=ThemeType.PURPLE_PASSION, width='100%', height='780px')
        )
            .add_xaxis(posiLs)
            .add_yaxis('数量', numLs)
            .set_colors(['#e098c6'])
            .set_global_opts(title_opts=opts.TitleOpts(title=f'{name}排行柱状图'))
    )
    chart.render(f'./chart/{key}/{name.replace(key, "")}排行柱状图.html')
    print(f'{name}排行柱状图绘制完成')


def pieDraw(labelLs, countLs, name):
    print(f'{name}分布饼状图绘制')
    chart = (
        Pie(
            init_opts=opts.InitOpts(theme=ThemeType.DARK, width='100%', height='780px')
        )
            .add('', [list(z) for z in zip(labelLs, countLs)])
            .set_global_opts(title_opts=opts.TitleOpts(title=f'{name}分布饼状图'))
            .set_series_opts(label_opts=opts.LabelOpts(formatter='{b}: {c}'))
    )
    chart.render(f'./chart/{key}/{name.replace(key, "")}分布饼状图.html')
    print(f'{name}分布饼状图绘制完成')


def lineDraw(cityLs, salaLs, name):
    print(name + '主要城市平均薪资折线图')
    chart = (
        Line(
            init_opts=opts.InitOpts(theme=ThemeType.SHINE, width='100%', height='780px')
        )
            .add_xaxis(cityLs)
            .add_yaxis('平均薪资', salaLs)
            .set_global_opts(title_opts=opts.TitleOpts(title=f'{name}主要城市平均薪资折线图'))
            .set_series_opts(label_opts=opts.LabelOpts(is_show=True))
    )
    chart.render(f'./chart/{key}/{name.replace(key, "")}主要城市平均薪资折线图.html')
    print(name + '主要城市平均薪资折线图绘制完成')


def posiPlusDraw(posiLs, numLs, name):
    print(f'{name}对比柱状图绘制')
    chart = (
        Bar(
            init_opts=opts.InitOpts(theme=ThemeType.WESTEROS, width='100%', height='780px')
        )
            .add_xaxis(posiLs)
            .add_yaxis('最低薪资', numLs[0])
            .add_yaxis('平均薪资', numLs[1])
            .add_yaxis('最高薪资', numLs[2])
            .set_global_opts(title_opts=opts.TitleOpts(title=f'{name}排行柱状图'))
    )
    chart.render(f'./chart/{key}/{name.replace(key, "")}对比柱状图.html')
    print(f'{name}对比柱状图绘制完成')


def main():
    global key
    query = {'key': key}
    resLs = collection.find(query)
    df = pd.DataFrame(list(resLs))
    titleLs = df['标题'].tolist()
    titles = '/'.join(titleLs)
    createWordCould(titles, f'前程无忧{key}标题')
    df['地区'] = df['地区'].apply(lambda x: x.split('·')[0])
    posiLs = df['地区'].tolist()
    posiDraw(posiLs, f'前程无忧{key}城市职位数量')
    experLs = df['经验'].tolist()
    experDic = {}
    for exper in experLs:
        experDic[exper] = experDic.get(exper, 0) + 1
    experItem = list(experDic.items())
    experItem.sort(key=lambda x: x[1], reverse=True)
    pieDraw([i[0] for i in experItem], [i[1] for i in experItem], f'前程无忧{key}职位经验要求')
    eduLs = df['学历'].tolist()
    eduDic = {}
    for edu in eduLs:
        eduDic[edu] = eduDic.get(edu, 0) + 1
    eduItem = list(eduDic.items())
    eduItem.sort(key=lambda x: x[1], reverse=True)
    pieDraw([i[0] for i in eduItem], [i[1] for i in eduItem], f'前程无忧{key}职位学历要求')
    dic = {}
    for posi in posiLs:
        dic[posi] = dic.get(posi, 0) + 1
    items = list(dic.items())
    items.sort(key=lambda x: x[1], reverse=True)
    cityLs = [item[0] for item in items][:20]
    salaLs = []
    for city in cityLs:
        dfSelect = df[(df['key'] == key) & (df['地区'] == city)]
        salaLs.append(int(dfSelect['薪资'].mean()))
    dic = {}
    for i in range(len(cityLs)):
        dic[cityLs[i]] = salaLs[i]
    items = list(dic.items())
    items.sort(key=lambda x: x[1], reverse=True)
    cityLs = [item[0] for item in items][:8]
    salaLs = [item[1] for item in items][:8]
    lineDraw(cityLs, salaLs, f'前程无忧{key}职位')
    dic = {}
    numLs = [[], [], []]
    for posi in posiLs:
        dic[posi] = dic.get(posi, 0) + 1
    items = list(dic.items())
    items.sort(key=lambda x: x[1], reverse=True)
    posiLs = [item[0] for item in items][:9]
    for city in posiLs:
        dfSelect = df[(df['key'] == key) & (df['地区'] == city)]
        numLs[0].append(int(dfSelect['薪资'].min()))
        numLs[1].append(int(dfSelect['薪资'].mean()))
        numLs[2].append(int(dfSelect['薪资'].max()))
        posiPlusDraw(posiLs, numLs, f'前程无忧{key}职位城市薪资')


if __name__ == '__main__':
    client = pymongo.MongoClient('mongodb://root:abc_123456@localhost:27017')
    db = client.test
    collection = db.job
    for key in ['数据库工程师', '网络工程师', '算法工程师']:
        main()
可视化展示(以网络工程师为例)
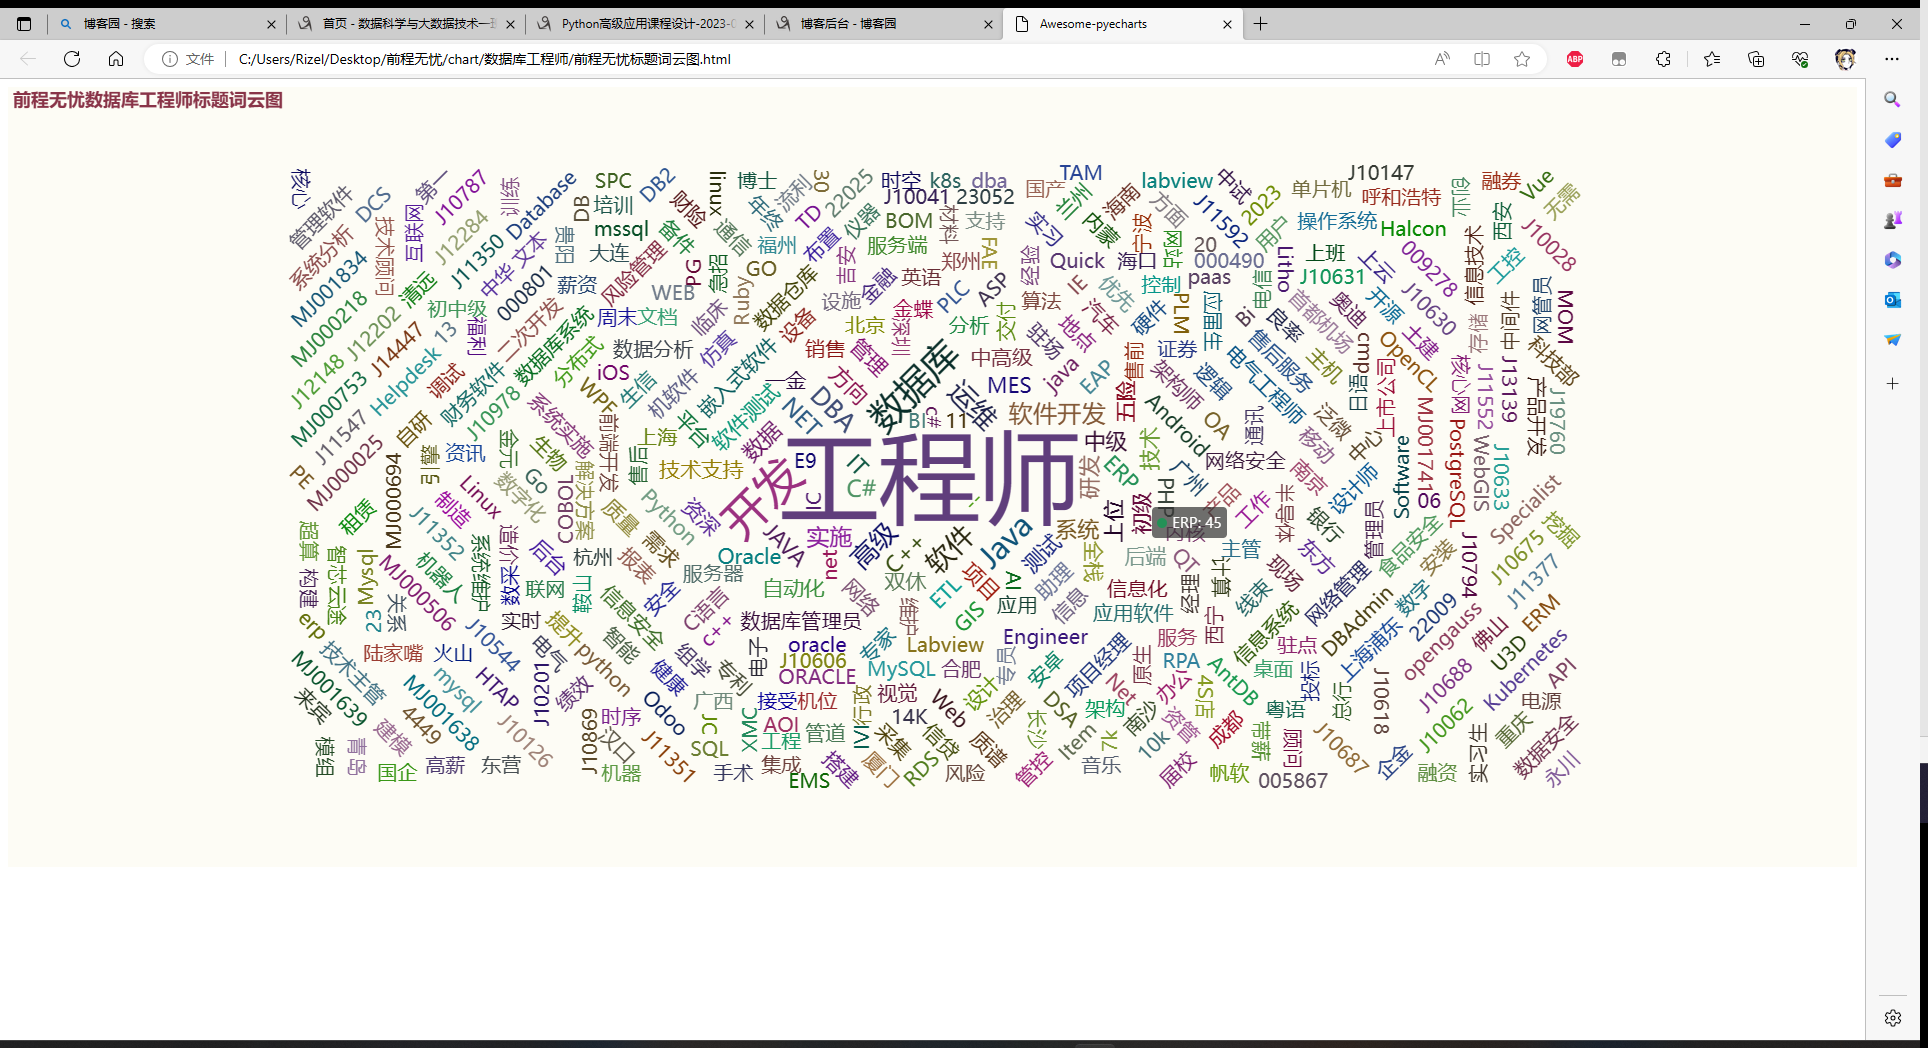
标题词云
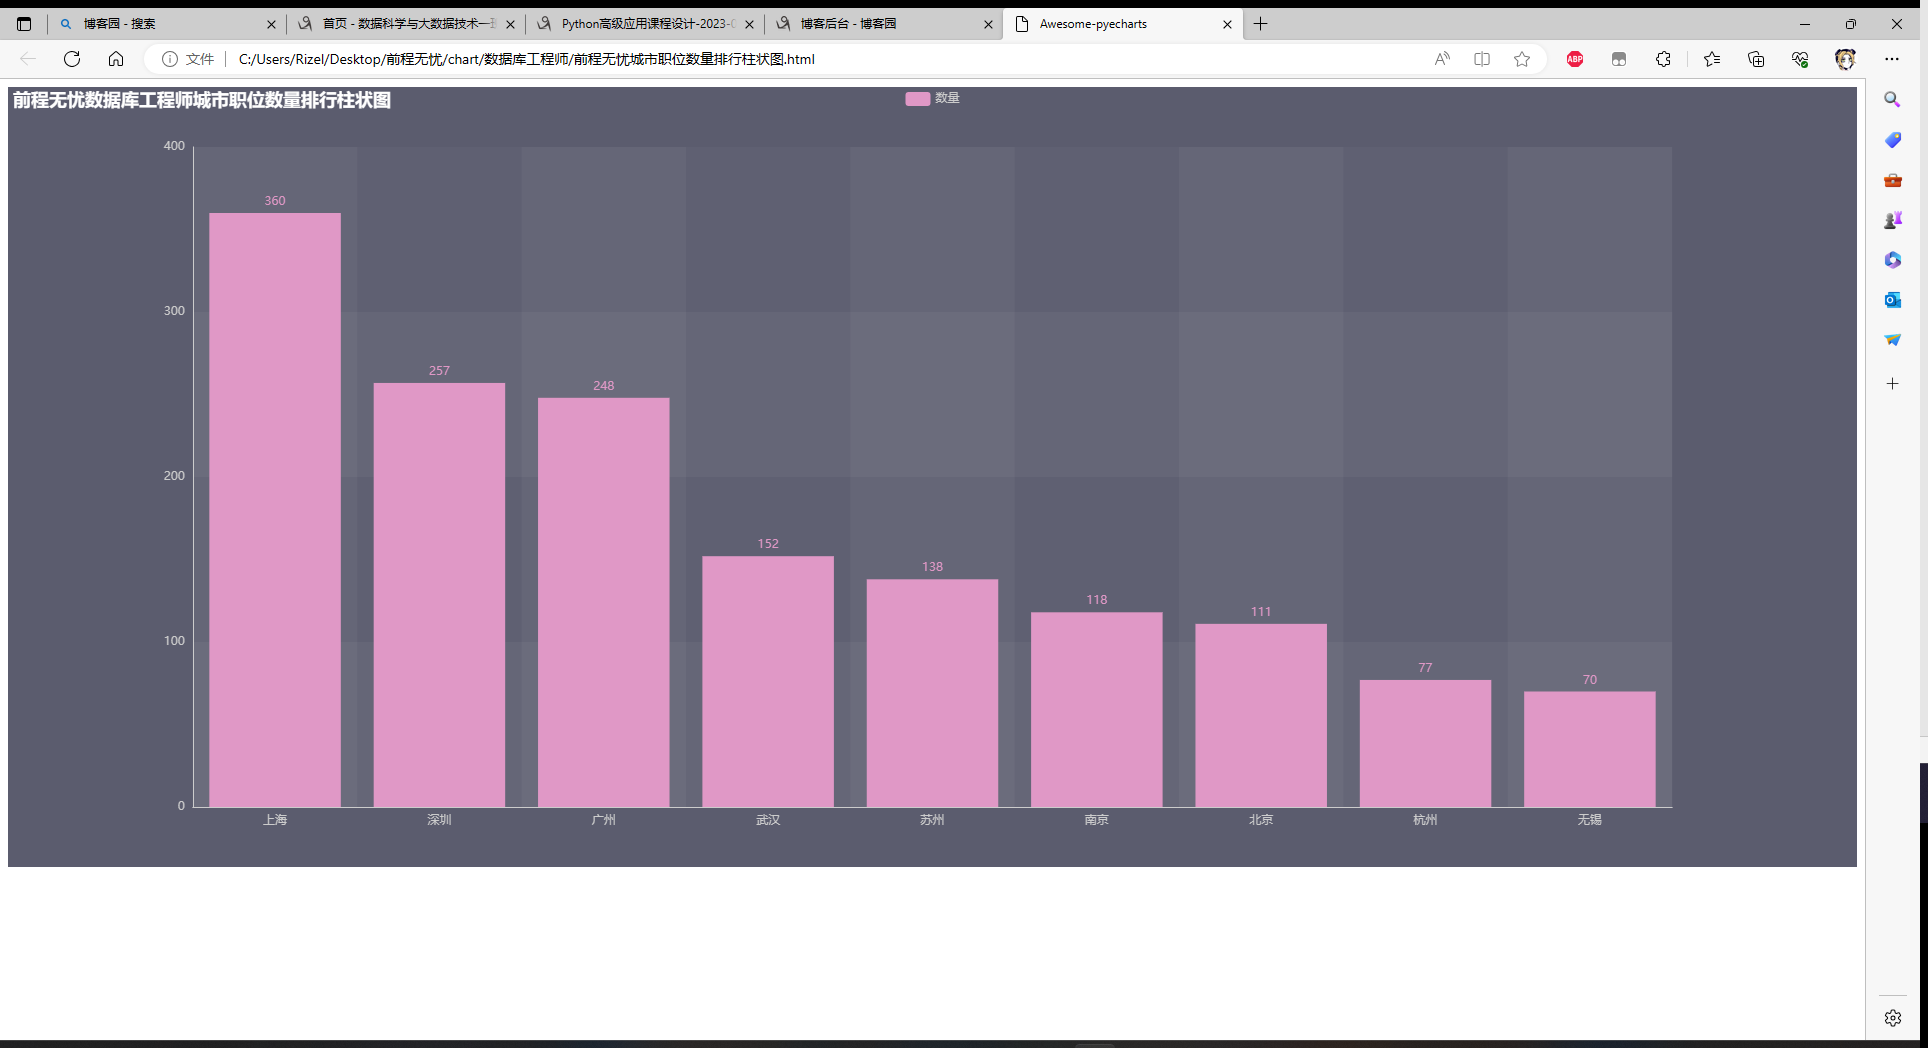
城市职位数量排行柱状图
主要城市平均薪资折线图

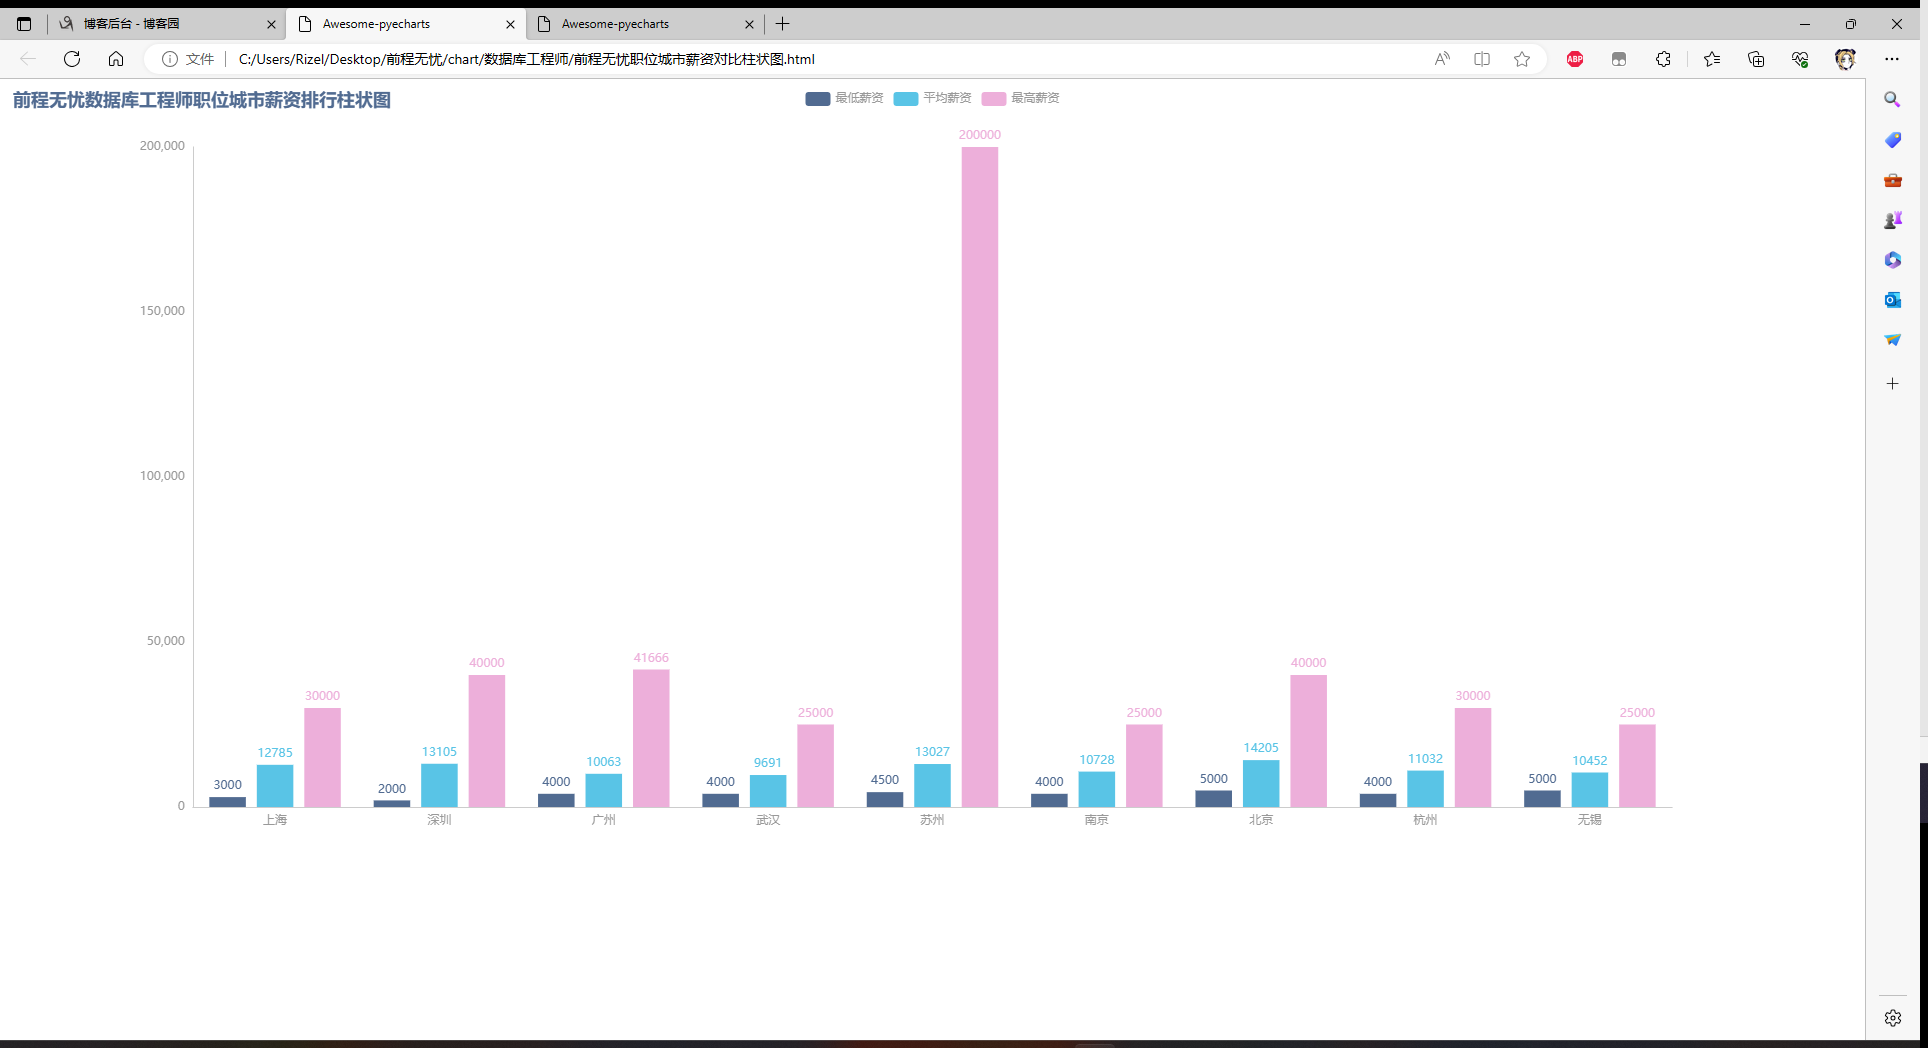
职位城市薪资对比柱状图
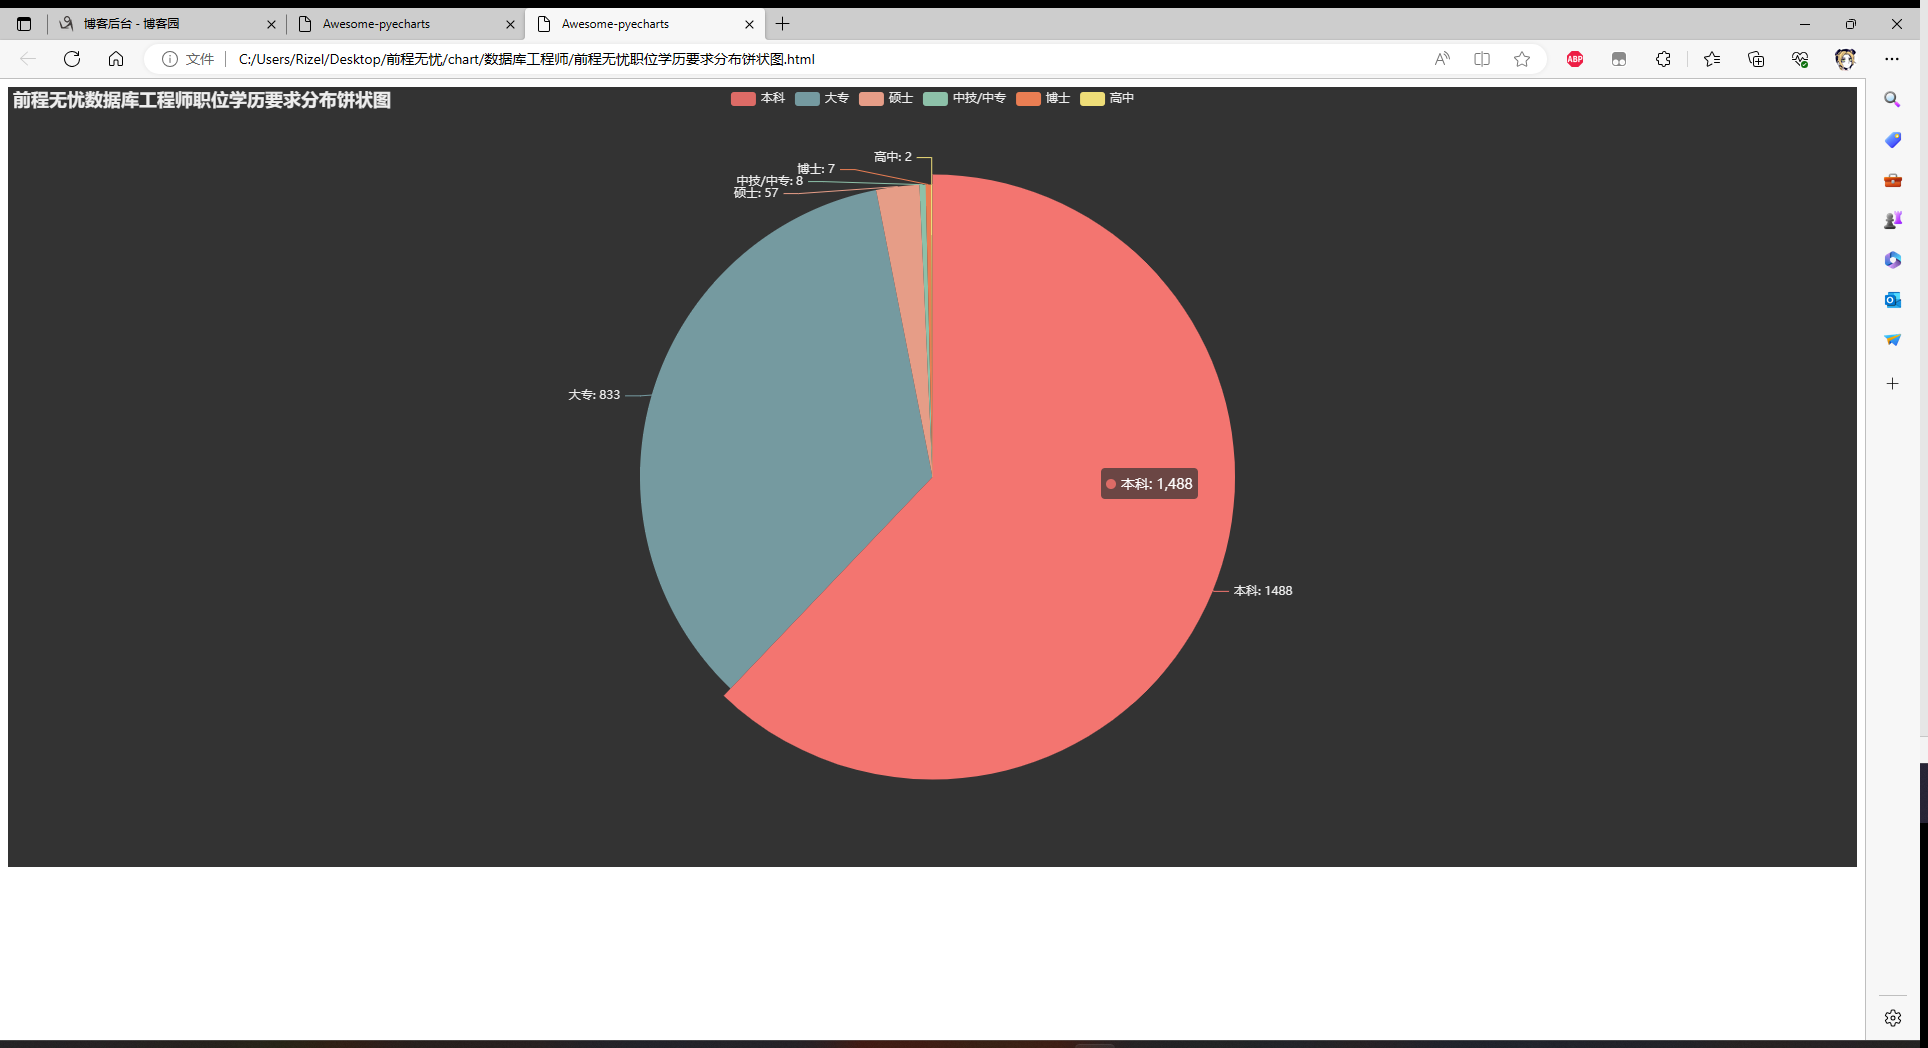
职位学历要求分布饼状图
职位经验要求分布饼状图

全部代码
数据爬取
# coding=gbk
# -*- coding:uft-8 -*-
# 数据爬取

from selenium import webdriver
from selenium.webdriver import ChromeOptions
from selenium.webdriver.common.by import By
from time import sleep
import pandas as pd
from lxml import etree
import random


def main():
    resLs = []
    for p in range(pz):
        p += 1
        print(f'爬取第{p}页>>>')
        sleep(2)
        for i in range(140):
            sleep(random.random() / 10)
            driver.execute_script('window.scrollBy(0, 50)')
        res = driver.page_source
        tree = etree.HTML(res)
        for li in tree.xpath('//div[@class="j_joblist"]/div'):
            name = li.xpath('.//span[@class="jname at"]/text()')[0]
            href = li.xpath('./a/@href')[0]
            time = li.xpath('.//span[@class="time"]/text()')[0]
            sala = (li.xpath('.//span[@class="sal"]/text()') + [''])[0]
            addr = (li.xpath('.//span[@class="d at"]/span/text()') + [''] * 5)[0]
            exp = (li.xpath('.//span[@class="d at"]/span/text()') + [''] * 5)[2]
            edu = (li.xpath('.//span[@class="d at"]/span/text()') + [''] * 5)[4]
            comp = li.xpath('.//a[@class="cname at"]/text()')[0]
            kind = li.xpath('.//p[@class="dc at"]/text()')[0].split('|')[0].strip()
            num = (li.xpath('.//p[@class="dc at"]/text()')[0].split('|') + [''])[1].strip()
            ind = (li.xpath('.//p[@class="int at"]/text()') + [''])[0]
            dic = {
                '标题': name,
                '薪资': sala,
                '地区': addr,
                '经验': exp,
                '学历': edu,
                '公司': comp,
                '类型': kind,
                '规模': num,
                '行业': ind
            }
            print(dic)
            resLs.append(dic)
        pd.DataFrame(resLs).to_excel(f'data/{key}.xlsx', index=False, encoding='utf-8')
        if p != pz:
            driver.find_element(By.ID, 'jump_page').clear()
            driver.find_element(By.ID, 'jump_page').send_keys(p + 1)
            sleep(random.random())
            driver.find_element(By.CLASS_NAME, 'jumpPage').click()


if __name__ == '__main__':
    pz = 50
    for key in ['数据库工程师', '网络工程师', '算法工程师']:
        options = ChromeOptions()
        options.add_experimental_option('excludeSwitches', ['enable-automation'])
        driver = webdriver.Chrome(options=options)
        js = open('stealth.min.js').read()
        driver.execute_cdp_cmd('Page.addScriptToEvaluateOnNewDocument', {'source': js})
        driver.get(f'https://we.51job.com/pc/search?keyword={key}&searchType=2&sortType=0&metro=')
        sleep(2)
        main()
        driver.quit()
数据入库
# coding=gbk
# -*- coding:uft-8 -*-
# 数据入库

import pymongo
import pandas as pd


def clearSalary(string):
    try:
        firstNum = string.split('-')[0]
        firstNum = eval(firstNum.strip('千万'))
        if '千' in string:
            num = firstNum * 1000
        elif '万' in string:
            num = firstNum * 10000
        if '年' in string:
            num /= 12
        return num
    except:
        return None


def clear(df):
    df['薪资'] = df['薪资'].apply(clearSalary)
    df.duplicated(keep='first')
    df.dropna(how='any', inplace=True)
    return df


def insert():
    df = pd.read_excel(f'data/{key}.xlsx', engine='openpyxl')
    df = clear(df)
    resLs = df.to_dict(orient='records')
    for res in resLs:
        res['key'] = key
        collection.insert_one(res)
        print(res)


if __name__ == '__main__':
    client = pymongo.MongoClient('mongodb://root:abc_123456@localhost:27017')
    db = client.test
    collection = db.job
    for key in ['数据库工程师', '网络工程师', '算法工程师']:
        insert()
数据分析/可视化
# coding=gbk
# -*- coding:uft-8 -*-
# 数据分析

import jieba
import pandas as pd
from pyecharts import options as opts
from pyecharts.charts import Bar, WordCloud, Pie, Line
from pyecharts.globals import ThemeType, SymbolType
import pymongo


def createWordCould(txt, name):
    print(name + '词云图绘制')
    words = jieba.cut(txt)
    wordDic = {}
    stops = []
    for word in words:
        if len(word) > 1 and word not in stops:
            wordDic[word] = wordDic.get(word, 0) + 1
    ls = list(wordDic.items())
    wordLs = ls[:500]
    chart = (
        WordCloud(
            init_opts=opts.InitOpts(theme=ThemeType.ESSOS, width='100%', height='780px')
        )
            .add('', wordLs, word_size_range=[20, 100], shape=SymbolType.ROUND_RECT)
            .set_global_opts(title_opts=opts.TitleOpts(title=f'{name}词云图'))
    )
    chart.render(f'./chart/{key}/{name.replace(key, "")}词云图.html')
    print(name + '词云图绘制完成')


def posiDraw(posiLs, name):
    print(f'{name}排行柱状图绘制')
    dic = {}
    for posi in posiLs:
        dic[posi] = dic.get(posi, 0) + 1
    items = list(dic.items())
    items.sort(key=lambda x: x[1], reverse=True)
    posiLs = [item[0] for item in items][:9]
    numLs = [item[1] for item in items][:9]
    chart = (
        Bar(
            init_opts=opts.InitOpts(theme=ThemeType.PURPLE_PASSION, width='100%', height='780px')
        )
            .add_xaxis(posiLs)
            .add_yaxis('数量', numLs)
            .set_colors(['#e098c6'])
            .set_global_opts(title_opts=opts.TitleOpts(title=f'{name}排行柱状图'))
    )
    chart.render(f'./chart/{key}/{name.replace(key, "")}排行柱状图.html')
    print(f'{name}排行柱状图绘制完成')


def pieDraw(labelLs, countLs, name):
    print(f'{name}分布饼状图绘制')
    chart = (
        Pie(
            init_opts=opts.InitOpts(theme=ThemeType.DARK, width='100%', height='780px')
        )
            .add('', [list(z) for z in zip(labelLs, countLs)])
            .set_global_opts(title_opts=opts.TitleOpts(title=f'{name}分布饼状图'))
            .set_series_opts(label_opts=opts.LabelOpts(formatter='{b}: {c}'))
    )
    chart.render(f'./chart/{key}/{name.replace(key, "")}分布饼状图.html')
    print(f'{name}分布饼状图绘制完成')


def lineDraw(cityLs, salaLs, name):
    print(name + '主要城市平均薪资折线图')
    chart = (
        Line(
            init_opts=opts.InitOpts(theme=ThemeType.SHINE, width='100%', height='780px')
        )
            .add_xaxis(cityLs)
            .add_yaxis('平均薪资', salaLs)
            .set_global_opts(title_opts=opts.TitleOpts(title=f'{name}主要城市平均薪资折线图'))
            .set_series_opts(label_opts=opts.LabelOpts(is_show=True))
    )
    chart.render(f'./chart/{key}/{name.replace(key, "")}主要城市平均薪资折线图.html')
    print(name + '主要城市平均薪资折线图绘制完成')


def posiPlusDraw(posiLs, numLs, name):
    print(f'{name}对比柱状图绘制')
    chart = (
        Bar(
            init_opts=opts.InitOpts(theme=ThemeType.WESTEROS, width='100%', height='780px')
        )
            .add_xaxis(posiLs)
            .add_yaxis('最低薪资', numLs[0])
            .add_yaxis('平均薪资', numLs[1])
            .add_yaxis('最高薪资', numLs[2])
            .set_global_opts(title_opts=opts.TitleOpts(title=f'{name}排行柱状图'))
    )
    chart.render(f'./chart/{key}/{name.replace(key, "")}对比柱状图.html')
    print(f'{name}对比柱状图绘制完成')


def main():
    global key
    query = {'key': key}
    resLs = collection.find(query)
    df = pd.DataFrame(list(resLs))
    titleLs = df['标题'].tolist()
    titles = '/'.join(titleLs)
    createWordCould(titles, f'前程无忧{key}标题')
    df['地区'] = df['地区'].apply(lambda x: x.split('·')[0])
    posiLs = df['地区'].tolist()
    posiDraw(posiLs, f'前程无忧{key}城市职位数量')
    experLs = df['经验'].tolist()
    experDic = {}
    for exper in experLs:
        experDic[exper] = experDic.get(exper, 0) + 1
    experItem = list(experDic.items())
    experItem.sort(key=lambda x: x[1], reverse=True)
    pieDraw([i[0] for i in experItem], [i[1] for i in experItem], f'前程无忧{key}职位经验要求')
    eduLs = df['学历'].tolist()
    eduDic = {}
    for edu in eduLs:
        eduDic[edu] = eduDic.get(edu, 0) + 1
    eduItem = list(eduDic.items())
    eduItem.sort(key=lambda x: x[1], reverse=True)
    pieDraw([i[0] for i in eduItem], [i[1] for i in eduItem], f'前程无忧{key}职位学历要求')
    dic = {}
    for posi in posiLs:
        dic[posi] = dic.get(posi, 0) + 1
    items = list(dic.items())
    items.sort(key=lambda x: x[1], reverse=True)
    cityLs = [item[0] for item in items][:20]
    salaLs = []
    for city in cityLs:
        dfSelect = df[(df['key'] == key) & (df['地区'] == city)]
        salaLs.append(int(dfSelect['薪资'].mean()))
    dic = {}
    for i in range(len(cityLs)):
        dic[cityLs[i]] = salaLs[i]
    items = list(dic.items())
    items.sort(key=lambda x: x[1], reverse=True)
    cityLs = [item[0] for item in items][:8]
    salaLs = [item[1] for item in items][:8]
    lineDraw(cityLs, salaLs, f'前程无忧{key}职位')
    dic = {}
    numLs = [[], [], []]
    for posi in posiLs:
        dic[posi] = dic.get(posi, 0) + 1
    items = list(dic.items())
    items.sort(key=lambda x: x[1], reverse=True)
    posiLs = [item[0] for item in items][:9]
    for city in posiLs:
        dfSelect = df[(df['key'] == key) & (df['地区'] == city)]
        numLs[0].append(int(dfSelect['薪资'].min()))
        numLs[1].append(int(dfSelect['薪资'].mean()))
        numLs[2].append(int(dfSelect['薪资'].max()))
        posiPlusDraw(posiLs, numLs, f'前程无忧{key}职位城市薪资')


if __name__ == '__main__':
    client = pymongo.MongoClient('mongodb://root:abc_123456@localhost:27017')
    db = client.test
    collection = db.job
    for key in ['数据库工程师', '网络工程师', '算法工程师']:
        main()
总结
一开始还一直被反扒,直到在网上问一个前辈要了个反扒程序加进去才没事,拖得有点久了