import matplotlib.pyplot as plt
import numpy as np
N = 8
i = 0
# 指定一个画板
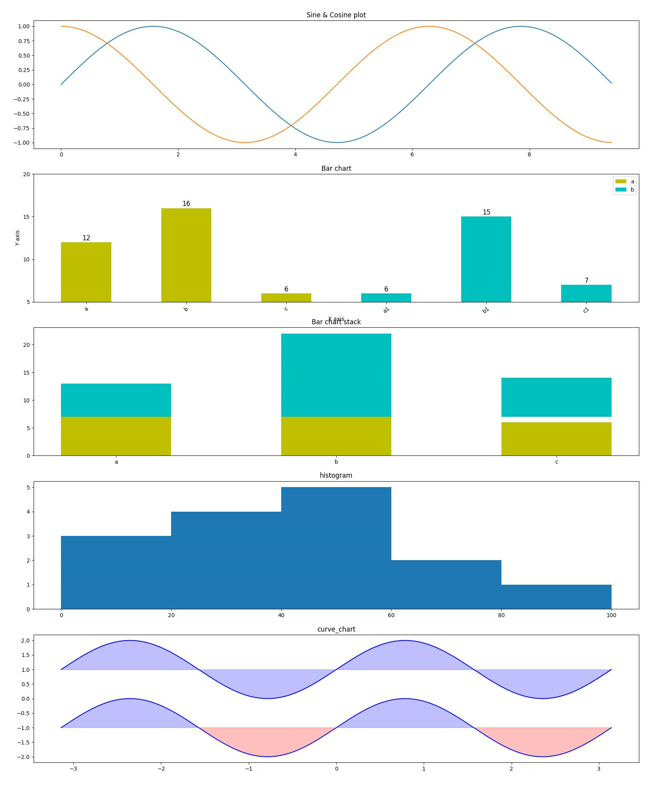
fig = plt.figure(figsize=(20, 5 * N))
x = np.arange(0, 3 * np.pi, 0.1)
y_sin = np.sin(x)
y_cos = np.cos(x)
i += 1
plt.subplot(N, 1, i)
plt.plot(x, y_sin)
plt.plot(x, y_cos)
plt.title("Sine & Cosine plot")
cat1 = ["a", "b", "c"]
cat2 = ["a1", "b1", "c1"]
val1 = [12, 16, 6]
val2 = [6, 15, 7]
i += 1
plt.subplot(N, 1, i)
plt.bar(x=cat1, height=val1, width=0.5, color="y")
plt.bar(x=cat2, height=val2, width=0.5, color="c")
plt.title("Bar chart") # 图形标题
plt.xlabel("X axis") # x轴名称
plt.ylabel("Y axis") # y轴名称
plt.ylim((5, 20)) # y轴范围
plt.xticks(rotation=40) # x轴刻度
plt.yticks([5, 10, 15, 20]) # y轴刻度
plt.legend(["a", "b"]) # 图例
for x, y in zip(cat1, val1):
plt.text(x, y + 0.05, "%.0f" % y, ha="center", va="bottom", fontsize=12)
for x, y in zip(cat2, val2):
plt.text(x, y + 0.05, "%.0f" % y, ha="center", va="bottom", fontsize=12)
i += 1
plt.subplot(N, 1, i)
plt.bar(x=cat1, height=val1, width=0.5, color="y", align="center")
plt.bar(x=cat1, height=val2, width=0.5, bottom=y, color="c", align="center")
plt.title("Bar chart stack")
arr = np.array([22, 87, 5, 43, 56, 73, 55, 54, 11, 20, 51, 5, 79, 31, 27])
i += 1
plt.subplot(N, 1, i)
plt.hist(arr, bins=[0, 20, 40, 60, 80, 100])
plt.title("histogram")
n = 256
x = np.linspace(-np.pi, np.pi, n, endpoint=True)
y = np.sin(2 * x)
i += 1
plt.subplot(N, 1, i)
plt.plot(x, y + 1, color="blue", alpha=1.00)
plt.fill_between(x, 1, y + 1, color="blue", alpha=0.25)
plt.plot(x, y - 1, color="blue", alpha=1.00)
plt.fill_between(x, -1, y - 1, (y - 1) > -1, color="blue", alpha=0.25)
plt.fill_between(x, -1, y - 1, (y - 1) < -1, color="red", alpha=0.25)
plt.title("curve_chart")
# 绘制图形
# plt.show()
plt.savefig("../../files/gen/plt.jpg")