1、前言
最初我写过一篇相同的文章发表到了CSDN中,因为写的比较早,2019年吧,8万多访问量,所以后来也有很多网友反馈各种问题,包括网站反爬、数据爬取失败、网络异常等等,所以那篇文章也经过了多次的修改。
不过目前因为CSDN规则更改,爬虫类文章因违反社区规定被下架了,然后我也很久没有去管了。最近重新测试我那代码时,发现前程无忧网也是改动比较大,所以这次我重新进行了代码开发与文章梳理。

2、数据爬取
首先进入前程无忧官网,然后搜索想要看的职位
我这里以搜索大数据职位为例,后续也会修改成用户可以自己手动输入的方式

2.1、网址获取
在使用爬虫之前需要明确url信息,从上图中可以很容易得到是:https://we.51job.com/pc/search?keyword=%E5%A4%A7%E6%95%B0%E6%8D%AE&searchType=2&sortType=0&metro=
简写成:https://we.51job.com/pc/search?keyword=%E5%A4%A7%E6%95%B0%E6%8D%AE同样生效
但是是不是用这个url来进行爬取呢?我们还需要考虑翻页的情况,很容易发现,当我们不管怎么翻页时,url的地址都不会改变,这是因为网站使用了Ajax技术的缘故。

所以这个url是不可靠的,我们需要通过网页检查进行获取
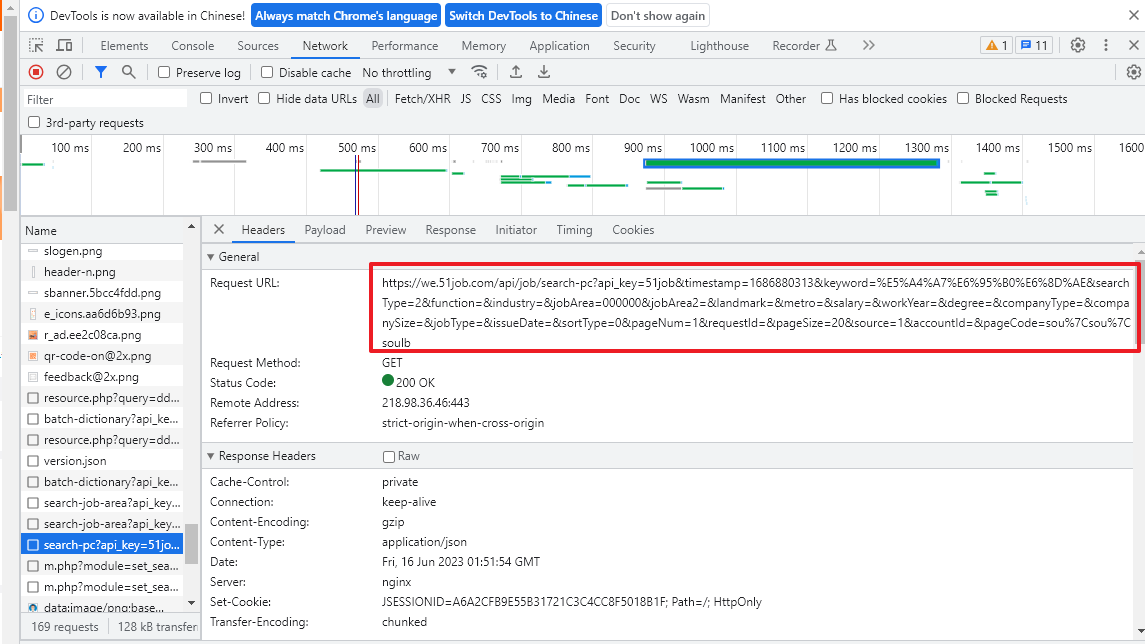
具体可以参考文章:Python爬虫-Ajax网页爬取过程
从上图可以得到url:https://we.51job.com/api/job/search-pc?api_key=51job×tamp=1686812803&keyword=%E5%A4%A7%E6%95%B0%E6%8D%AE&searchType=2&function=&industry=&jobArea=000000&jobArea2=&landmark=&metro=&salary=&workYear=°ree=&companyType=&companySize=&jobType=&issueDate=&sortType=0&pageNum=1&requestId=&pageSize=20&source=1&accountId=&pageCode=sou%7Csou%7Csoulb
其中发现职位信息:&keyword=%E5%A4%A7%E6%95%B0%E6%8D%AE,修改这个参数可以爬取不同的职位
页码信息:&pageNum=1,修改此参数可以实现翻页
职位显示数量信息:&pageSize=20,可以使得每一页内容更多
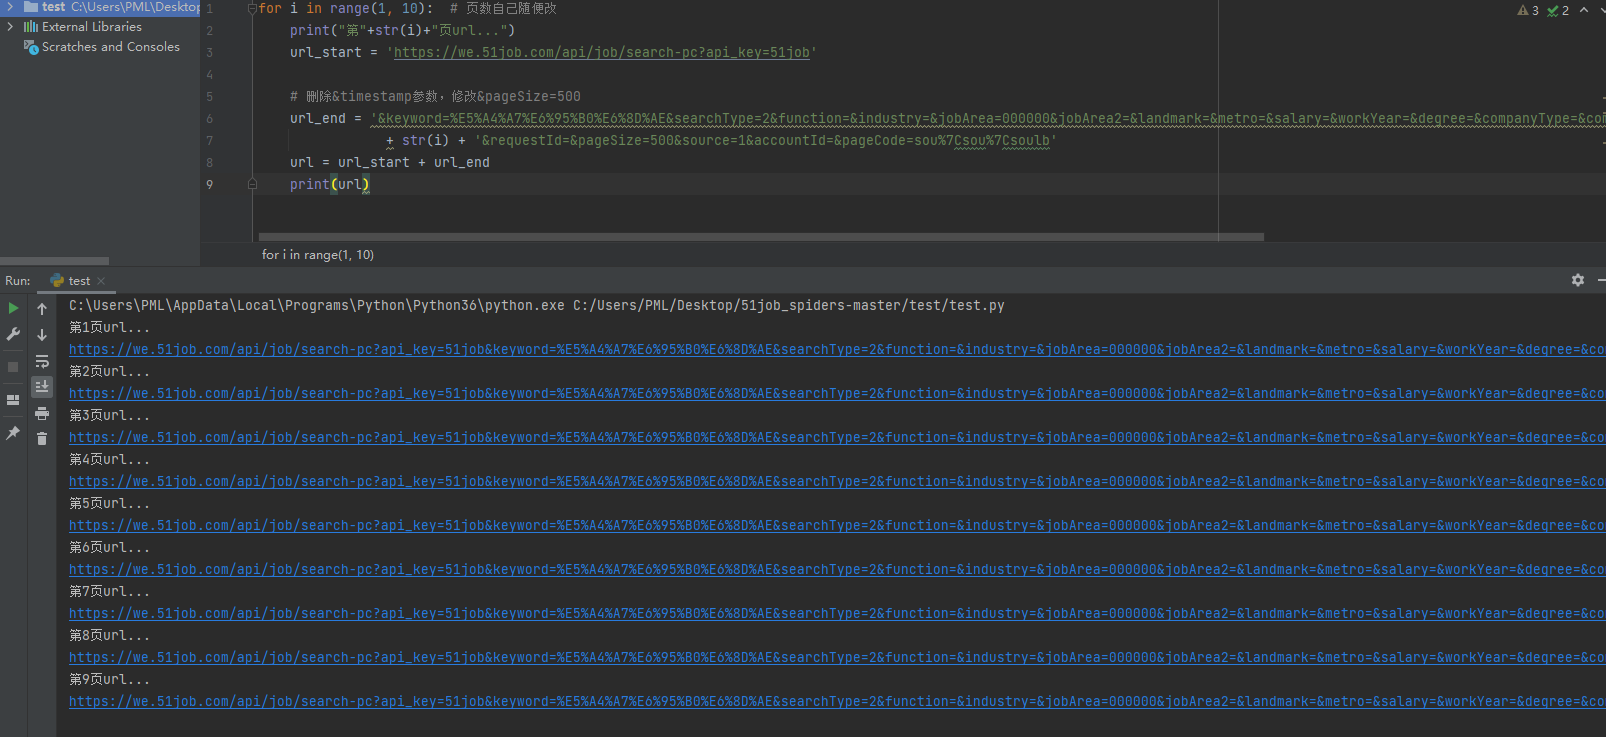
我们可以通过下面的代码遍历多页url
for i in range(1, 10): # 页数自己随便改
print("第"+str(i)+"页url...")
url_start = 'https://we.51job.com/api/job/search-pc?api_key=51job'
# 删除×tamp参数,修改&pageSize=500
url_end = '&keyword=%E5%A4%A7%E6%95%B0%E6%8D%AE&searchType=2&function=&industry=&jobArea=000000&jobArea2=&landmark=&metro=&salary=&workYear=°ree=&companyType=&companySize=&jobType=&issueDate=&sortType=0&pageNum=' \
+ str(i) + '&requestId=&pageSize=500&source=1&accountId=&pageCode=sou%7Csou%7Csoulb'
url = url_start + url_end
print(url)
2.2、自定义搜索的职位信息
用户自定义要搜索的职位很简单实现
首先完整的网址如下:https://we.51job.com/api/job/search-pc?api_key=51job&keyword=%E5%A4%A7%E6%95%B0%E6%8D%AE&searchType=2&function=&industry=&jobArea=000000&jobArea2=&landmark=&metro=&salary=&workYear=°ree=&companyType=&companySize=&jobType=&issueDate=&sortType=0&pageNum=1&requestId=&pageSize=500&source=1&accountId=&pageCode=sou%7Csou%7Csoulb
我们需要使用程序修改keyword的值即可,代码如下
import urllib.parse
job_type = input("请输入你想要搜索的职位:")
for i in range(1, 10): # 页数自己随便改
print("第"+str(i)+"页url...")
result = urllib.parse.quote(job_type)
url_start = 'https://we.51job.com/api/job/search-pc?api_key=51job&keyword=' + result
# 删除×tamp参数,修改&pageSize=500
url_end = '&searchType=2&function=&industry=&jobArea=000000&jobArea2=&landmark=&metro=&salary=&workYear=°ree=&companyType=&companySize=&jobType=&issueDate=&sortType=0&pageNum=' \
+ str(i) + '&requestId=&pageSize=500&source=1&accountId=&pageCode=sou%7Csou%7Csoulb'
url = url_start + url_end
print(url)
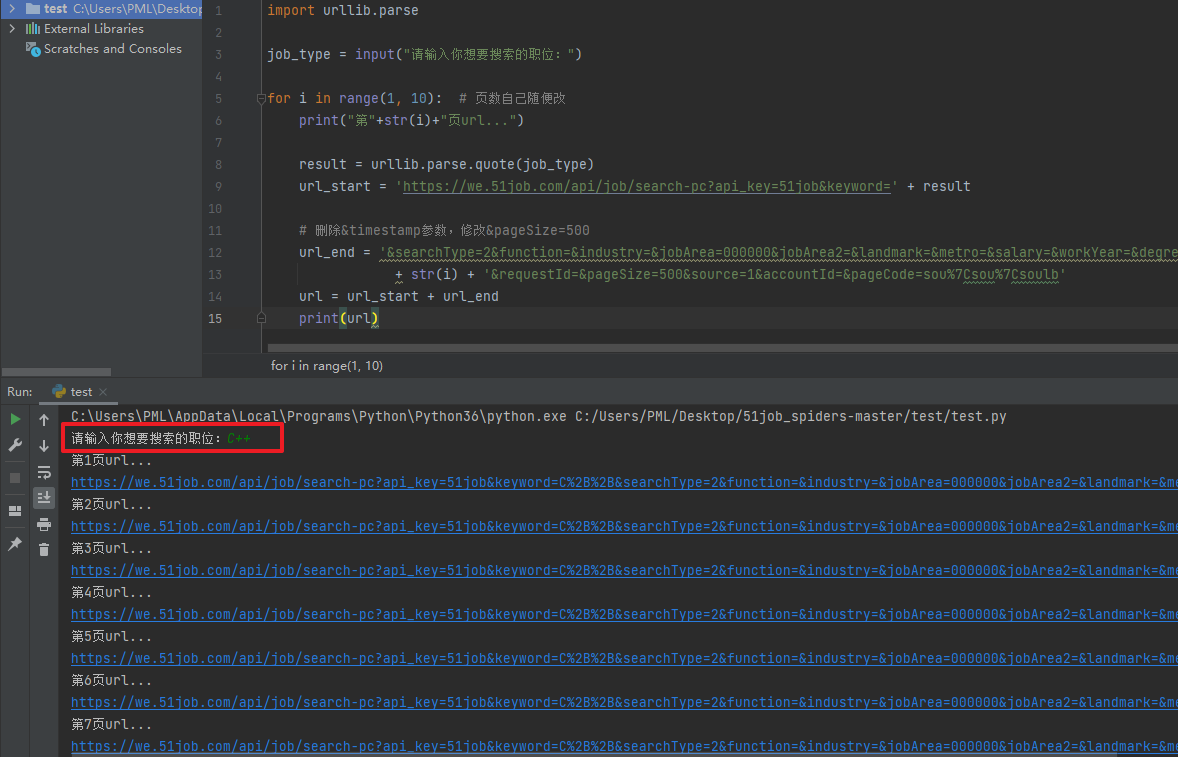
手动打开后的确是C++相关的职位招聘信息
2.3、解决滑动验证
当我们手动打开该网页后发现有滑动方式的访问验证

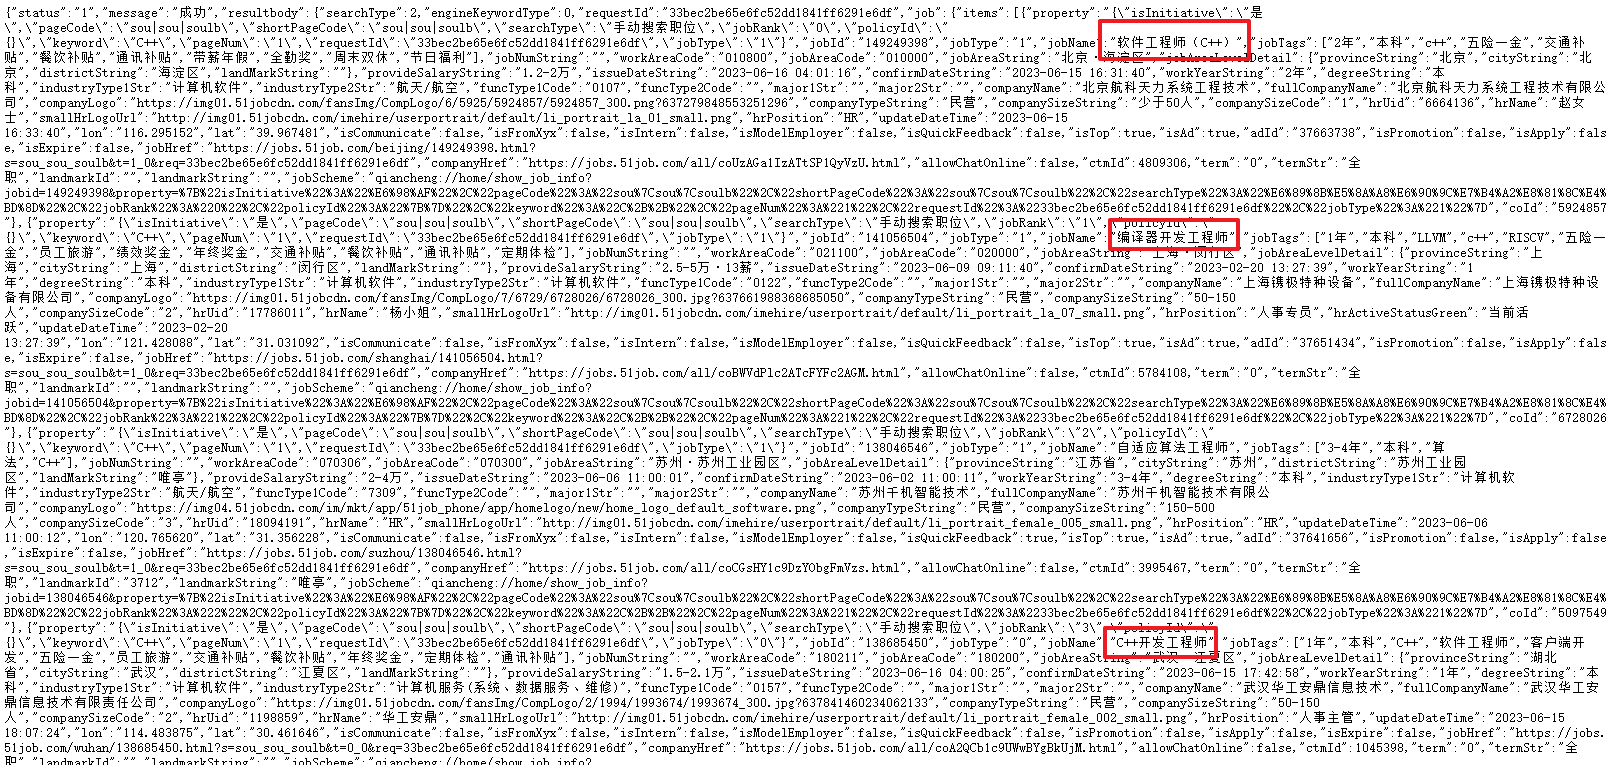
手动进行验证后,发现网页上的确能获取到职位的所有信息,而且还是JSON格式的,这同时也说明这个url是对的
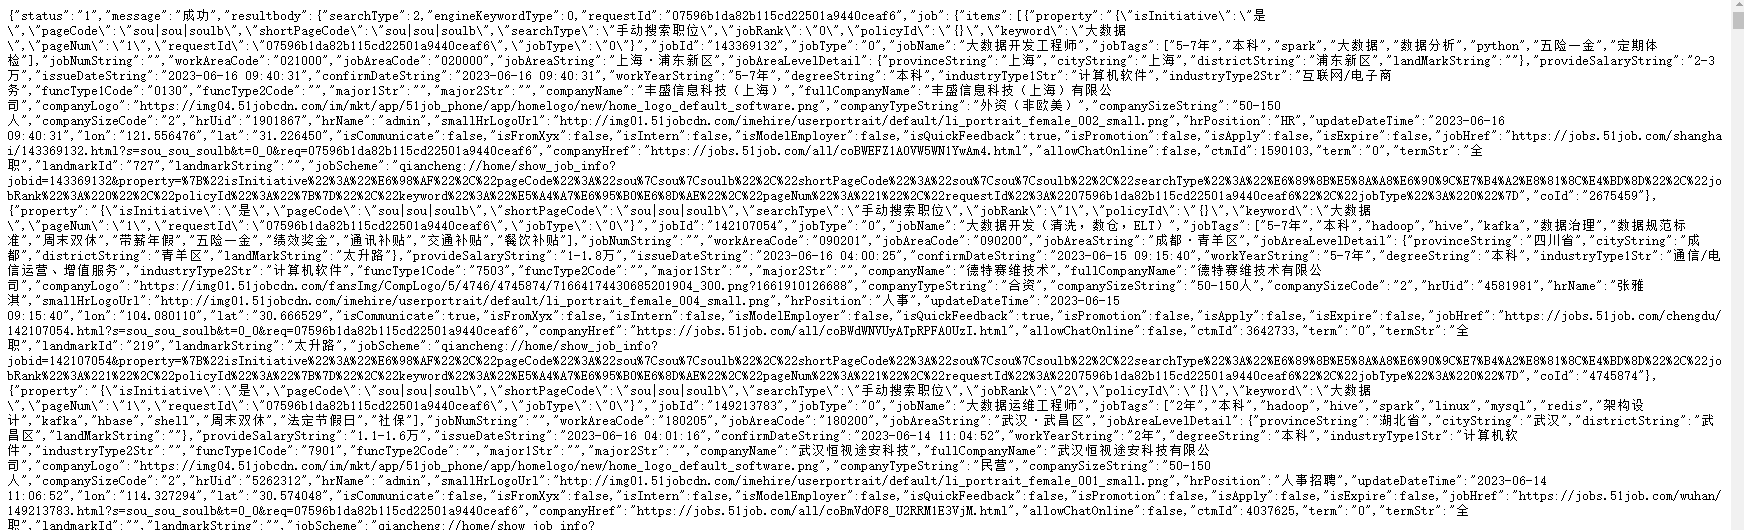
所有我们接下来要让程序去自动化的解决验证,这个时候就需要用到Selenium库,我们以爬取一页内容为例:
from selenium import webdriver
from selenium.webdriver import ActionChains
import time
def get_html():
url = 'https://we.51job.com/api/job/search-pc?api_key=51job&keyword=%E5%A4%A7%E6%95%B0%E6%8D%AE&searchType=2&function=&industry=' \
'&jobArea=000000&jobArea2=&landmark=&metro=&salary=&workYear=°ree=&companyType=&companySize=&jobType=&issueDate=' \
'&sortType=0&pageNum=1&requestId=&pageSize=500&source=1&accountId=&pageCode=sou%7Csou%7Csoulb'
options = webdriver.ChromeOptions()
# selenium静默执行(无浏览器界面)
options.add_argument('headless')
options.add_experimental_option('useAutomationExtension', False)
options.add_experimental_option('excludeSwitches', ['enable-automation'])
options.add_argument("--disable-blink-features=AutomationControlled")
chrome_driver = './chromedriver.exe'
driver = webdriver.Chrome(chrome_options=options,executable_path=chrome_driver)
# webdriver防屏蔽
driver.execute_cdp_cmd("Page.addScriptToEvaluateOnNewDocument", {
"source": """
Object.defineProperty(navigator, 'webdriver', {
get: () => false
})
"""
})
driver.get(url)
time.sleep(1)
# 找到需要滑动的滑块元素
slider = driver.find_element_by_xpath('//div[@class="nc_bg"]')
# 创建操作链
action_chains = ActionChains(driver)
# 将鼠标移动到滑块上
action_chains.move_to_element(slider)
# 模拟按下鼠标左键并保持不松开
action_chains.click_and_hold()
# 移动鼠标使滑块达到目标位置
action_chains.move_by_offset(300, 0)
# 松开鼠标左键
action_chains.release()
# 执行操作链
action_chains.perform()
time.sleep(10)
html = driver.page_source
driver.quit()
print(html)
def main():
get_html()
if __name__ == '__main__':
main()
print()函数打印出来的可能不全。
具体可以参考文章:Python爬虫-Selenium库解决滑动验证与webdriver被发现的问题
2.4、解析数据
我们虽然获取到了网页的html源码,但是还是需要进一步的提取出我们需要的信息
开发调试阶段我们可以将获取到的网页html源码先储存到一个临时文件中,后面的提取操作可以直接对该文件进行解析,这样就不用每次都要模拟上网行为去网页获取了,等调试稳定了再修改。
from selenium import webdriver
from selenium.webdriver import ActionChains
import time
def get_html():
url = 'https://we.51job.com/api/job/search-pc?api_key=51job&keyword=%E5%A4%A7%E6%95%B0%E6%8D%AE&searchType=2&function=&industry=' \
'&jobArea=000000&jobArea2=&landmark=&metro=&salary=&workYear=°ree=&companyType=&companySize=&jobType=&issueDate=' \
'&sortType=0&pageNum=1&requestId=&pageSize=500&source=1&accountId=&pageCode=sou%7Csou%7Csoulb'
options = webdriver.ChromeOptions()
# selenium静默执行(无浏览器界面)
options.add_argument('headless')
options.add_experimental_option('useAutomationExtension', False)
options.add_experimental_option('excludeSwitches', ['enable-automation'])
options.add_argument("--disable-blink-features=AutomationControlled")
chrome_driver = './chromedriver.exe'
driver = webdriver.Chrome(chrome_options=options,executable_path=chrome_driver)
# webdriver防屏蔽
driver.execute_cdp_cmd("Page.addScriptToEvaluateOnNewDocument", {
"source": """
Object.defineProperty(navigator, 'webdriver', {
get: () => false
})
"""
})
driver.get(url)
time.sleep(1)
# 找到需要滑动的滑块元素
slider = driver.find_element_by_xpath('//div[@class="nc_bg"]')
# 创建操作链
action_chains = ActionChains(driver)
# 将鼠标移动到滑块上
action_chains.move_to_element(slider)
# 模拟按下鼠标左键并保持不松开
action_chains.click_and_hold()
# 移动鼠标使滑块达到目标位置
action_chains.move_by_offset(300, 0)
# 松开鼠标左键
action_chains.release()
# 执行操作链
action_chains.perform()
time.sleep(10)
html = driver.page_source
driver.quit()
#print(html)
with open(r"./tmp.txt", "a+", encoding="utf-8") as files:
files.write(html) # 写入文件中的内容
def main():
get_html()
if __name__ == '__main__':
main()
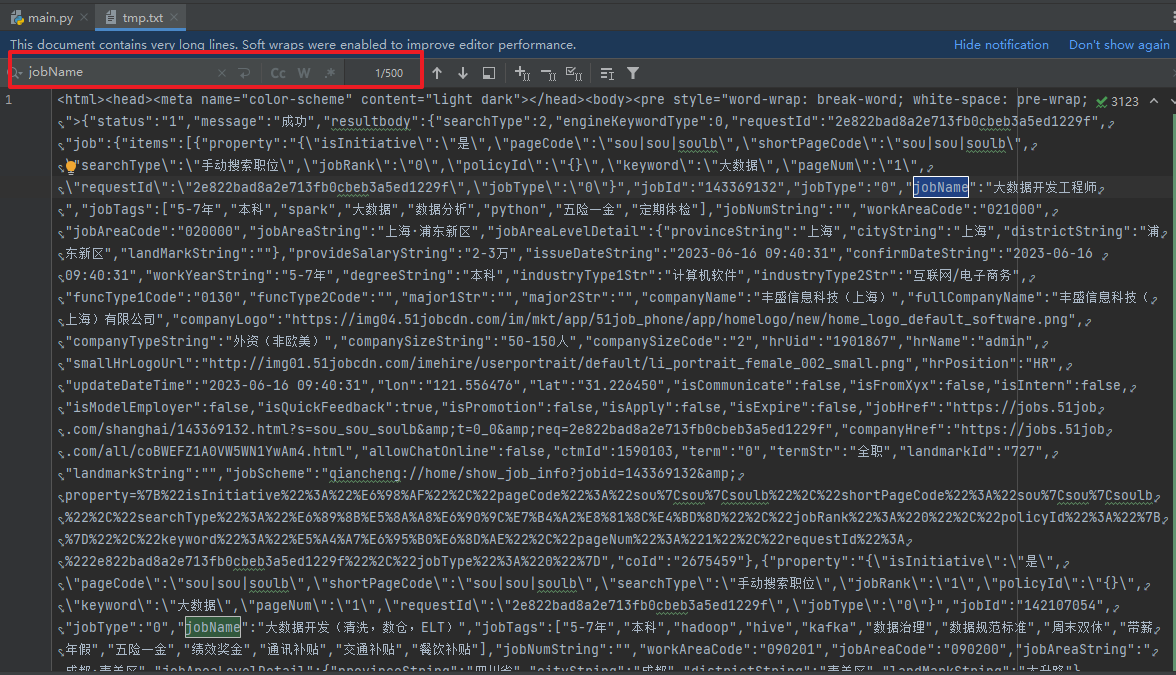
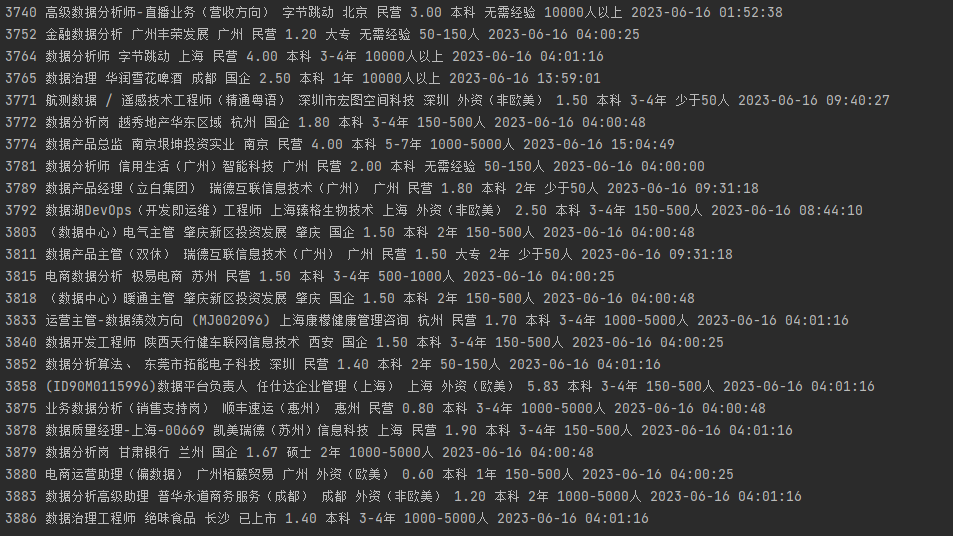
后面直接对这个tmp.txt进行解析,可以发现每一个property开头的就是一组数据,所有的职位都是在key为items的json数据中。
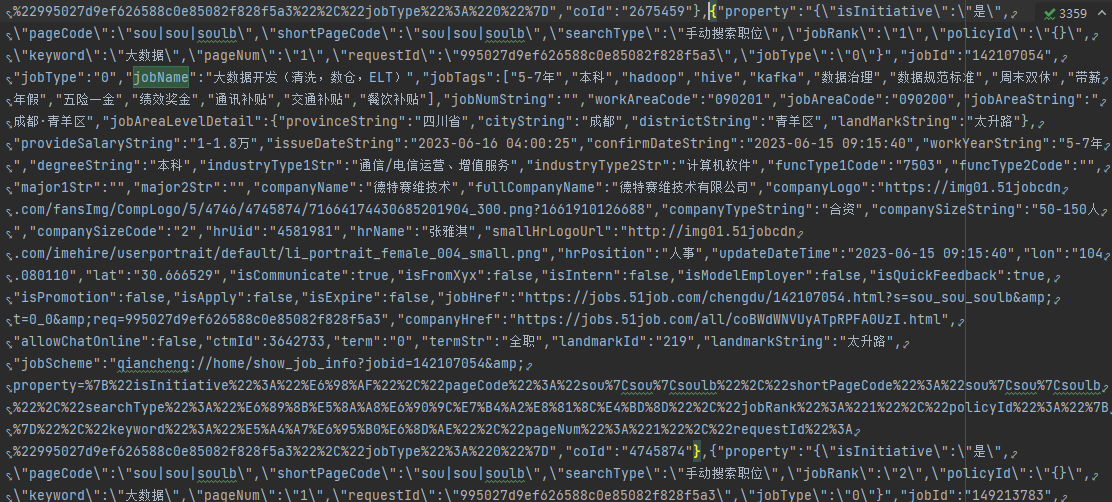
可以使用re库的正则将我们需要的数据提取出来
import re
def get_msg():
file_name = './tmp.txt'
file = open(file_name, "r", encoding="utf-8")
msg = file.read()
msg = msg.replace('\\', '') # 将用于转义的"\"替换为空
# print(msg)
# 匹配规则如下,里面匹配项一定不能写错,不然运行结果就会是空
# `(.*?)`表示任意我们想要的内容
# `.*?`表示任意其他字符串
reg = re.compile(r'"jobName":"(.*?)".*?"cityString":"(.*?)".*?"provideSalaryString":"(.*?)","issueDateString":"(.*?)".*?'
r'"workYearString":"(.*?)","degreeString":"(.*?)".*?"companyName":"(.*?)".*?"companyTypeString":"(.*?)","companySizeString":"(.*?)"',re.S)
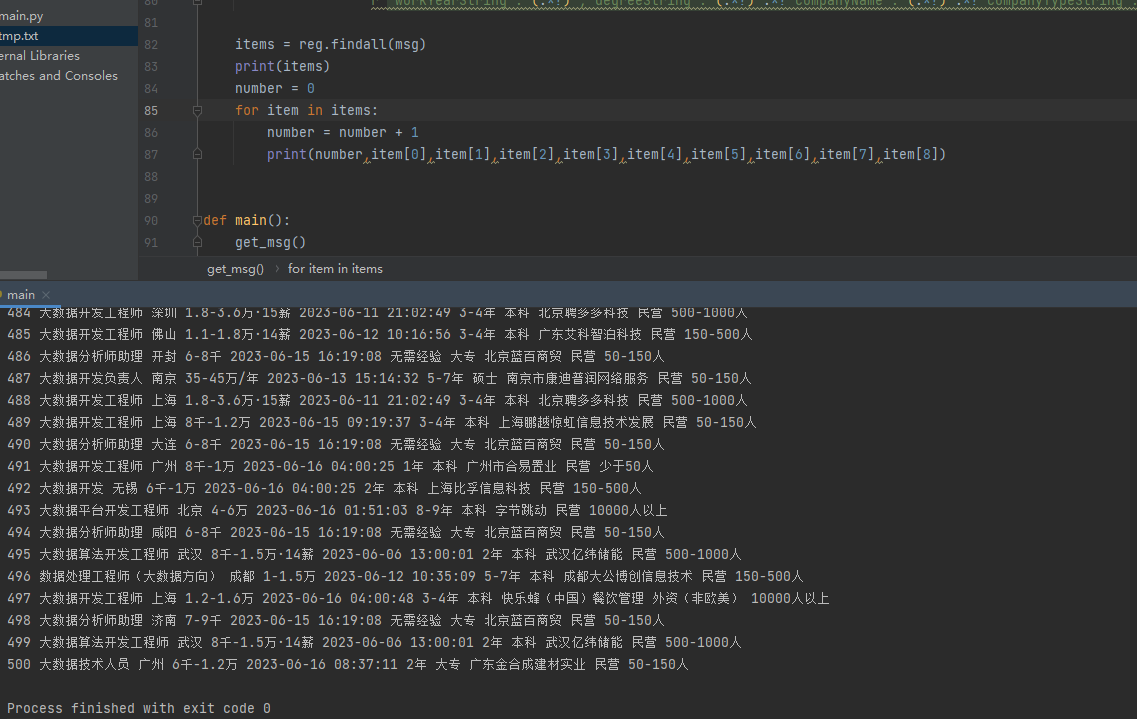
items = reg.findall(msg)
print(items)
number = 0
for item in items:
number = number + 1
print(number,item[0],item[1],item[2],item[3],item[4],item[5],item[6],item[7],item[8])
def main():
get_msg()
if __name__ == '__main__':
main()
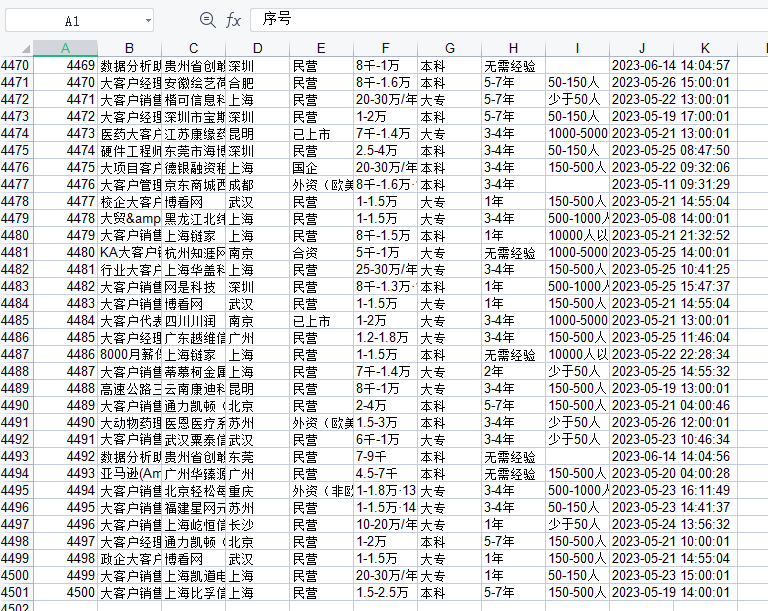
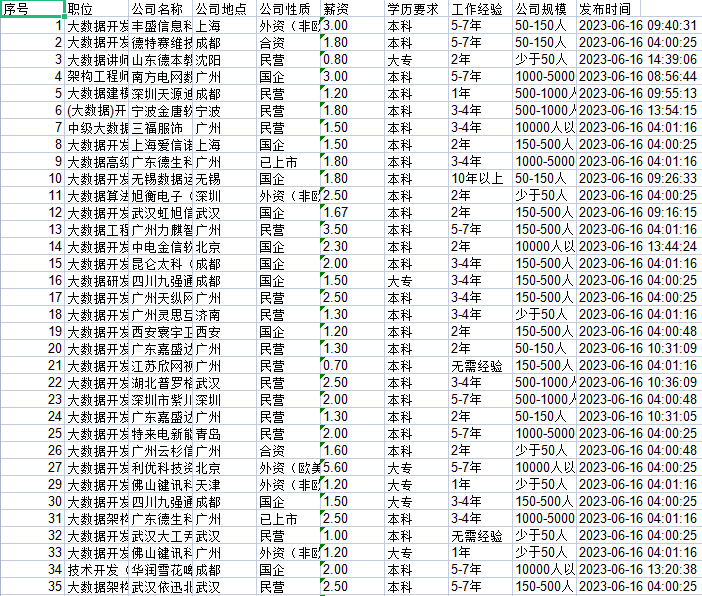
2.5、数据储存到xls
上面我们使用临时文件储存了所有的信息,并且使用程序提取出来了我们需要的数据,下面就让我们把这些数据储存到xls文件中
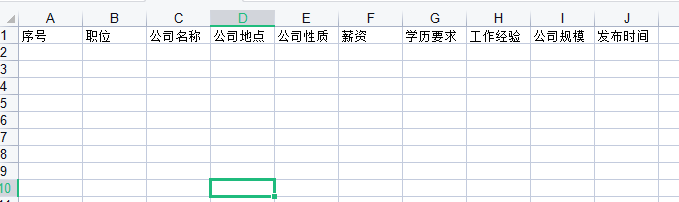
首先我们需要创建xls文件,并且设置好表格的参数,参考代码如下:
import xlwt

def creat_xls():
    # 新建表格空间
    excel1 = xlwt.Workbook()
    # 设置单元格格式
    sheet1 = excel1.add_sheet('Job', cell_overwrite_ok=True)
    sheet1.write(0, 0, '序号')
    sheet1.write(0, 1, '职位')
    sheet1.write(0, 2, '公司名称')
    sheet1.write(0, 3, '公司地点')
    sheet1.write(0, 4, '公司性质')
    sheet1.write(0, 5, '薪资')
    sheet1.write(0, 6, '学历要求')
    sheet1.write(0, 7, '工作经验')
    sheet1.write(0, 8, '公司规模')
    sheet1.write(0, 9, '发布时间')
    excel1.save("51job.xls")

def main():
    creat_xls()

if __name__ == '__main__':
    main()
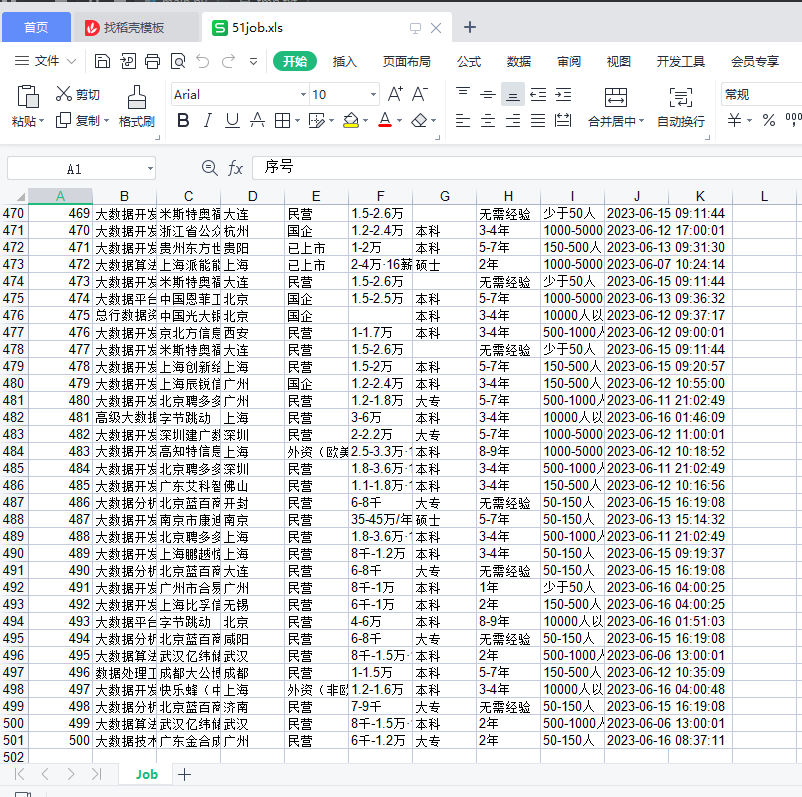
接下就将2.3、解析数据过程中的信息储存到表格中,改写后代码如下:
import re

import xlwt

def get_msg(excel1, sheet1):
    file_name = './tmp.txt'
    file = open(file_name, "r", encoding="utf-8")
    msg = file.read()
    msg = msg.replace('\\', '')  # 将用于转义的"\"替换为空

    # print(msg)

    # 匹配规则如下,里面匹配项一定不能写错,不然运行结果就会是空
    # `(.*?)`表示任意我们想要的内容
    # `.*?`表示任意其他字符串

    reg = re.compile(r'"jobName":"(.*?)".*?"cityString":"(.*?)".*?"provideSalaryString":"(.*?)","issueDateString":"(.*?)".*?'
                     r'"workYearString":"(.*?)","degreeString":"(.*?)".*?"companyName":"(.*?)".*?"companyTypeString":"(.*?)","companySizeString":"(.*?)"',re.S)

    items = reg.findall(msg)

    number = 0
    for item in items:
        number = number + 1
        print(number,item[0],item[1],item[2],item[3],item[4],item[5],item[6],item[7],item[8])

        sheet1.write(number, 0, number)
        sheet1.write(number, 1, item[0])
        sheet1.write(number, 2, item[6])
        sheet1.write(number, 3, item[1])
        sheet1.write(number, 4, item[7])
        sheet1.write(number, 5, item[2])
        sheet1.write(number, 6, item[5])
        sheet1.write(number, 7, item[4])
        sheet1.write(number, 8, item[8])
        sheet1.write(number, 9, item[3])

        # 表格文件保存是可以选择两种情况,
        # 一种在for循环里面,每写一行保存一次,这样可以放在程序中途出现异常后,文件内容啥也没有
        # 另一种是在for循环之外,所有内容写完再保存
        excel1.save("51job.xls")

def creat_xls(excel1):
    # 设置单元格格式
    sheet1 = excel1.add_sheet('Job', cell_overwrite_ok=True)
    sheet1.write(0, 0, '序号')
    sheet1.write(0, 1, '职位')
    sheet1.write(0, 2, '公司名称')
    sheet1.write(0, 3, '公司地点')
    sheet1.write(0, 4, '公司性质')
    sheet1.write(0, 5, '薪资')
    sheet1.write(0, 6, '学历要求')
    sheet1.write(0, 7, '工作经验')
    sheet1.write(0, 8, '公司规模')
    sheet1.write(0, 9, '发布时间')
    return sheet1

def main():
    # 新建表格空间
    excel1 = xlwt.Workbook()
    sheet1 = creat_xls(excel1)
    get_msg(excel1, sheet1)

if __name__ == '__main__':
    main()
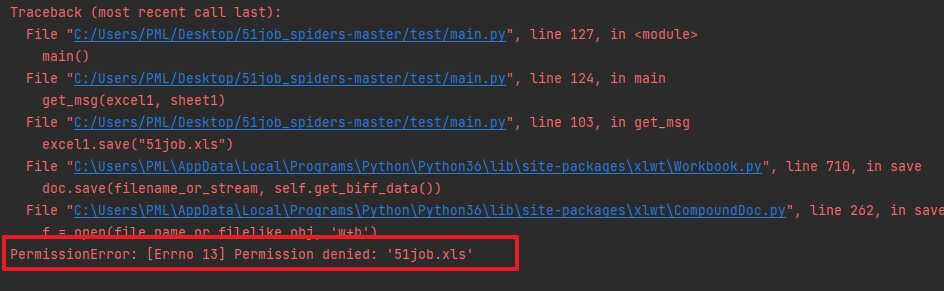
若出现下面的报错,可能是你在本地电脑上打开了这个xls文件,导致Python代码操作时异常
2.6、完整代码
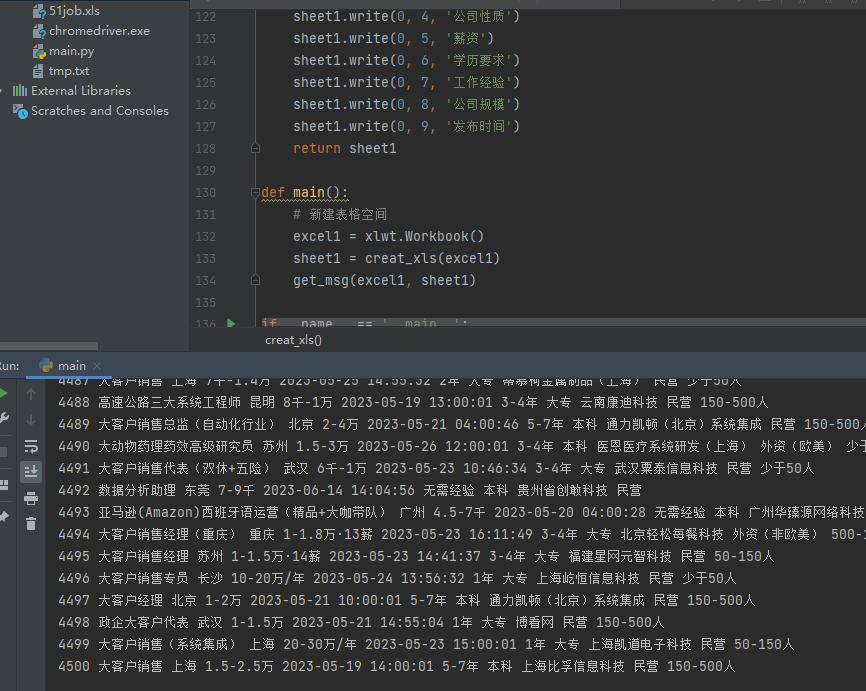
通过上面的调试,我们现在已经实现了将临时文件中储存的数据进行提取并储存到xls文件中,调试稳定后我们就可以不用临时文件了。
接下来我们就需要真正的将所有东西都联动起来,也就是让程序自动化完成如下过程:
用户输入要搜索的职位 --> 程序拼装URL地址 --> 利用Selenium库爬取网页 --> 进行数据提取
--> 储存到xls文件中
from selenium import webdriver
from selenium.webdriver import ActionChains
import time
import re
import xlwt
import urllib.parse
def get_html(url):
options = webdriver.ChromeOptions()
# selenium静默执行(无浏览器界面)
options.add_argument('headless')
options.add_experimental_option('useAutomationExtension', False)
options.add_experimental_option('excludeSwitches', ['enable-automation'])
options.add_argument("--disable-blink-features=AutomationControlled")
chrome_driver = './chromedriver.exe'
driver = webdriver.Chrome(chrome_options=options,executable_path=chrome_driver)
# webdriver防屏蔽
driver.execute_cdp_cmd("Page.addScriptToEvaluateOnNewDocument", {
"source": """
Object.defineProperty(navigator, 'webdriver', {
get: () => false
})
"""
})
driver.get(url)
time.sleep(1)
# 找到需要滑动的滑块元素
slider = driver.find_element_by_xpath('//div[@class="nc_bg"]')
# 创建操作链
action_chains = ActionChains(driver)
# 将鼠标移动到滑块上
action_chains.move_to_element(slider)
# 模拟按下鼠标左键并保持不松开
action_chains.click_and_hold()
# 移动鼠标使滑块达到目标位置
action_chains.move_by_offset(300, 0)
# 松开鼠标左键
action_chains.release()
# 执行操作链
action_chains.perform()
time.sleep(10)
html = driver.page_source
driver.quit()
return html
def get_msg(excel1, sheet1):
number = 0
job_type = input("请输入你想要搜索的职位:")
for i in range(1, 10): # 页数自己随便改
try:
print("正在爬取第" + str(i) + "页数据...")
result = urllib.parse.quote(job_type)
url_start = 'https://we.51job.com/api/job/search-pc?api_key=51job&keyword=' + result
# 删除×tamp参数,修改&pageSize=500
url_end = '&searchType=2&function=&industry=&jobArea=000000&jobArea2=&landmark=&metro=&salary=&workYear=°ree=&companyType=&companySize=&jobType=&issueDate=&sortType=0&pageNum=' \
+ str(i) + '&requestId=&pageSize=500&source=1&accountId=&pageCode=sou%7Csou%7Csoulb'
url = url_start + url_end
# print(url)
msg = get_html(url)
msg = msg.replace('\\', '') # 将用于转义的"\"替换为空
# print(msg)
# 匹配规则如下,里面匹配项一定不能写错,不然运行结果就会是空
# `(.*?)`表示任意我们想要的内容
# `.*?`表示任意其他字符串
reg = re.compile(r'"jobName":"(.*?)".*?"cityString":"(.*?)".*?"provideSalaryString":"(.*?)","issueDateString":"(.*?)".*?'
r'"workYearString":"(.*?)","degreeString":"(.*?)".*?"companyName":"(.*?)".*?"companyTypeString":"(.*?)","companySizeString":"(.*?)"',re.S)
items = reg.findall(msg)
for item in items:
number = number + 1
print(number,item[0],item[1],item[2],item[3],item[4],item[5],item[6],item[7],item[8])
sheet1.write(number, 0, number)
sheet1.write(number, 1, item[0])
sheet1.write(number, 2, item[6])
sheet1.write(number, 3, item[1])
sheet1.write(number, 4, item[7])
sheet1.write(number, 5, item[2])
sheet1.write(number, 6, item[5])
sheet1.write(number, 7, item[4])
sheet1.write(number, 8, item[8])
sheet1.write(number, 9, item[3])
# 表格文件保存是可以选择两种情况,
# 一种在for循环里面,每写一行保存一次,这样可以放在程序中途出现异常后,文件内容啥也没有
# 另一种是在for循环之外,所有内容写完再保存
excel1.save("51job.xls")
time.sleep(0.3) # 休息间隔
except:
pass
def creat_xls(excel1):
# 设置单元格格式
sheet1 = excel1.add_sheet('Job', cell_overwrite_ok=True)
sheet1.write(0, 0, '序号')
sheet1.write(0, 1, '职位')
sheet1.write(0, 2, '公司名称')
sheet1.write(0, 3, '公司地点')
sheet1.write(0, 4, '公司性质')
sheet1.write(0, 5, '薪资')
sheet1.write(0, 6, '学历要求')
sheet1.write(0, 7, '工作经验')
sheet1.write(0, 8, '公司规模')
sheet1.write(0, 9, '发布时间')
return sheet1
def main():
# 新建表格空间
excel1 = xlwt.Workbook()
sheet1 = creat_xls(excel1)
get_msg(excel1, sheet1)
if __name__ == '__main__':
main()
嫌程序运行太慢的话可以自己调整程序sleep的时间,另外就是为后续数据可视化做准备的话,其实爬取的数据是越多越好。可以设置成500页,这样爬取出来就有25万条数据,不过可能需要程序运行好几个小时,所以要保证良好的网络环境。
3、数据清洗与处理
目前采用之前爬虫获取的数据基本没有任何问题,不过难保有些意外情况
所有有如下的清洗思路可以进行参考:
3.1、有空值的数据整行删除
import pandas as pd
#除此之外还要安装xlrd包

pd.set_option('display.max_rows', None)  # 输出全部行,不省略
pd.set_option('display.max_columns', None)  # 输出全部列,不省略

data = pd.read_excel(r'51job.xls',sheet_name='Job')

result = pd.DataFrame(data)

# axis=0,表示对行进行操作
# how='any'”参数表示应该删除至少包含一个NaN值的任何行
# inplace=True参数确保修改原始DataFrame,而不是创建一个新DataFrame

result.dropna(axis=0,how='any',inplace=True)

print(result)
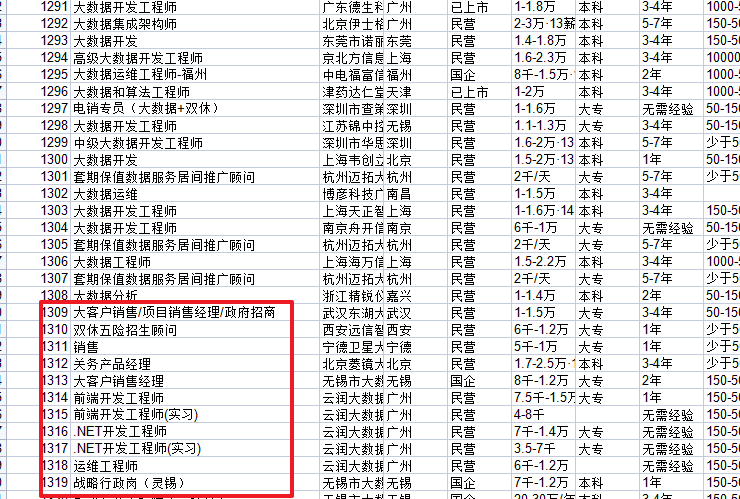
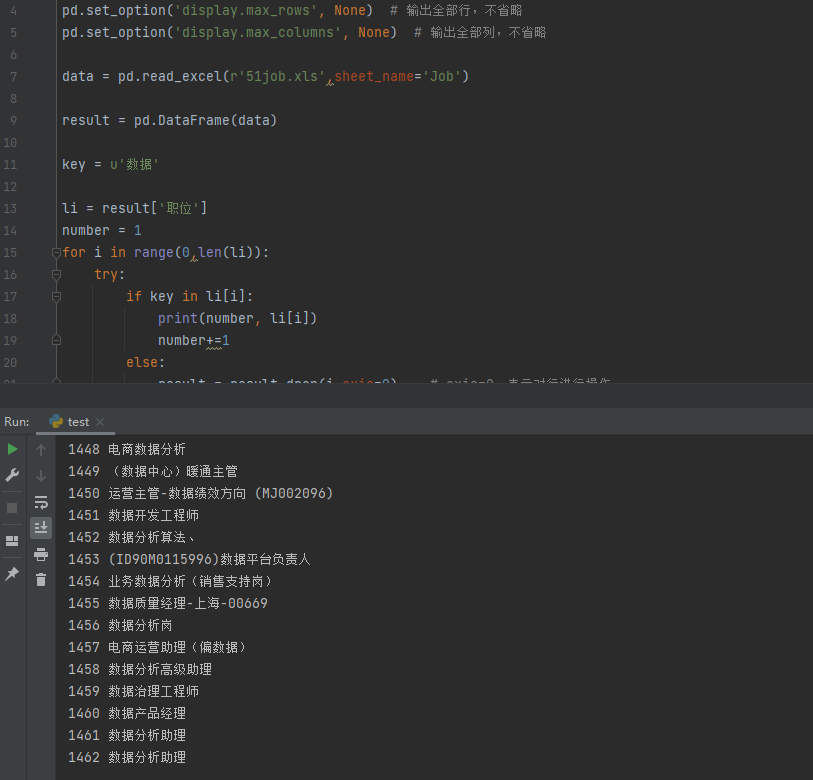
3.2、职位出错(删除与大数据无关的职业)
比如我们现在爬取的职位信息是大数据,但是里面出现了很多无关的内容,这些都是需要被清洗的
import pandas as pd
#除此之外还要安装xlrd包

pd.set_option('display.max_rows', None)  # 输出全部行,不省略
pd.set_option('display.max_columns', None)  # 输出全部列,不省略

data = pd.read_excel(r'51job.xls',sheet_name='Job')

result = pd.DataFrame(data)

key = u'数据'

li = result['职位']
number = 1
for i in range(0,len(li)):
    try:
        if key in li[i]:
            print(number, li[i])
            number+=1
        else:
            result = result.drop(i,axis=0)    # axis=0,表示对行进行操作
    except:
        pass
3.3、其他信息错位
这个需要简单的排查下,可以利用Excel软件的筛选功能
比如薪资里面出现学历数据
比如学历要求里面出现工作经验等等,这些都可以参考3.2、职位出错的代码进行数据清洗
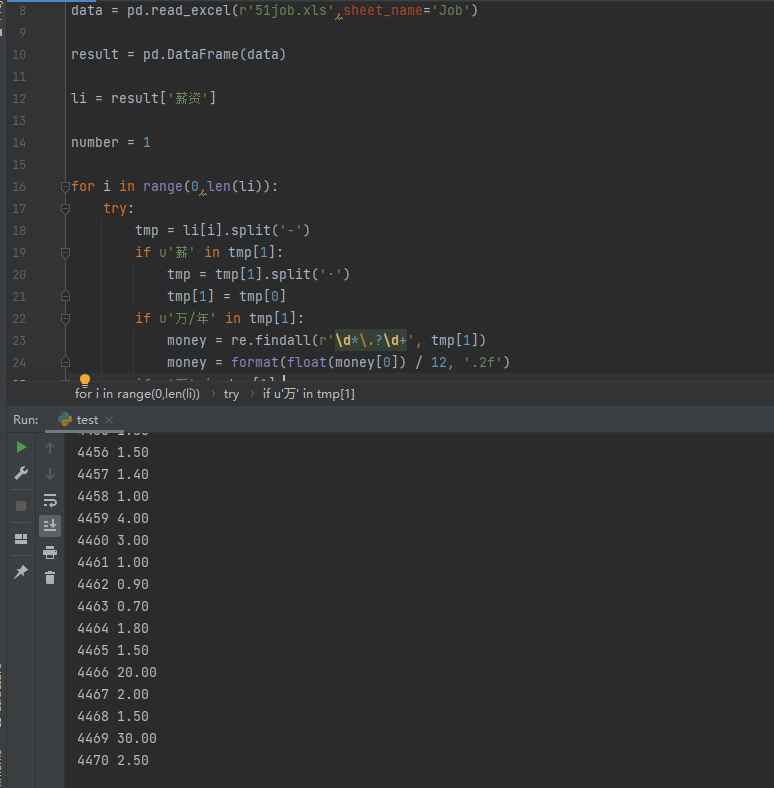
3.4、薪资单位转换
我们可以发现表格里面薪资这一列,有的写月薪、有的写年薪,而且单位有千有万,为了方便后面做数据展示,这里可以进行单位统一。
目前我的做法是保留最高的薪资,然后全部转换成月薪:
import pandas as pd
import re
#除此之外还要安装xlrd包

pd.set_option('display.max_rows', None)  # 输出全部行,不省略
pd.set_option('display.max_columns', None)  # 输出全部列,不省略

data = pd.read_excel(r'51job.xls',sheet_name='Job')

result = pd.DataFrame(data)

li = result['薪资']

number = 1

for i in range(0,len(li)):
    try:
        tmp = li[i].split('-')
        if u'薪' in tmp[1]:
            tmp = tmp[1].split('·')
            tmp[1] = tmp[0]
        if u'万' in tmp[1]:
            money = re.findall(r'\d*\.?\d+', tmp[1])
            money = format(float(money[0]), '.2f')
        if u'千' in tmp[1]:
            money = re.findall(r'\d*\.?\d+', tmp[1])
            money = format(float(money[0]) / 10, '.2f')
        if u'万/年' in tmp[1]:
            money = re.findall(r'\d*\.?\d+', tmp[1])
            money = format(float(money[0]) / 12, '.2f')

        print(number, money)
        number += 1
    except:
        pass
3.5、完整代码
前面我们已经知道了如何简单的进行数据清洗,现在可以将这些全部进行整合,然后储存到另一个文件中
import pandas as pd
import re

import xlwt
#除此之外还要安装xlrd包

def read_excel():
    #读取表格内容到data
    pd.set_option('display.max_rows', None)  # 输出全部行,不省略
    pd.set_option('display.max_columns', None)  # 输出全部列,不省略

    data = pd.read_excel(r'51job.xls', sheet_name='Job')

    result = pd.DataFrame(data)

    result.dropna(axis=0,how='any',inplace=True)

    return result


def main():
    # 新建表格空间
    excel1 = xlwt.Workbook()
    # 设置单元格格式
    sheet1 = excel1.add_sheet('Job', cell_overwrite_ok=True)
    sheet1.write(0, 0, '序号')
    sheet1.write(0, 1, '职位')
    sheet1.write(0, 2, '公司名称')
    sheet1.write(0, 3, '公司地点')
    sheet1.write(0, 4, '公司性质')
    sheet1.write(0, 5, '薪资')
    sheet1.write(0, 6, '学历要求')
    sheet1.write(0, 7, '工作经验')
    sheet1.write(0, 8, '公司规模')
    sheet1.write(0, 9, '发布时间')

    number = 1

    result = read_excel()

    for i in range(0, len(result)):
        try:
            id = result["序号"].values[i]
            job_name = result["职位"].values[i]
            companys = result["公司名称"].values[i]
            location = result["公司地点"].values[i]
            company_v = result["公司性质"].values[i]
            moneys = result["薪资"].values[i]
            edu = result["学历要求"].values[i]
            exp = result["工作经验"].values[i]
            size = result["公司规模"].values[i]
            date = result["发布时间"].values[i]

            if u'数据' not in job_name:
                continue

            tmp = moneys.split('-')
            if u'薪' in tmp[1]:
                tmp = tmp[1].split('·')
                tmp[1] = tmp[0]
            if u'万' in tmp[1]:
                moneys= re.findall(r'\d*\.?\d+', tmp[1])
                moneys = format(float(moneys[0]), '.2f')
            if u'千' in tmp[1]:
                moneys = re.findall(r'\d*\.?\d+', tmp[1])
                moneys = format(float(moneys[0]) / 10, '.2f')
            if u'万/年' in tmp[1]:
                moneys = re.findall(r'\d*\.?\d+', tmp[1])
                moneys = format(float(moneys[0]) / 12, '.2f')

            print(id, job_name, companys, location, company_v, moneys, edu, exp, size, date)
            sheet1.write(number, 0, int(id))
            sheet1.write(number, 1, job_name)
            sheet1.write(number, 2, companys)
            sheet1.write(number, 3, location)
            sheet1.write(number, 4, company_v)
            sheet1.write(number, 5, moneys)
            sheet1.write(number, 6, edu)
            sheet1.write(number, 7, exp)
            sheet1.write(number, 8, size)
            sheet1.write(number, 9, date)
            number += 1
        except:
            pass

    excel1.save("51job2.xls")


if __name__ == '__main__':
    main()
4、数据可视化
经过上面的操作,我们已经把清洗后的数据储存到了51job2.xls,经过检查,数据都是我们需要的,接下来就需要开始进行数据可视化了。
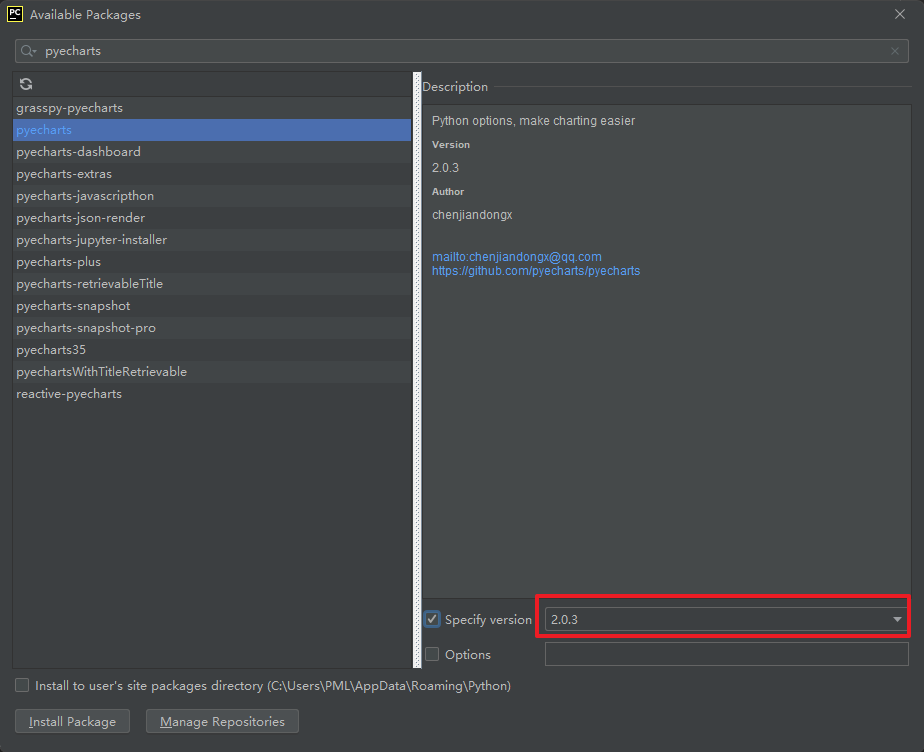
4.1、安装可视化库pyecharts
这个库新旧版本使用方法有较大的区别,所以版本一定不能下错。这边都是以新版为例
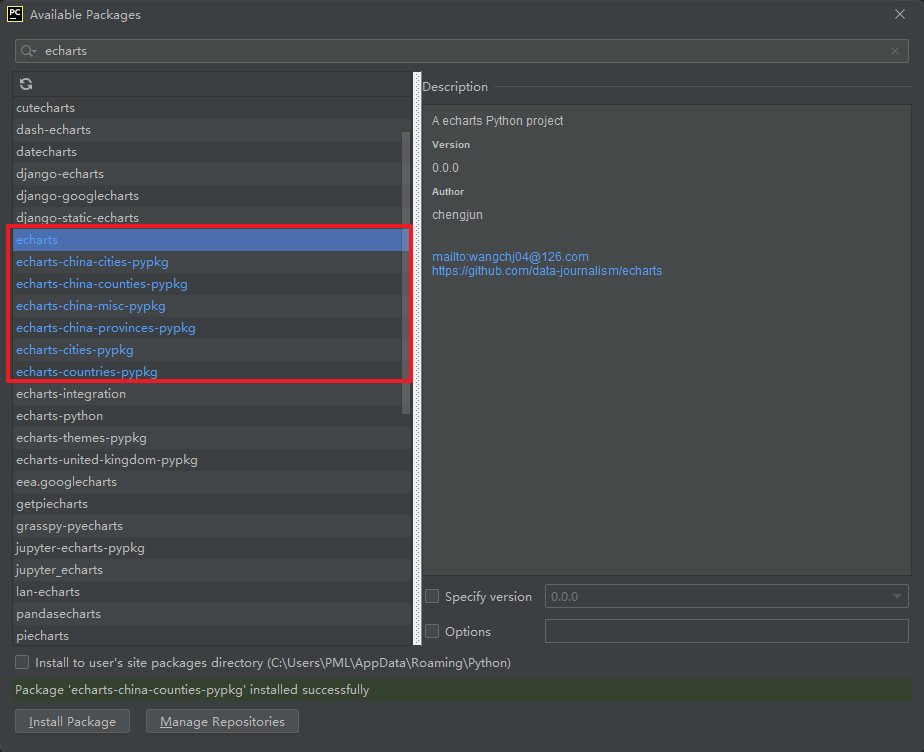
其次因为我们后面会用到地理坐标图,所以必须安装地图包,比如世界地图包,中国地图包,城市地图包等
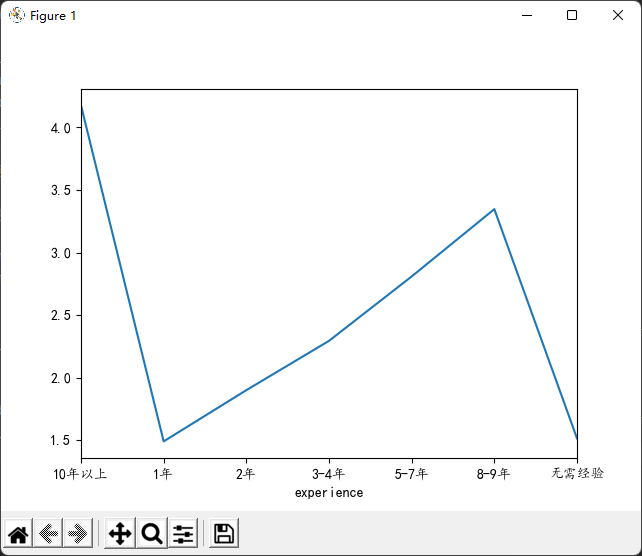
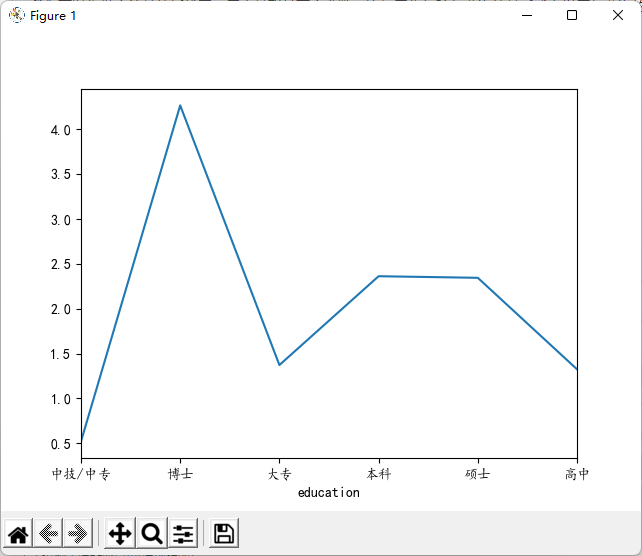
4.2、折线图
我们可以先做个简单的折线图,用来关联某两个参数,比如工作经验与薪资的关系或者学历与薪资的关系
import pandas as pd
import matplotlib.pyplot as plt

file = pd.read_excel(r'51job2.xls',sheet_name='Job')

pd.set_option('display.max_rows', None)  # 输出全部行,不省略
pd.set_option('display.max_columns', None)  # 输出全部列,不省略

f = pd.DataFrame(file)

sly = f['薪资']
edu = f['学历要求']
exp = f['工作经验']

salary = []             # 存放薪资
education = []          # 存放学历要求
experience = []         # 存放工作经验

for i in range(0,len(f)):
    try:
        salary.append(sly[i])
        education.append(edu[i])
        experience.append(exp[i])
        # print(sly[i],edu[i],exp[i])
    except:
       pass

#matplotlib模块如果显示不了中文字符串可以用以下代码。

plt.rcParams['font.sans-serif'] = ['KaiTi'] # 指定默认字体
plt.rcParams['axes.unicode_minus'] = False # 解决保存图像是负号'-'显示为方块的问题

my_df = pd.DataFrame({'experience':experience, 'salary': salary})				#关联工作经验与薪资
data1 = my_df.groupby('experience').mean()['salary'].plot(kind='line')
plt.show()

my_df2 = pd.DataFrame({'education':education, 'salary': salary})				#关联学历与薪资
data2 = my_df2.groupby('education').mean()['salary'].plot(kind='line')
plt.show()
效果如下:
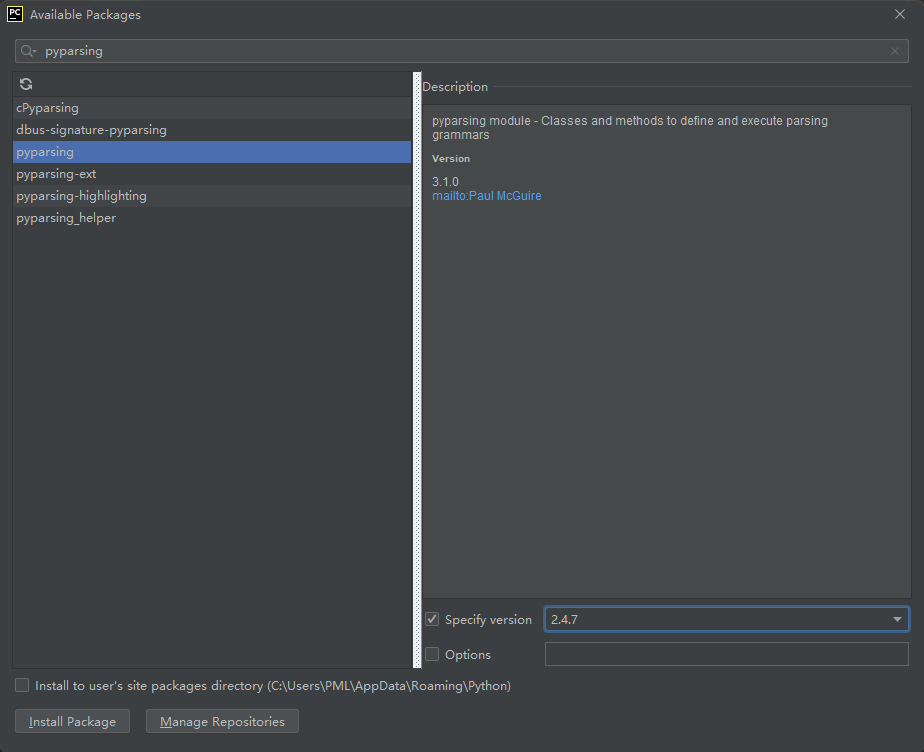
代码执行过程如果出现以下报错时往往是包的版本不对。
报错:'version_info' object has no attribute '__version__'
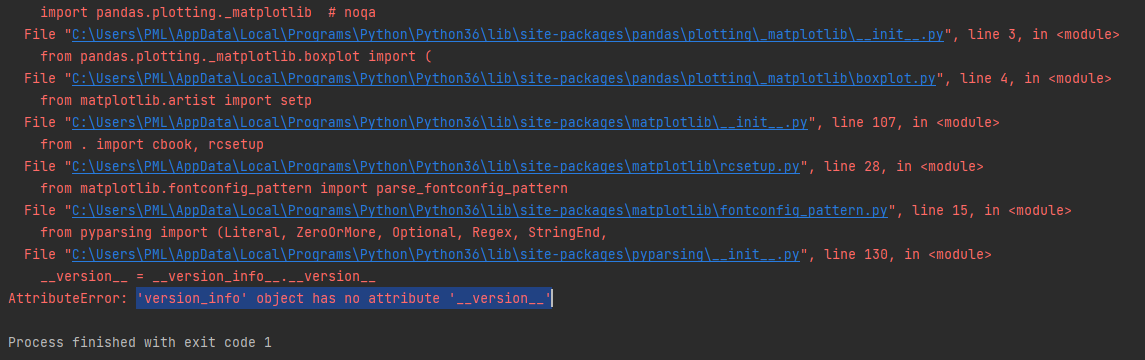
或者
先卸载原有包:pip uninstall pyparsing
再安装指定包:pip install pyparsing==2.4.7
4.3、动态饼图
import pandas as pd

from pyecharts.charts import Pie
from pyecharts import options as opts

file = pd.read_excel(r'51job2.xls',sheet_name='Job')

pd.set_option('display.max_rows', None)  # 输出全部行,不省略
pd.set_option('display.max_columns', None)  # 输出全部列,不省略

f = pd.DataFrame(file)

sly = f['薪资']
edu = f['学历要求']
exp = f['工作经验']

salary = []             # 存放薪资
education = []          # 存放学历要求
experience = []         # 存放工作经验

for i in range(0,len(f)):
    try:
        salary.append(sly[i])
        education.append(edu[i])
        experience.append(exp[i])
        # print(sly[i],edu[i],exp[i])
    except:
       pass

### 动态图

def get_edu(list):      # 储存 不同学历要求及其数量
    education_dir = {}
    for i in set(list):
        education_dir[i] = list.count(i)
    return education_dir

education_dir= get_edu(education)

attr= education_dir.keys()
value = education_dir.values()

# 旧版pyecharts 0.5.9
# pie = Pie("学历要求")
# pie.add("", attr, value, center=[50, 50], is_random=False, radius=[30, 75], rosetype='radius',
#         is_legend_show=False, is_label_show=True,legend_orient='vertical')
# pie.render('学历要求动态饼图.html')

# 新版pyecharts
c = (
    Pie()
    .add(
        "",
        [list(z) for z in zip(attr, value)],
        radius=["40%", "75%"],
    )
    .set_global_opts(
        title_opts=opts.TitleOpts(title="Pie-Radius"),
        legend_opts=opts.LegendOpts(orient="vertical", pos_top="15%", pos_left="2%"),
    )
    .set_series_opts(label_opts=opts.LabelOpts(formatter="{b}: {c}"))
    .render("学历要求动态饼图.html")
)
生成的html文件用浏览器打开
代码执行过程如果出现以下报错是环境不兼容导致
报错:AttributeError: 'Token' object has no attribute 'test'
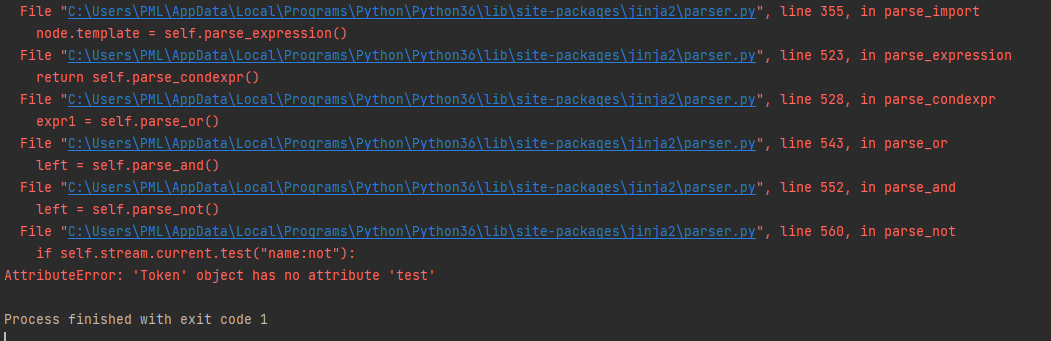
解决方法:
升级Python解释器,使用3.6.0以上版本。
降级Jinja2 ,使用3.0.1以下版本。
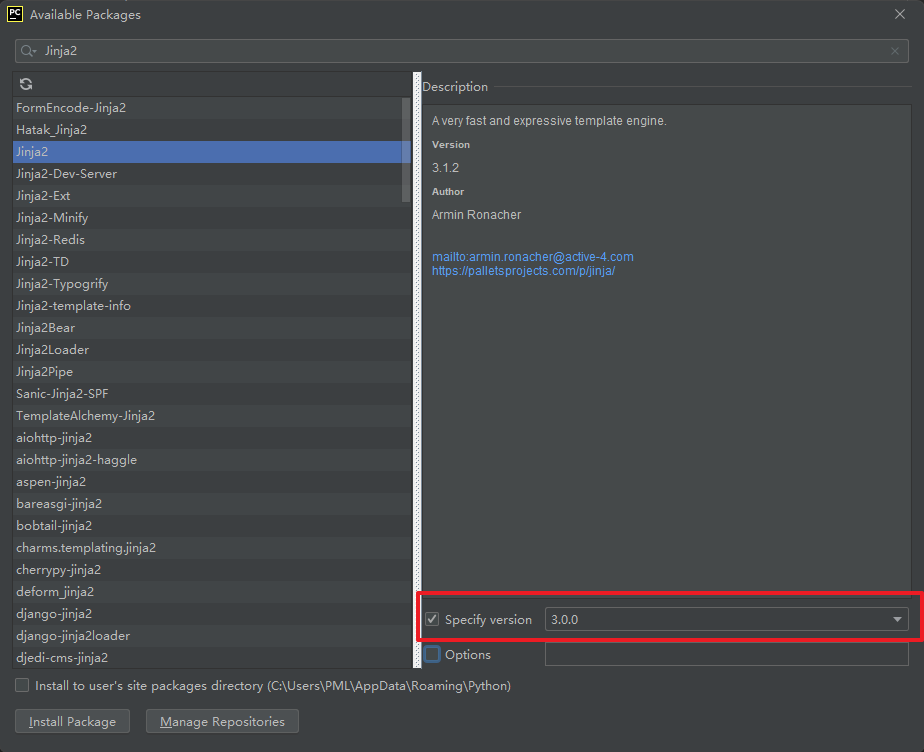
但是这样单独更新或降级其中某一些库,仍可能导致有其他bug,所以干脆最好直接使用Python3.7版本
4.4、漏斗图
import pandas as pd

from pyecharts.charts import Funnel
from pyecharts import options as opts

file = pd.read_excel(r'51job2.xls',sheet_name='Job')

pd.set_option('display.max_rows', None)  # 输出全部行,不省略
pd.set_option('display.max_columns', None)  # 输出全部列,不省略

f = pd.DataFrame(file)

sly = f['薪资']
edu = f['学历要求']
exp = f['工作经验']

salary = []             # 存放薪资
education = []          # 存放学历要求
experience = []         # 存放工作经验

for i in range(0,len(f)):
    try:
        salary.append(sly[i])
        education.append(edu[i])
        experience.append(exp[i])
        # print(sly[i],edu[i],exp[i])
    except:
       pass


def get_experience(list):           # 储存 工作经验要求及其数量
    experience_dir = {}
    for i in set(list):
         experience_dir[i] = list.count(i)
    return experience_dir
experience_dir = get_experience(experience)


attr2 = experience_dir.keys()
value2 = experience_dir.values()

# 旧版pyecharts 0.5.9
# funnel = Funnel("工作经验漏斗图",title_pos='center')
# funnel.add("", attr3, value3,is_label_show=True,label_pos="inside", label_text_color="#fff",legend_orient='vertical',legend_pos='left')
# funnel.render('工作经验要求漏斗图.html')

# 新版pyecharts
c = (
    Funnel()
    .add(
        "",
        [list(z) for z in zip(attr2, value2)],
        label_opts=opts.LabelOpts(position="inside"),
    )
    .set_global_opts(title_opts=opts.TitleOpts(title="Funnel-Label(inside)"))
    .render("工作经验要求漏斗图.html")
)
4.5、地理位置分布图
import pandas as pd

from pyecharts.charts import Geo
from pyecharts import options as opts

file = pd.read_excel(r'51job2.xls',sheet_name='Job')

pd.set_option('display.max_rows', None)  # 输出全部行,不省略
pd.set_option('display.max_columns', None)  # 输出全部列,不省略

f = pd.DataFrame(file)

add = f['公司地点']
sly = f['薪资']
edu = f['学历要求']
exp = f['工作经验']

address =[]             # 存放公司地点
salary = []             # 存放薪资
education = []          # 存放学历要求
experience = []         # 存放工作经验

for i in range(0,len(f)):
    try:
        address.append(add[i])
        salary.append(sly[i])
        education.append(edu[i])
        experience.append(exp[i])
        # print(add[i],sly[i],edu[i],exp[i])
    except:
       pass

def get_address(list):          # 储存 城市名及其数量
    address_dir = {}
    for i in set(list):
        address_dir[i] = list.count(i)
    try:
        address_dir.pop('异地招聘')
        # 有些地名可能不合法或者地图包里没有可以自行删除,之前以下名称都会报错,现在好像更新了没报错了
        # address_dir.pop('山东')
        # address_dir.pop('怒江')
        # address_dir.pop('池州')
    except:
        pass
    return address_dir

address_dir = get_address(address)

attr3 = address_dir.keys()
value3 = address_dir.values()

# 旧版pyecharts 0.5.9
# geo = Geo("大数据人才需求分布图", title_color="#2E2E2E",
#           title_text_size=24,title_top=20,title_pos="center", width=1300,height=600)

# geo.add("",attr2, value2, type="effectScatter", is_random=True, visual_range=[0, 1000], maptype='china',symbol_size=8, effect_scale=5, is_visualmap=True)
# geo.render('大数据城市需求分布图.html')

# 新版pyecharts
c = (
    Geo()
    .add_schema(maptype="china")
    .add("geo", [list(z) for z in zip(attr3, value3)])
    .set_series_opts(label_opts=opts.LabelOpts(is_show=False))
    .set_global_opts(
        visualmap_opts=opts.VisualMapOpts(), title_opts=opts.TitleOpts(title="Geo-基本示例")
    )
    .render("大数据城市需求分布图.html")
)
4.6、完整代码
import pandas as pd
import matplotlib.pyplot as plt

from pyecharts.charts import Pie,Funnel,Geo
from pyecharts import options as opts

file = pd.read_excel(r'51job2.xls',sheet_name='Job')

pd.set_option('display.max_rows', None)  # 输出全部行,不省略
pd.set_option('display.max_columns', None)  # 输出全部列,不省略

f = pd.DataFrame(file)

add = f['公司地点']
sly = f['薪资']
edu = f['学历要求']
exp = f['工作经验']

address =[]             # 存放公司地点
salary = []             # 存放薪资
education = []          # 存放学历要求
experience = []         # 存放工作经验

for i in range(0,len(f)):
    try:
        address.append(add[i])
        salary.append(sly[i])
        education.append(edu[i])
        experience.append(exp[i])
        # print(add[i],sly[i],edu[i],exp[i])
    except:
       pass

#matplotlib模块如果显示不了中文字符串可以用以下代码。

plt.rcParams['font.sans-serif'] = ['KaiTi'] # 指定默认字体
plt.rcParams['axes.unicode_minus'] = False # 解决保存图像是负号'-'显示为方块的问题

my_df = pd.DataFrame({'experience':experience, 'salary': salary})				#关联工作经验与薪资
data1 = my_df.groupby('experience').mean()['salary'].plot(kind='line')
plt.show()

my_df2 = pd.DataFrame({'education':education, 'salary': salary})				#关联学历与薪资
data2 = my_df2.groupby('education').mean()['salary'].plot(kind='line')
plt.show()

### 动态图

def get_edu(list):       # 储存 不同学历要求及其数量
    education_dir = {}
    for i in set(list):
        education_dir[i] = list.count(i)
    return education_dir

education_dir = get_edu(education)

attr= education_dir.keys()
value = education_dir.values()

# 旧版pyecharts 0.5.9
# pie = Pie("学历要求")
# pie.add("", attr, value, center=[50, 50], is_random=False, radius=[30, 75], rosetype='radius',
#         is_legend_show=False, is_label_show=True,legend_orient='vertical')
# pie.render('学历要求动态饼图.html')

# 新版pyecharts
c = (
    Pie()
    .add(
        "",
        [list(z) for z in zip(attr, value)],
        radius=["40%", "75%"],
    )
    .set_global_opts(
        title_opts=opts.TitleOpts(title="Pie-Radius"),
        legend_opts=opts.LegendOpts(orient="vertical", pos_top="15%", pos_left="2%"),
    )
    .set_series_opts(label_opts=opts.LabelOpts(formatter="{b}: {c}"))
    .render("学历要求动态饼图.html")
)

def get_experience(list):           # 储存 工作经验要求及其数量
    experience_dir = {}
    for i in set(list):
         experience_dir[i] = list.count(i)
    return experience_dir
experience_dir = get_experience(experience)


attr2 = experience_dir.keys()
value2 = experience_dir.values()

# 旧版pyecharts 0.5.9
# funnel = Funnel("工作经验漏斗图",title_pos='center')
# funnel.add("", attr3, value3,is_label_show=True,label_pos="inside", label_text_color="#fff",legend_orient='vertical',legend_pos='left')
# funnel.render('工作经验要求漏斗图.html')

# 新版pyecharts
c = (
    Funnel()
    .add(
        "",
        [list(z) for z in zip(attr2, value2)],
        label_opts=opts.LabelOpts(position="inside"),
    )
    .set_global_opts(title_opts=opts.TitleOpts(title="Funnel-Label(inside)"))
    .render("工作经验要求漏斗图.html")
)

def get_address(list):          # 储存 城市名及其数量
    address_dir = {}
    for i in set(list):
        address_dir[i] = list.count(i)
    try:
        address_dir.pop('异地招聘')
        # 有些地名可能不合法或者地图包里没有可以自行删除,之前以下名称都会报错,现在好像更新了没报错了
        # address_dir.pop('山东')
        # address_dir.pop('怒江')
        # address_dir.pop('池州')
    except:
        pass
    return address_dir

address_dir = get_address(address)

attr3 = address_dir.keys()
value3 = address_dir.values()

# 旧版pyecharts 0.5.9
# geo = Geo("大数据人才需求分布图", title_color="#2E2E2E",
#           title_text_size=24,title_top=20,title_pos="center", width=1300,height=600)

# geo.add("",attr2, value2, type="effectScatter", is_random=True, visual_range=[0, 1000], maptype='china',symbol_size=8, effect_scale=5, is_visualmap=True)
# geo.render('大数据城市需求分布图.html')

# 新版pyecharts
c = (
    Geo()
    .add_schema(maptype="china")
    .add("geo", [list(z) for z in zip(attr3, value3)])
    .set_series_opts(label_opts=opts.LabelOpts(is_show=False))
    .set_global_opts(
        visualmap_opts=opts.VisualMapOpts(), title_opts=opts.TitleOpts(title="Geo-基本示例")
    )
    .render("大数据城市需求分布图.html")
)
除了上面介绍到的动态图之外,其实还有很多更炫酷种图,而且可以修改参数使得图显示风格多样化,具体可以查看开源代码库:https://github.com/pyecharts/pyecharts
5、结语
很多人在爬取数据那一步可能会遇到很多问题,这个时候就需要耐心的调试,而且不同的网站规则肯定是不一样的。本篇爬虫适用于前程无忧网,但是,后续随着网站的更新,同样会出现一些问题,所以我们不仅仅是只进行代码的照搬,我们还需要理解代码真正的含义。
另外就是版本兼容性的问题,Python版本和一些库的版本需要关注,目前我使用的是Python3.7,这个版本跑下来基本没有出现bug。