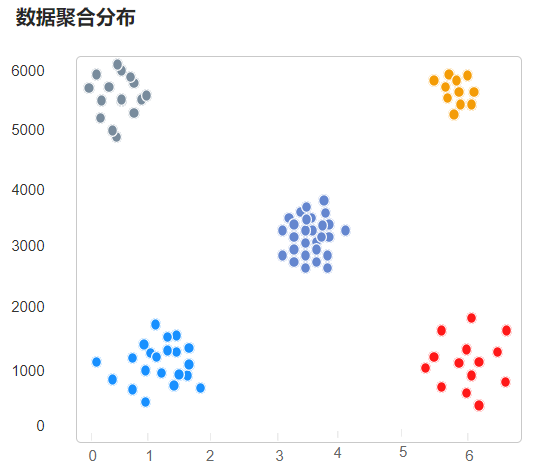
实现如下效果:
效果展示:https://code.juejin.cn/pen/7228568245148581943
如果不会请移步到官网的栗子,请点击查看
直接给大家上代码:
- 整体代码片段


 1 <template>
 2     <div ref="echarts" style="width: 100%; height:300px;"></div>
 3 </template>
 4 <script>
 5 /* eslint-disable */
 6 import { setClusterOption } from "@/util/clusterConfig";
 7 import ecStat from 'echarts-stat';
 8
 9 export default {
10     name: 'ClusterDom',
11     props: ["simulationList", "pieCount"],
12     data() {
13         return {
14         }
15     },
16     mounted() {
17         this.$nextTick(() => {
18             this.loadBars();
19         });
20     },
21     methods: {
22         loadBars() {
23             this.$nextTick(function () {
24                 let myChart = this.$echarts.init(this.$refs.echarts) // 绘制图表
25                 this.$echarts.registerTransform(ecStat.transform.clustering);
26
27                 // 指定图表的配置项和数据
28                 let text = "", axisData = [];
29
30                 if(this.simulationList.length){
31                     this.simulationList.forEach((item, index) => {
32                         axisData[index] = item.map(Number);
33                     });
34                 }
35
36                 text = `聚类分布模拟呈现`;
37                 let option = setClusterOption(text, axisData, this.pieCount);
38
39                 // 使用刚指定的配置项和数据显示图表。
40                 myChart.setOption(option);
41                 window.addEventListener('resize', function () {
42                     setTimeout(function () {
43                         myChart.resize();
44                     }, 200)
45                 });
46             });
47         }
48     }
49 }
50 </script>
- clusterConfig.js
 1 import color from '@/util/colorConfig.js';
 2
 3 // 散点图
 4 export const setClusterOption = (text, data, pieCount) => {
 5   const CLUSTER_COUNT = pieCount;
 6   const DIENSIION_CLUSTER_INDEX = 2;
 7   let colorArr = color.slice(0, pieCount);
 8
 9   let option = {
10     title: {
11       text,
12       textStyle: {
13         color: "#666",
14         fontSize: 16,
15         fontWeight: "normal",
16         top: "0"
17       }
18     },
19     dataset: [
20       {
21         source: data
22       },
23       {
24         transform: {
25           type: 'ecStat:clustering',
26           config: {
27             clusterCount: CLUSTER_COUNT,
28             outputType: 'single',
29             outputClusterIndexDimension: DIENSIION_CLUSTER_INDEX
30           }
31         }
32       }
33     ],
34     tooltip: {
35       position: 'top'
36     },
37     visualMap: {
38       show: false,
39       type: 'piecewise',
40       top: 'middle',
41       min: 0,
42       max: CLUSTER_COUNT,
43       left: 10,
44       splitNumber: CLUSTER_COUNT,
45       dimension: DIENSIION_CLUSTER_INDEX
46     },
47     grid: {
48       top: "15%",
49       left: "0",
50       // right: "0",
51       bottom: "0",
52       containLabel: true
53     },
54     xAxis: {},
55     yAxis: {},
56     series: {
57       type: 'scatter',
58       encode: { tooltip: [0, 1] },
59       symbolSize: 10,
60       itemStyle: {
61         borderColor: '#555'
62       },
63       data: data.map(item => {
64         return {
65           value: item,
66           itemStyle: {
67             normal: {
68               color: colorArr[item.pop()],
69             },
70           }
71         }
72       }),
73       datasetIndex: 1
74     }
75   };
76   return option;
77 }
- colorConfig.js
 1 let colorArr = [
 2     '#4EADFF',
 3     '#55D9FA',
 4     '#9CA5E9',
 5     '#2E98F3',
 6     '#5FCAD2',
 7     '#69C97F',
 8     '#F2CA30',
 9     '#FFA97A',
10     '#DAC4AA',
11     '#CF98E9',
12     '#F6B4DE',
13     '#F37379',
14     '#98ACC3',
15     '#75E4C1',
16     '#BEDC63',
17     '#98CFD0',
18     '#9B92F1',
19     '#26A479',
20     '#6068B3',
21     '#AE9E42',
22     '#D17952'
23 ];
24
25 export default colorArr;
鉴定完毕,欢迎友友们一起交流学习!!