C++ Profiler Introduction [CPU Time Only]
author: LastWhisperdate: 2023/10/05
There are several profilers for C++. Based on my research, I've found that tracy is the most powerful. However, it's challenging to configure. To quickly benchmark our engine, I've decided to first test perf and gprof.
When diving into performance optimization, a crucial step is understanding where bottlenecks lie. Profilers are our primary tool in this endeavor. Today, we'll compare two popular profilers (currently): perf and gprof.
Profilers mechanisms
Profilers utilize a variety of mechanisms to gather data about a program's execution. Here are the primary mechanisms employed by profilers:
-
Sampling-Based (Statistical Profiling):
- Description: The profiler periodically interrupts the program (based on a timer or other criteria) and records its state, typically the program counter or the call stack. By aggregating these samples, the profiler can deduce where the program spends most of its time.
- Advantages: Low overhead, provides a general overview of where time is spent.
- Disadvantages: Less precise, might miss short-lived or infrequently-called functions.
-
Instrumentation-Based (Tracing):
- Description: Code is explicitly instrumented to report function entries, exits, and/or other events of interest. This can be done either manually by developers or automatically by compilers/tools.
- Advantages: Very precise, provides rich data including exact call counts and relationships.
- Disadvantages: Typically higher overhead than sampling, can lead to "observer effect" where the act of measuring affects performance.
-
Event-Based (Hardware Counters):
- Description: Utilizes hardware performance counters in CPUs to gather data on specific events, like cache misses, branch mispredictions, and more.
- Advantages: Can provide deep insights into hardware-level behavior and interactions.
- Disadvantages: Platform-specific, might require special privileges or configurations.
These mechanisms can be used individually or in combination, depending on the profiler and the specific needs of the profiling task. When choosing a profiler or profiling mechanism, it's essential to consider the trade-offs in terms of precision, overhead, and the type of insights you're looking to gain.
perf
Background
- Inventor: The
perftool is part of the Linux kernel source tree and was introduced with the Linux 2.6.31 release. - Operating Systems: Linux
Tick
In the context of operating systems, a "tick" usually refers to a timer event that occurs at a fixed frequency. This event can be utilized for various tasks, such as updating the system clock or scheduling processes. In Unix-like systems, the frequency of this timer event is typically 100Hz, 250Hz, 1000Hz, etc., meaning there are 100, 250, or 1000 tick events every second.
In most scenarios, especially during performance analysis, perf operates based on sampling, as mentioned earlier under Profilers mechanisms. To collect performance data, perf employs several techniques, one of which is periodic interrupts. When you use the sampling feature of perf (for example, perf record), it sets up the processor's Performance Counters to generate an interrupt after a specific number of events, such as a certain number of CPU instructions or cycles.
This interrupt can be considered a "tick" since it happens at a fixed frequency or after a fixed number of events. When such an interrupt occurs, perf captures the current context, including the address of the instruction being executed, the call stack, and more. By collecting these samples, perf provides users an overview of performance hotspots during program execution.
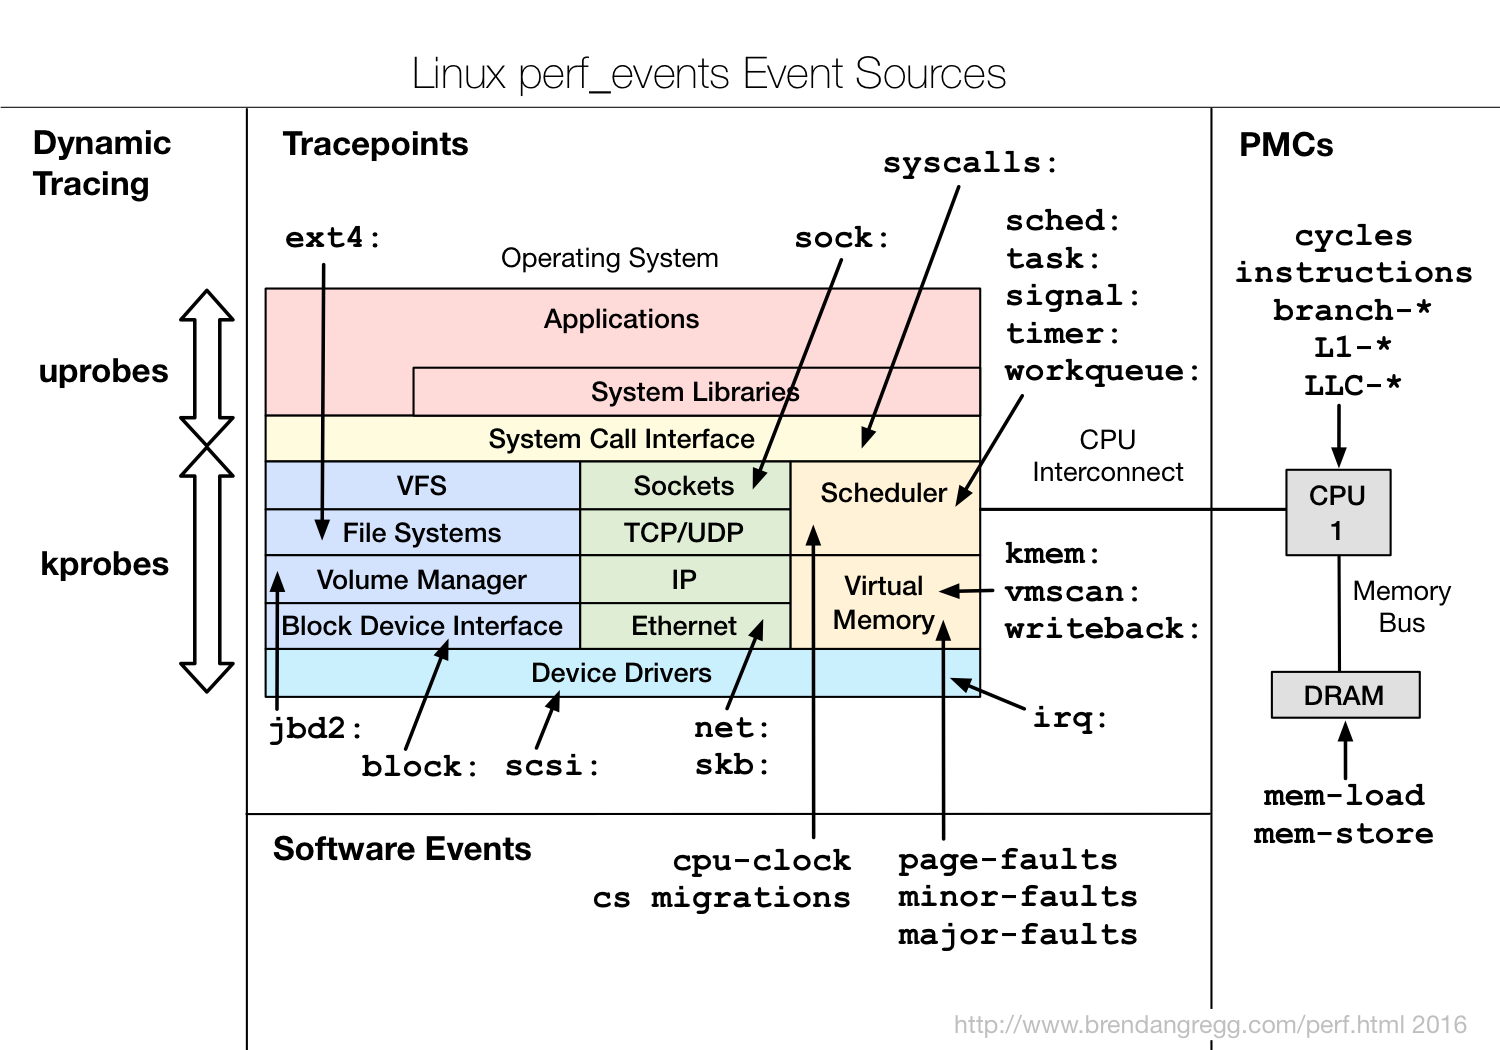
Furthermore, to truly grasp the power of perf, it's essential to understand the concept of perf_events: "perf_events is an event-oriented observability tool that aids in advanced performance and troubleshooting tasks." A detailed graphic illustrates the information that perf can monitor.
The Role of This Tool
perf is a versatile Linux performance tool that provides a rich set of commands to collect and analyze performance and trace data. It taps into hardware counters in the CPU to fetch detailed information about the system's state and performance.
How to Use This Tool (basic)
-
Installation:
sudo apt-get install linux-tools-common linux-tools-generic linux-tools-`uname -r` -
Recording Performance Data:
perf record <your_program_and_arguments> # If use CMake. perf record -<Option> make <Your command> -
Analyzing the Collected Data:
perf report -
Get the performance difference after optimization (if
perf.data.oldexists):perf diff perf.data perf.data.old -
Other Commands:
- View available events:
perf list - Gather overall statistics:
perf stat - Show real-time top functions:
perf top
- View available events:
Advance Usage of perf
More optional flags for perf record
For more usage example, please refer to perf Examples in Reference.
How to generate a flamegraph depending on perf.
[TODO]
Pros and Cons
Pros:
- Provides detailed hardware-level information.
- Can profile the entire system, not just a single application.
- Does not require recompiling the target program.
Cons:
- Specific to Linux.
- Might have a steep learning curve for beginners due to its extensive functionality.
Reference
gprof
Background
- Inventor:
gprofwas introduced as part of the GNU Binary Utilities (binutils) suite. - Operating Systems: Unix-like systems, including Linux
The Role of This Tool
gprof analyzes an executable's performance to determine the amount of time spent in each function and provides both flat profiles and call graphs.
How to Use This Tool
-
Compilation:
Compile and link your program with the-pgflag.g++ -pg -o myprog myprog.cppTo uiltize the
gprofwith CMake, consider the example code below.# Profiler `gprof` usage setup. add_executable(<example_main> ${your_sources}) # Add -pg to support `gprof` running. target_compile_options(<example_main> PRIVATE -pg) set_target_properties(<example_main> PROPERTIES LINK_FLAGS "-pg") # Link necessary libraries. target_link_libraries(<example_main> <needed libraries>) -
Run the Program:
By running the program, you'll generate agmon.outfile../myprog -
Analyze with gprof:
gprof myprog gmon.out > analysis.txt
Pros and Cons
Pros:
- Simple and easy to use.
- Provides both flat profiles and call graphs.
Cons:
- Requires recompiling the target program.
- Less detailed than
perfin terms of hardware-level insights.
Reference
tracy
[TODO]
Summary
In conclusion, while gprof is a straightforward tool suitable for quick insights, perf offers in-depth analysis, especially for intricate performance bottlenecks. Choosing between them depends on your specific requirements and the depth of analysis needed.
However, based on my current use and research, their support for multi-thread/multi-process performance testing is not very good. And ordinary people are more suitable for tracing rather than only output the bottleneck of the program.