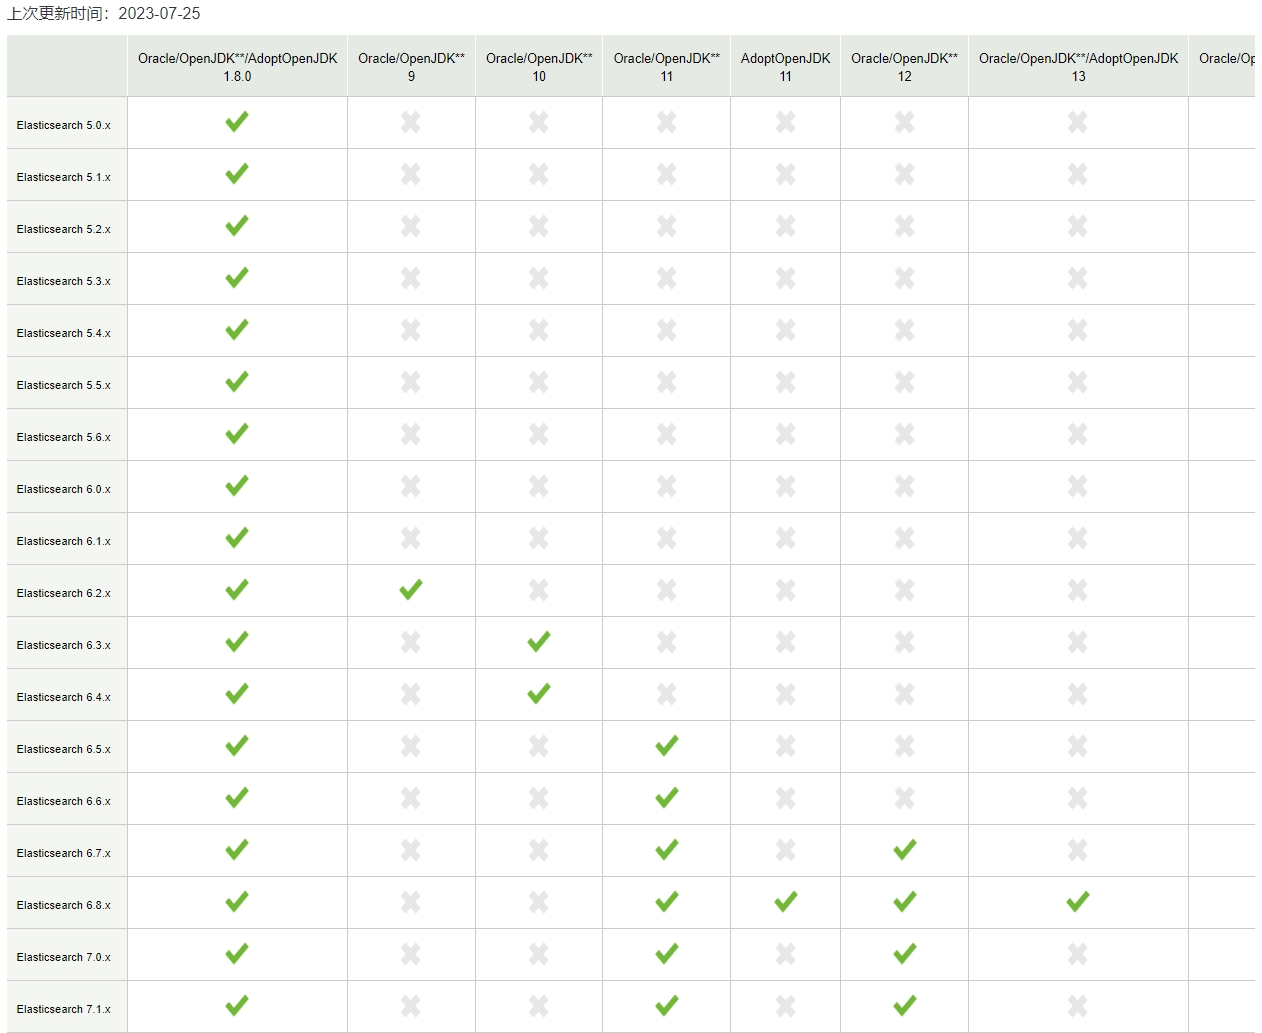
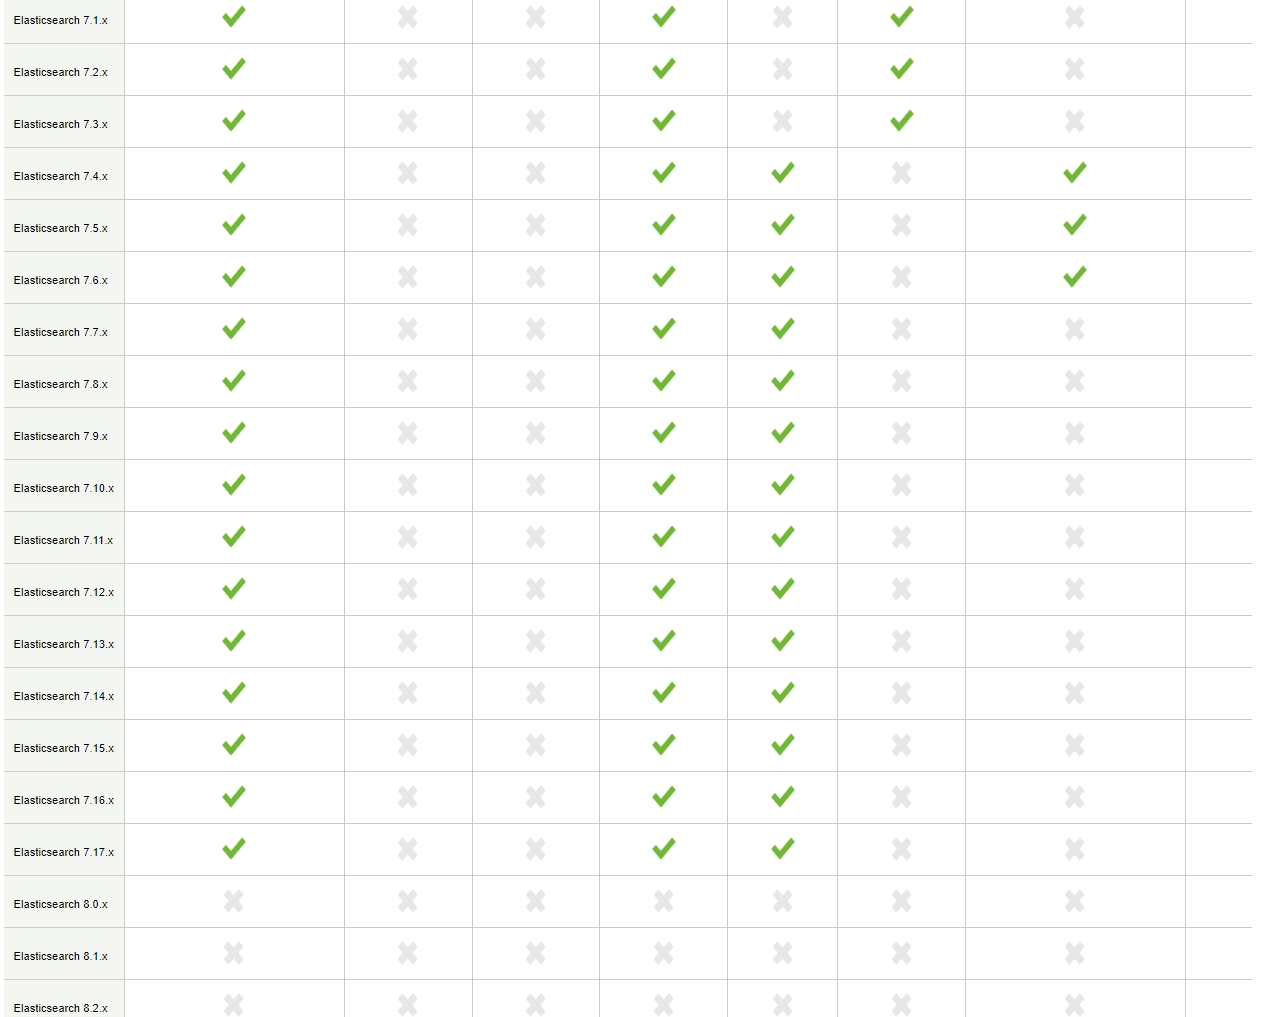
- Jdk与Elastic版本对应关系:https://www.elastic.co/cn/support/matrix#matrix_jvm
- 下载地址:
Elasticsearch:https://www.elastic.co/cn/downloads/elasticsearch
Logstash:https://www.elastic.co/cn/downloads/logstash
Kibana:https://www.elastic.co/cn/downloads/kibana
Filebeat:https://www.elastic.co/cn/downloads/beats/filebeat
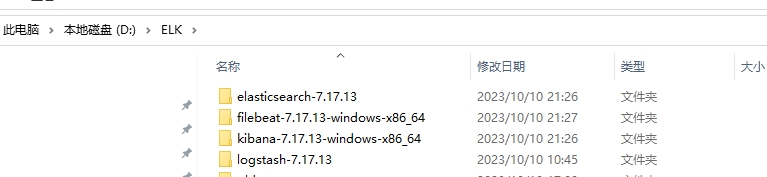
注意,安装时这4个版本需要统一,我下载的是7.17.13版本
使用nssm将elasticsearch、kibana注册成Windows服务
官网:https://www.nssm.cc/download
- 安装步骤
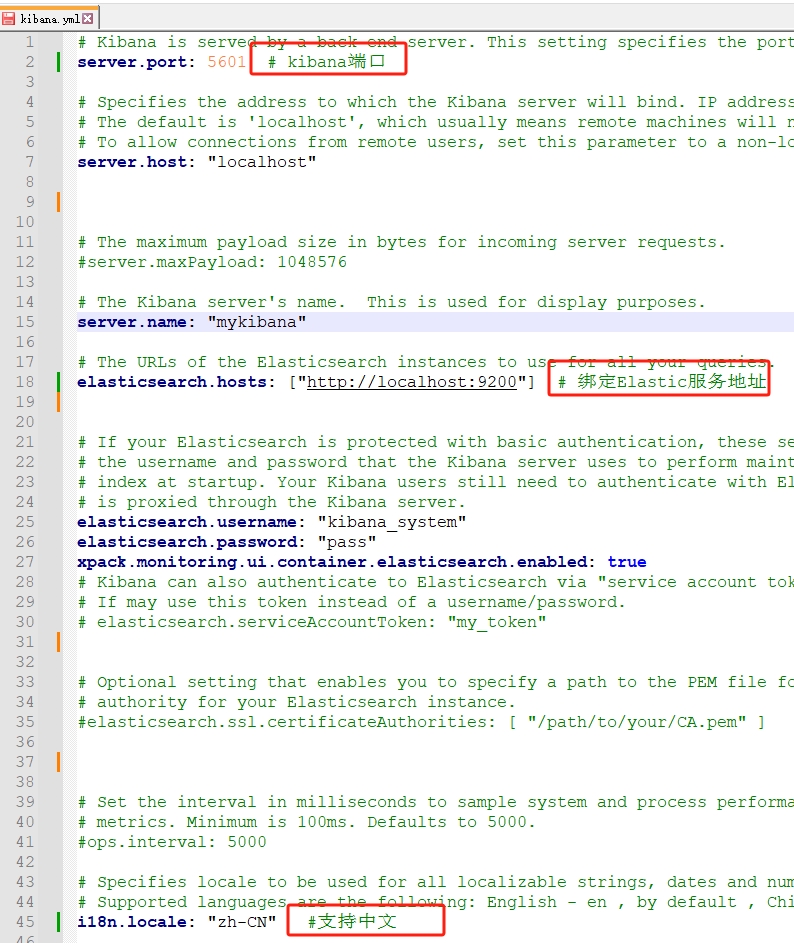
2、Kibana安装
kibana配置文件设置D:\ELK\kibana-7.17.13-windows-x86_64\config\kibana.yml
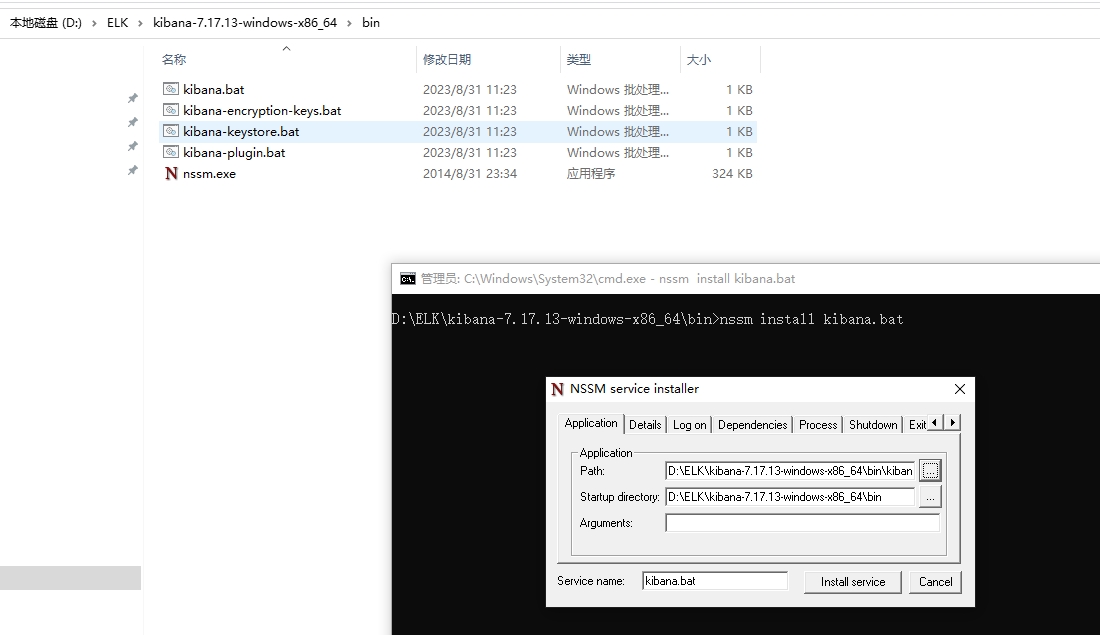
使用nssm将Kibana注册成服务,
将下载后的nssm.exe文件复制到Kibana的bin目录,在当前目录输入cmd,执行命令,选择path后,单击install service
nssm install kibana.bat
查看 elasticsearch http://127.0.0.1:9200
查看 Kibana http://127.0.0.1:5601
3、Logstash启动
在D:\ELK\logstash-7.17.13\config中新建logstash-local.conf
#input是日志文件的来源处,可以从log文件中读取,也可以从后台端口服务中启用
#这边配置的是从beats(filebeats)中上传读取的,
input {
  beats {
    port => 5044
  }
}
#filter是过滤器,可以用来匹配日志,利用自定义字段区分判断日志归属

#output主要是日志的输出,基本上都是发送到elasticsearch
output {
  elasticsearch {
   hosts => ["http://localhost:9200"]
   index => "%{[fields][service_name]}-%{+YYYY.MM.dd}"
 }
 stdout { codec => rubydebug }
}
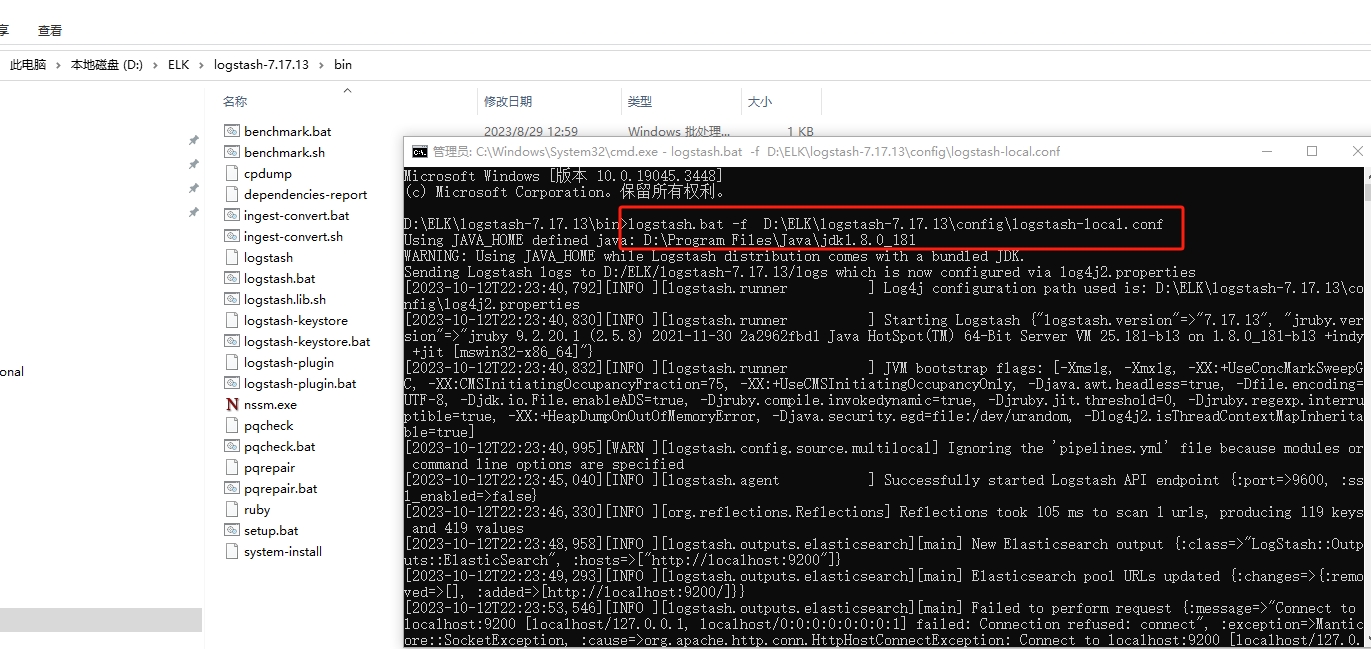
在bin目录执行命令:
logstash.bat -f D:\ELK\logstash-7.17.13\config\logstash-local.conf
4、beats(filebeat)配置启动文件,配置多log文件监控


###################### Filebeat Configuration Example #########################

# This file is an example configuration file highlighting only the most common
# options. The filebeat.reference.yml file from the same directory contains all the
# supported options with more comments. You can use it as a reference.
#
# You can find the full configuration reference here:
# https://www.elastic.co/guide/en/beats/filebeat/index.html

# For more available modules and options, please see the filebeat.reference.yml sample
# configuration file.

# ============================== Filebeat inputs ===============================

filebeat.config.inputs:
  enabled: true
  path: configs/*.yml
  reload.enabled: true
  reload.period: 10s

filebeat.inputs:

# Each - is an input. Most options can be set at the input level, so
# you can use different inputs for various configurations.
# Below are the input specific configurations.

# filestream is an input for collecting log messages from files.
- type: log

  # Unique ID among all inputs, an ID is required.
  #id: my-filestream-task

  # Change to true to enable this input configuration.
  enabled: true
  #fields_under_root: true
  #recursive_glob.enabled: true
  # Paths that should be crawled and fetched. Glob based paths.
  paths:
    - C:\app\order\log\*.log  # /var/log/*.log
    #- c:\programdata\elasticsearch\logs\*
  #tags: ["dlabs-task-log"]
  encoding: utf-8  #支持中文,如不起作用,换 GB2312
  #harvester_buffer_size: 600000
  #max_bytes: 10485760
  fields:
    service_name: order-service

- type: log

  # Unique ID among all inputs, an ID is required.
  #id: my-filestream-task

  # Change to true to enable this input configuration.
  enabled: true
  #fields_under_root: true
  #recursive_glob.enabled: true
  # Paths that should be crawled and fetched. Glob based paths.
  paths:
    - C:\app\user\log\*.log  # /var/log/*.log
    #- c:\programdata\elasticsearch\logs\*
  #tags: ["dlabs-task-log"]
  encoding: utf-8
  #harvester_buffer_size: 600000
  #max_bytes: 10485760
  fields:
    service_name: user-service


  # Exclude lines. A list of regular expressions to match. It drops the lines that are
  # matching any regular expression from the list.
  #exclude_lines: ['^DBG']

  # Include lines. A list of regular expressions to match. It exports the lines that are
  # matching any regular expression from the list.
  #include_lines: ['^ERR', '^WARN']

  # Exclude files. A list of regular expressions to match. Filebeat drops the files that
  # are matching any regular expression from the list. By default, no files are dropped.
  #prospector.scanner.exclude_files: ['.gz$']

  # Optional additional fields. These fields can be freely picked
  # to add additional information to the crawled log files for filtering
  #fields:
   # mytype: task
  #  level: debug
  #  review: 1

# ============================== Filebeat modules ==============================

filebeat.config.modules:
  # Glob pattern for configuration loading
  path: ${path.config}/modules.d/*.yml

  # Set to true to enable config reloading
  reload.enabled: false

  # Period on which files under path should be checked for changes
  #reload.period: 10s

# ======================= Elasticsearch template setting =======================

setup.template.settings:
  index.number_of_shards: 1
  #index.codec: best_compression
  #_source.enabled: false


# ================================== General ===================================

# The name of the shipper that publishes the network data. It can be used to group
# all the transactions sent by a single shipper in the web interface.
#name:

# The tags of the shipper are included in their own field with each
# transaction published.
#tags: ["service-X", "web-tier"]

# Optional fields that you can specify to add additional information to the
# output.
#fields:
#  env: staging

# ================================= Dashboards =================================
# These settings control loading the sample dashboards to the Kibana index. Loading
# the dashboards is disabled by default and can be enabled either by setting the
# options here or by using the `setup` command.
#setup.dashboards.enabled: false

# The URL from where to download the dashboards archive. By default this URL
# has a value which is computed based on the Beat name and version. For released
# versions, this URL points to the dashboard archive on the artifacts.elastic.co
# website.
#setup.dashboards.url:

# =================================== Kibana ===================================

# Starting with Beats version 6.0.0, the dashboards are loaded via the Kibana API.
# This requires a Kibana endpoint configuration.
setup.kibana:

  # Kibana Host
  # Scheme and port can be left out and will be set to the default (http and 5601)
  # In case you specify and additional path, the scheme is required: http://localhost:5601/path
  # IPv6 addresses should always be defined as: https://[2001:db8::1]:5601
  #host: "localhost:5601"

  # Kibana Space ID
  # ID of the Kibana Space into which the dashboards should be loaded. By default,
  # the Default Space will be used.
  #space.id:

# =============================== Elastic Cloud ================================

# These settings simplify using Filebeat with the Elastic Cloud (https://cloud.elastic.co/).

# The cloud.id setting overwrites the `output.elasticsearch.hosts` and
# `setup.kibana.host` options.
# You can find the `cloud.id` in the Elastic Cloud web UI.
#cloud.id:

# The cloud.auth setting overwrites the `output.elasticsearch.username` and
# `output.elasticsearch.password` settings. The format is `<user>:<pass>`.
#cloud.auth:

# ================================== Outputs ===================================

# Configure what output to use when sending the data collected by the beat.

# ---------------------------- Elasticsearch Output ----------------------------
#output.elasticsearch:
  # Array of hosts to connect to.
  #hosts: ["localhost:9200"]

  # Protocol - either `http` (default) or `https`.
  #protocol: "https"

  # Authentication credentials - either API key or username/password.
  #api_key: "id:api_key"
  #username: "elastic"
  #password: "123456"

# ------------------------------ Logstash Output -------------------------------
output.logstash:
  # The Logstash hosts
  enable: true
  hosts: ["localhost:5044"]

  # Optional SSL. By default is off.
  # List of root certificates for HTTPS server verifications
  #ssl.certificate_authorities: ["/etc/pki/root/ca.pem"]

  # Certificate for SSL client authentication
  #ssl.certificate: "/etc/pki/client/cert.pem"

  # Client Certificate Key
  #ssl.key: "/etc/pki/client/cert.key"

# ================================= Processors =================================
processors:
  - add_host_metadata:
      when.not.contains.tags: forwarded
  - add_cloud_metadata: ~
  - add_docker_metadata: ~
  - add_kubernetes_metadata: ~

# ================================== Logging ===================================

# Sets log level. The default log level is info.
# Available log levels are: error, warning, info, debug
#logging.level: debug

# At debug level, you can selectively enable logging only for some components.
# To enable all selectors use ["*"]. Examples of other selectors are "beat",
# "publisher", "service".
#logging.selectors: ["*"]

# ============================= X-Pack Monitoring ==============================
# Filebeat can export internal metrics to a central Elasticsearch monitoring
# cluster.  This requires xpack monitoring to be enabled in Elasticsearch.  The
# reporting is disabled by default.

# Set to true to enable the monitoring reporter.
#monitoring.enabled: false

# Sets the UUID of the Elasticsearch cluster under which monitoring data for this
# Filebeat instance will appear in the Stack Monitoring UI. If output.elasticsearch
# is enabled, the UUID is derived from the Elasticsearch cluster referenced by output.elasticsearch.
#monitoring.cluster_uuid:

# Uncomment to send the metrics to Elasticsearch. Most settings from the
# Elasticsearch output are accepted here as well.
# Note that the settings should point to your Elasticsearch *monitoring* cluster.
# Any setting that is not set is automatically inherited from the Elasticsearch
# output configuration, so if you have the Elasticsearch output configured such
# that it is pointing to your Elasticsearch monitoring cluster, you can simply
# uncomment the following line.
#monitoring.elasticsearch:

# ============================== Instrumentation ===============================

# Instrumentation support for the filebeat.
#instrumentation:
    # Set to true to enable instrumentation of filebeat.
    #enabled: false

    # Environment in which filebeat is running on (eg: staging, production, etc.)
    #environment: ""

    # APM Server hosts to report instrumentation results to.
    #hosts:
    #  - http://localhost:8200

    # API Key for the APM Server(s).
    # If api_key is set then secret_token will be ignored.
    #api_key:

    # Secret token for the APM Server(s).
    #secret_token:


# ================================= Migration ==================================

# This allows to enable 6.7 migration aliases
#migration.6_to_7.enabled: true
以服务方式启动
sc create Elastic.filebeat binpath= "C:\\ELK\filebeat-7.17.13-windows-x86_64\\filebeat.exe -c C:\\ELK\filebeat-7.17.13-windows-x86_64\\filebeat.yml -e" start= auto
注意:要先启动logstash,再启动filebeat,不然会报端口错误
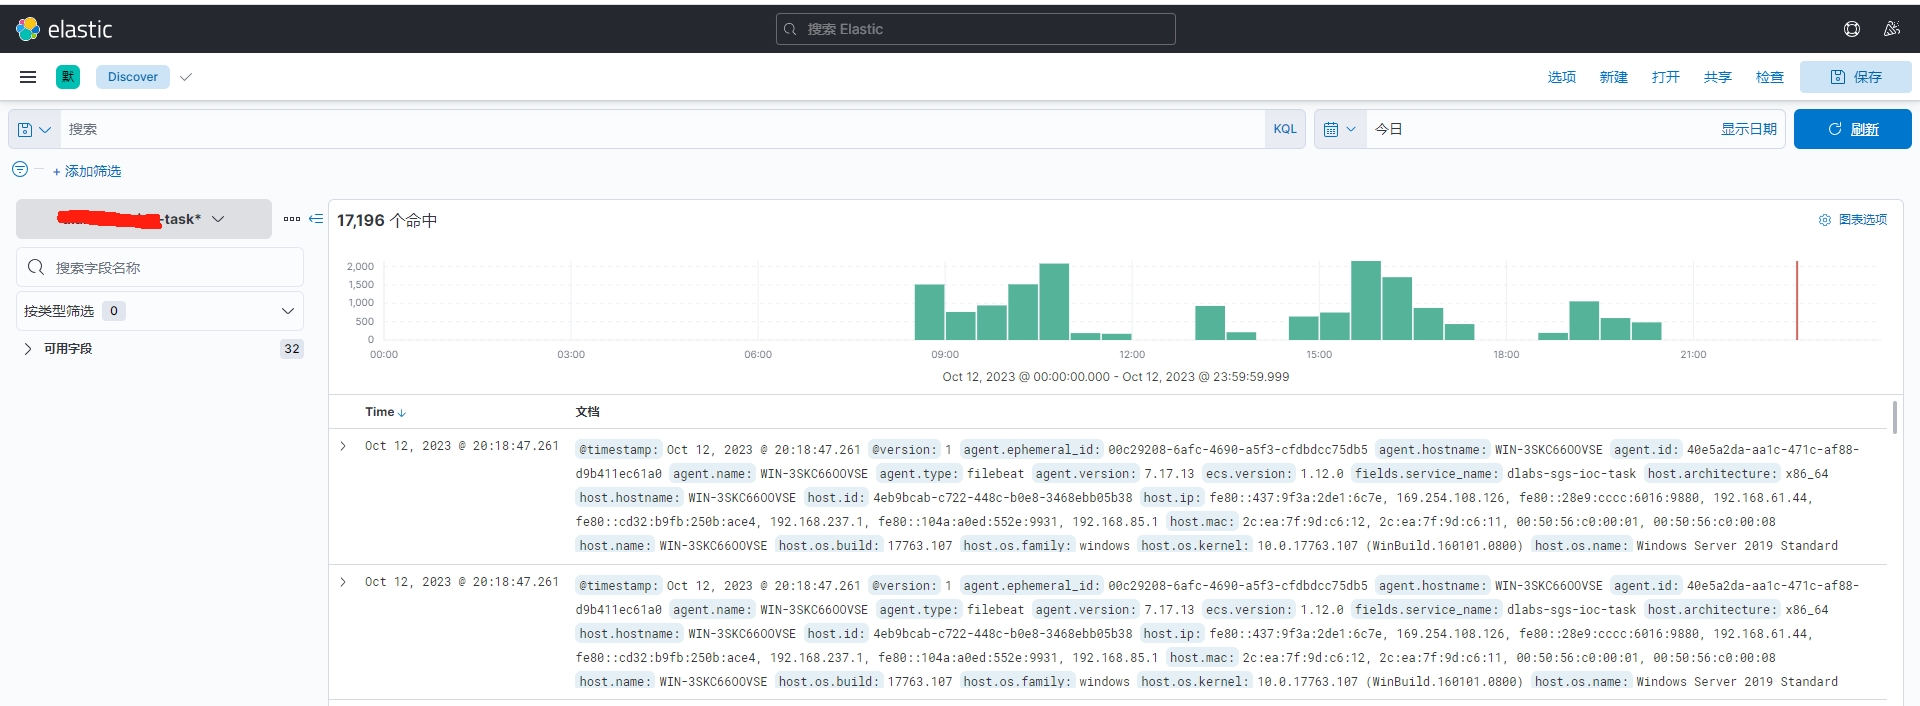
创建索引

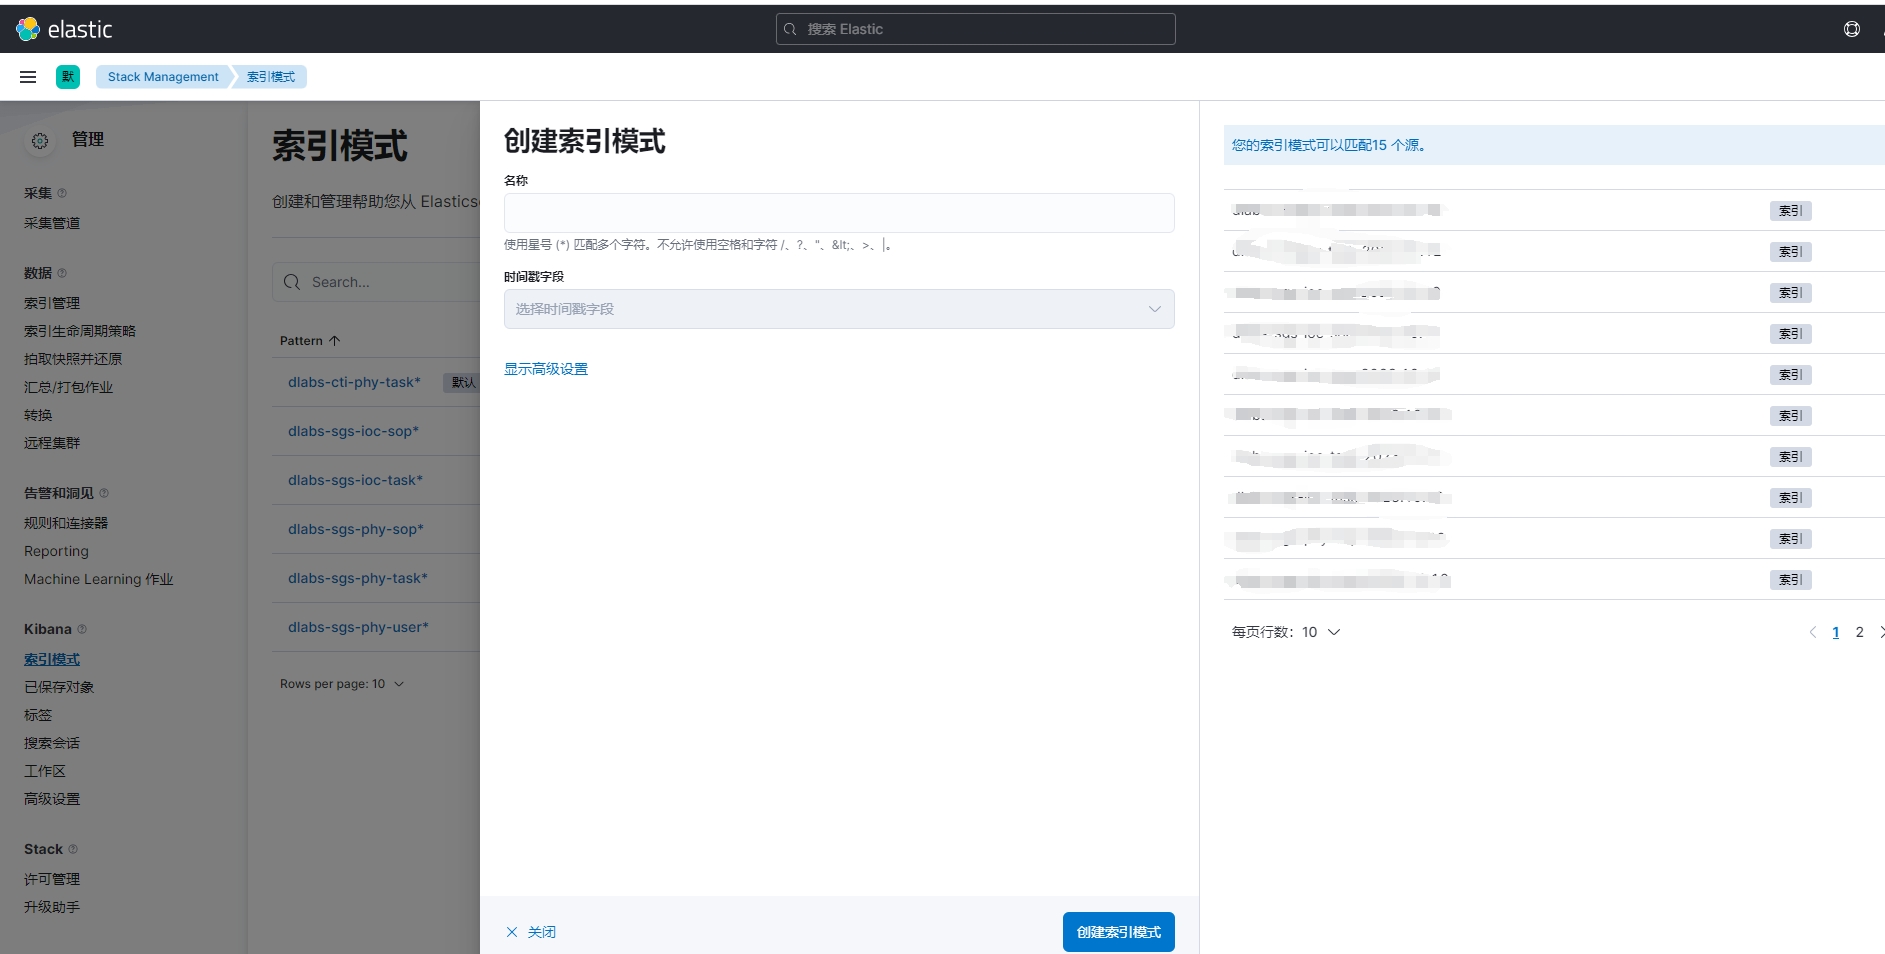
参考:https://blog.csdn.net/qq_43991936/article/details/128559302