Prometheus受启发于Google的Brogmon监控系统(类似kubernetes是从Google的Brog系统演变而来)。于2012年以开源形式发布,在2015年对外发布早期版本。2016年发布1.0版本,2017年发布基于全新存储层的2.0版本,能更好地与容器平台、云平台配合。当前Prometheus已经称为新一代的云原生监控系统。
部署环境要求:
相同操作相同:centos8;
关闭防火墙和seinux;
时间同步;
| IP | 主机名 | 角色 |
| 192.168.26.101 | xkf | 监控端(部署Grafana、Prometheus) |
| 192.168.26.102 | wss | 被监控端(部署node_exporter) |
1.下载Linux部署监控组件
下载监控端和被监控端组件
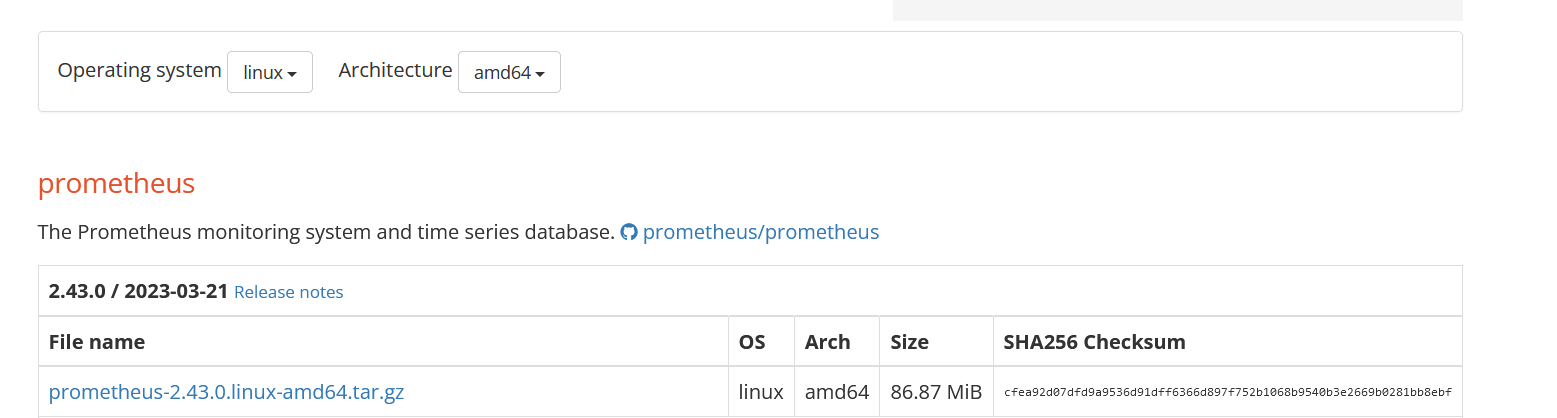
进入官网 : https://prometheus.io/download/
进入下载页面后选择Operating system为Linux,Architecture为amd64后选择
prometheus node_exporter进行下载下载

2.部署被监控端组件
2.1下载完成后将node_exporter-1.5.0.linux-amd64.tar安装包上传到需要监控的主机wss上的任意目录进行解压
[root@wss ~]# rz -E
rz waiting to receive.
[root@wss ~]# ls
\  anaconda-ks.cfg  node_exporter-1.5.0.linux-amd64.tar.gz
[root@wss ~]# mkdir -p /usr/share/node
[root@wss ~]# tar -xzvf node_exporter-1.5.0.linux-amd64.tar.gz -C /usr/share/node
[root@wss node]# ls
node_exporter-1.5.0.linux-amd64
2.2解压完成之后进入到解压后的文件夹中使用nohup命令进行后台启动脚本
[root@wss node]# cd node_exporter-1.5.0.linux-amd64/
[root@wss node_exporter-1.5.0.linux-amd64]# nohup ./node_exporter &
[1] 2549
2.3查看nohup.out 日志文件,出现下图的情况则认为启用成功
[root@wss node_exporter-1.5.0.linux-amd64]# cat nohup.out

3.部署Prometheus
3.1将prometheus-2.43.0.linux-amd64.tar安装包上传到监控主机xkf上的任意目录进行解压
[root@xkf ~]# systemctl stop firewalld.service
[root@xkf ~]# setenforce 0
[root@xkf ~]# rz -E
rz waiting to receive.
[root@xkf ~]# ls
\  anaconda-ks.cfg  prometheus-2.43.0.linux-amd64.tar.gz
[root@xkf ~]# mkdir -p /usr/share/prome
[root@xkf ~]# tar -xzvf prometheus-2.43.0.linux-amd64.tar.gz -C /usr/share/prome/
3.2##进入到解压后的文件夹中,找到prometheus.yml 文件,进入修改
[root@xkf prome]# cd /usr/share/prome/prometheus-2.43.0.linux-amd64/
[root@xkf prometheus-2.43.0.linux-amd64]# ls
console_libraries  consoles  LICENSE  NOTICE  prometheus  prometheus.yml  promtool
[root@xkf prometheus-2.43.0.linux-amd64]# vim prometheus.yml
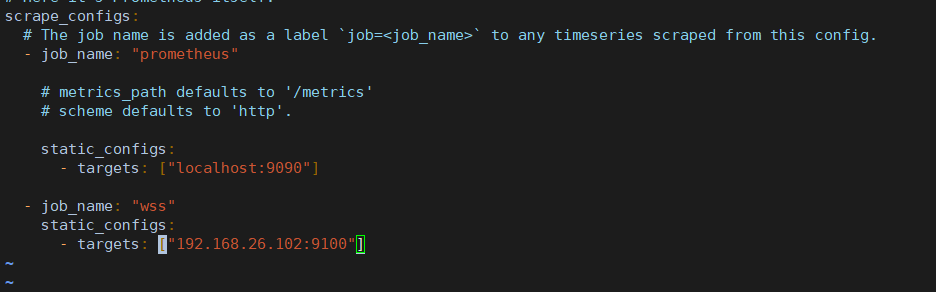
3.3在 scrape_configs 配置项下添加 Linux 监控的 job,其中IP 修改为上面部署wss机器的 ip,端口号为 9100,注意缩进(yaml文件是严格按照缩进的)
- job_name: 'wss'
   static_configs:
   - targets: [192.168.26.102:9100]
3.4##保存配置文件后运行 nohup ./prometheus & 进行启动prometheus
 [root@xkf prometheus-2.43.0.linux-amd64]# nohup ./prometheus &

[1] 6148
[root@xkf prometheus-2.43.0.linux-amd64]# nohup: ignoring input and appending output to ‘nohup.out’
3.5##检查nohup.out日志文件,如果有以下信息则说明启动成功msg="Server is ready to receive web requests."
[root@xkf prometheus-2.43.0.linux-amd64]# cat nohup.out

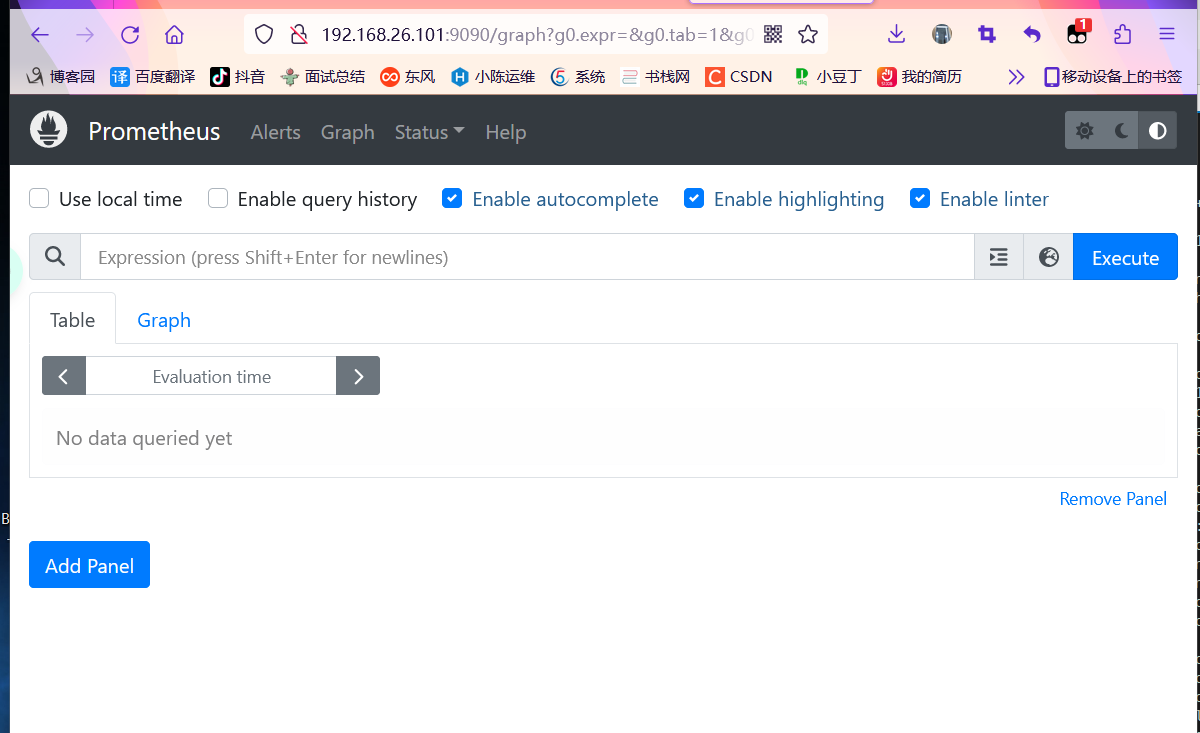
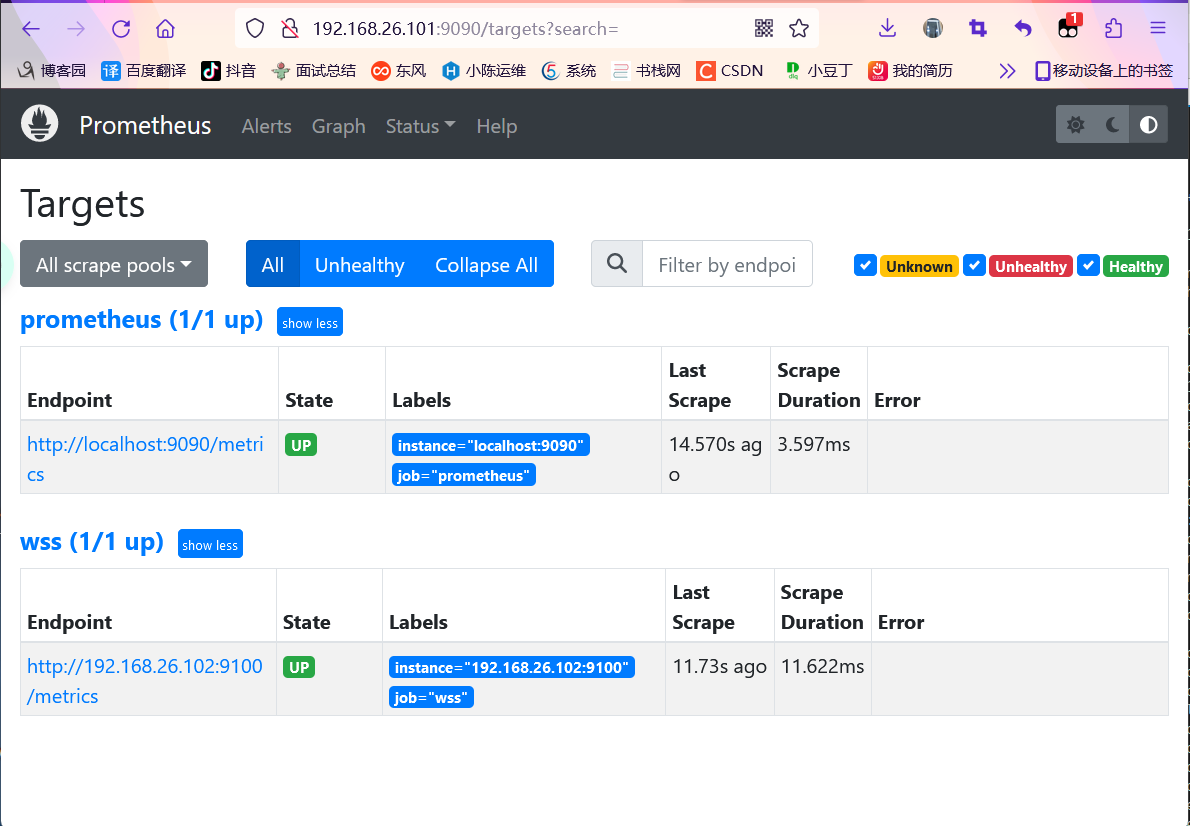
3.6##在浏览器中访问所部署的prometheus:http://ip:9090,查看是否可以访问
3.7##点击菜单status中的Targets查看是否有wss节点,并state是否为up
4.部署grafana(注意:Grafana必须得和Prometheus部署在同一个机器上)
4.1、下载安装包
官网下载地址:https://grafana.com/grafana/download/7.4.5?platform=linux
[root@xkf ~]# wget https://dl.grafana.com/enterprise/release/grafana-enterprise-7.4.5-1.x86_64.rpm
[root@xkf ~]# yum install grafana-enterprise-7.4.5-1.x86_64.rp
4.2、安装完成之后使用命令:systemctl start grafana-server 进行启动grafana
[root@xkf ~]# systemctl start grafana-server
4.3、在浏览器中访问grafana:http://ip:3000(默认账号密码为admin)
4.3.1

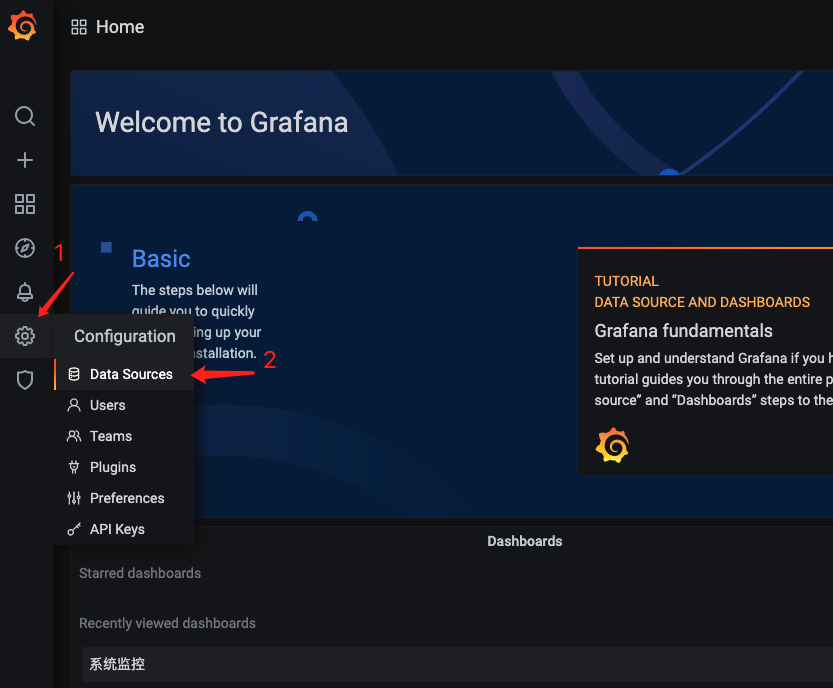
4.3.2add添加 点select

写普罗米修斯的IP和端口号

点击左下角的save & Test按钮,如果提示success,就代表配置成功,然后点击Back返回
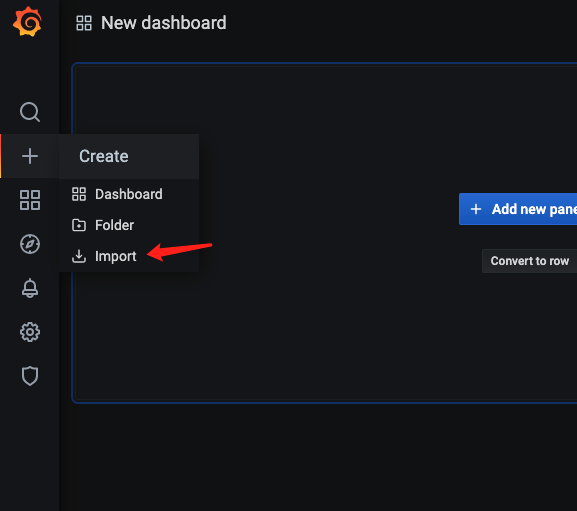
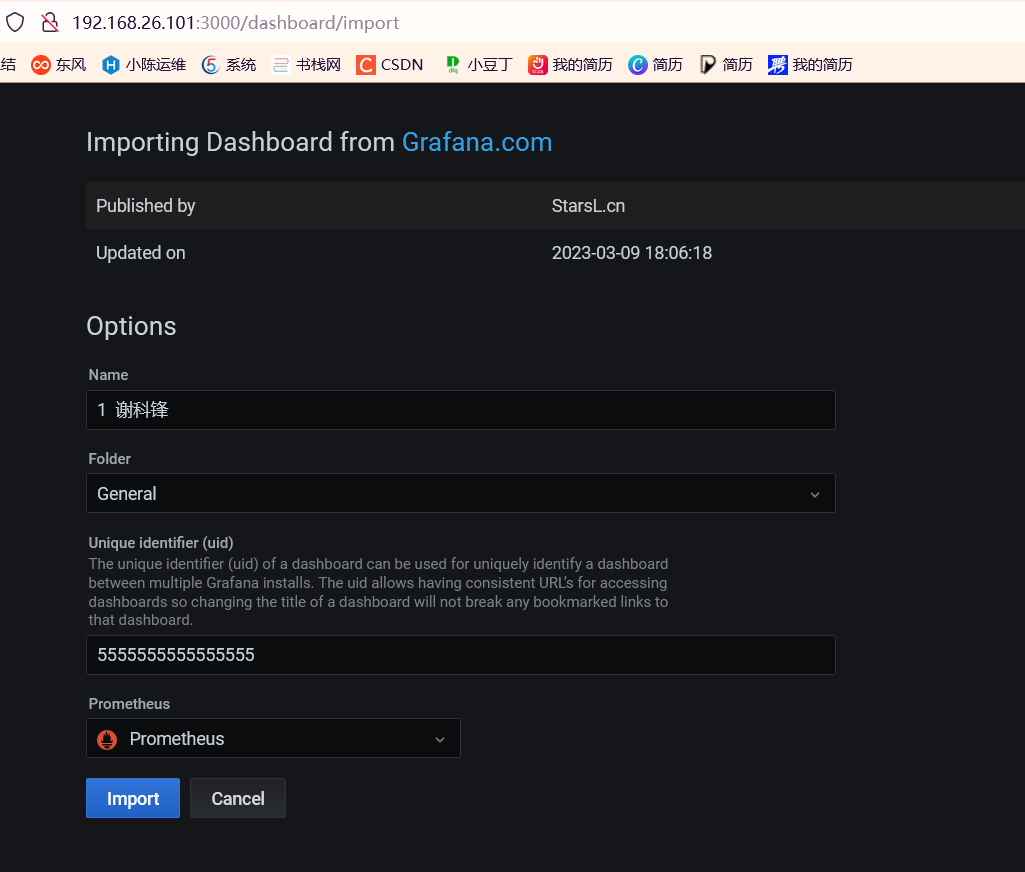
4.3.3##导入监控模版
这里填写监控模板ID(8919)然后点击Load按钮

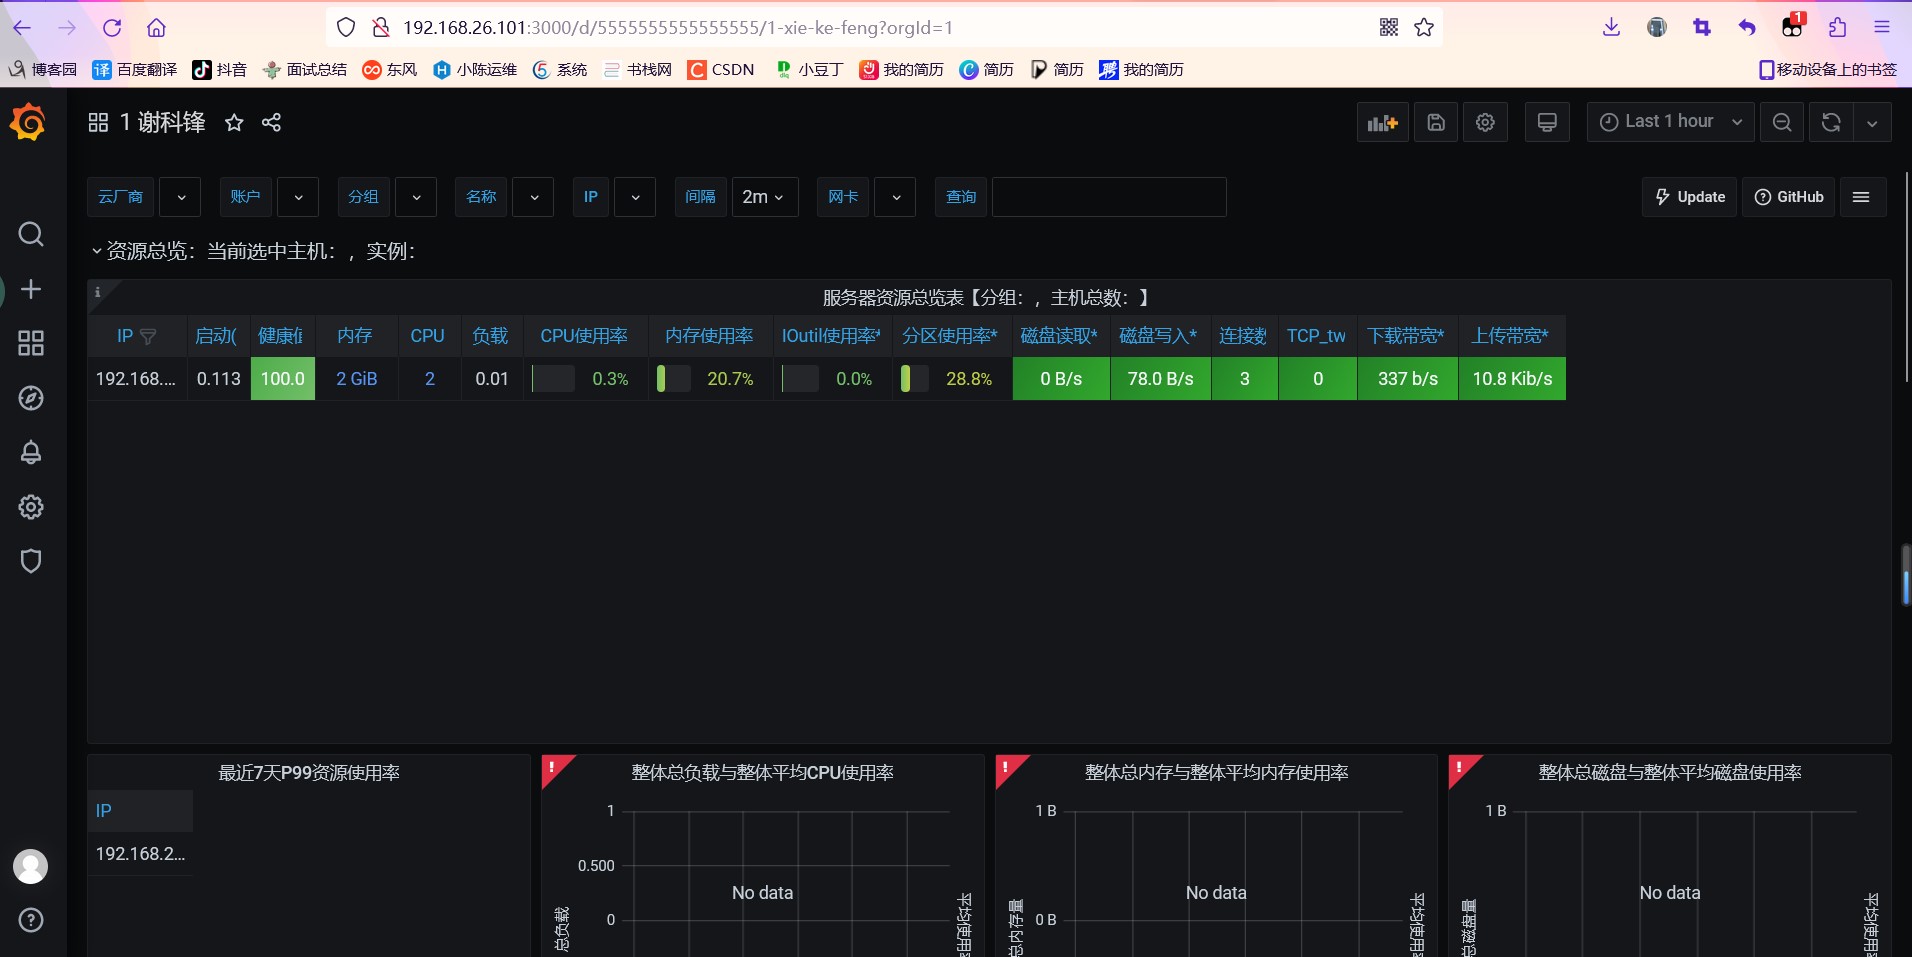
5.grafana可视化