一.项目背景
深航电企业评价评级系统EERS是一款企业绩效评价平台,旨在为企业提供科学、全面、精准的绩效评价服务,帮助企业发现问题、改进管理,提高整体绩效。
EERS评级系统借助大数据、云计算、人工智能等现代技术手段,将企业绩效数据进行多维度、系统化、动态化分析,为企业提供可视化的评级结果,帮助企业管理者直观了解企业的优势与不足,找到关键问题,制定科学的改进策略。
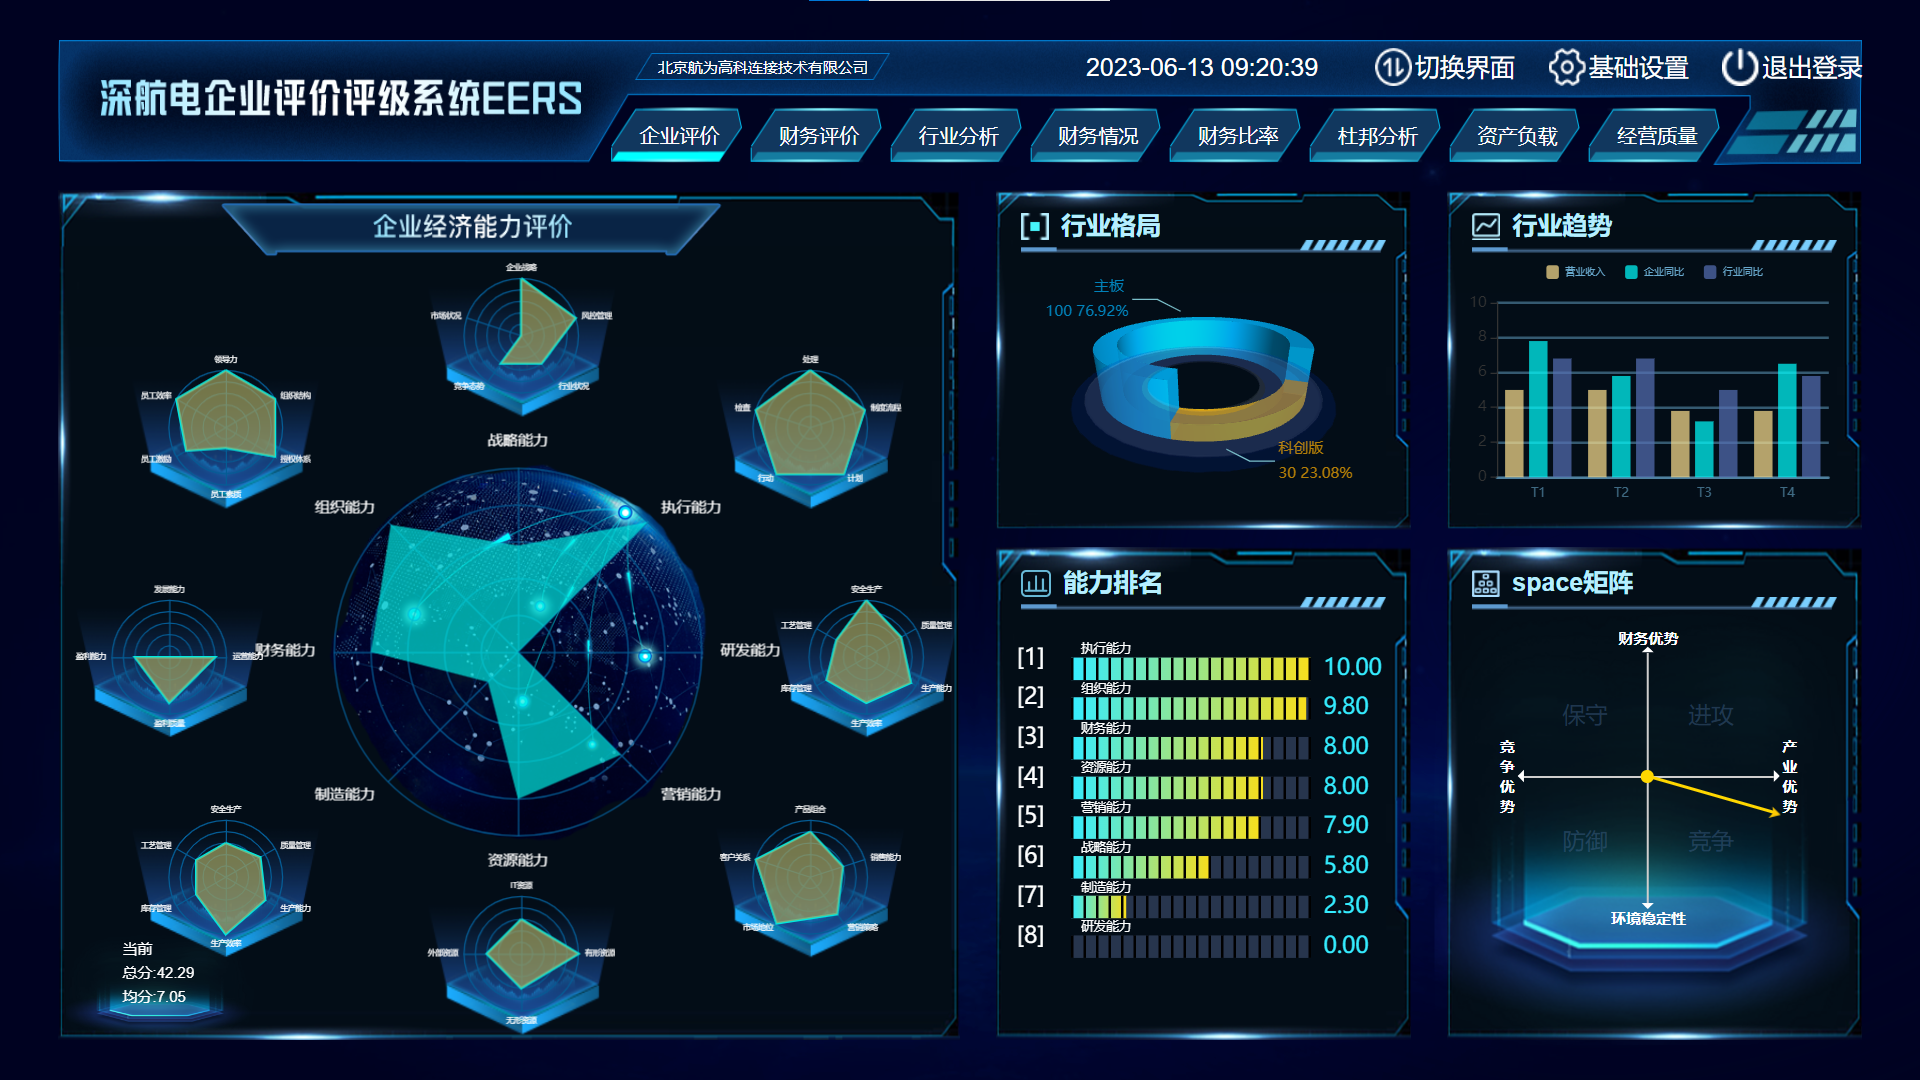
本项目旨在为EERS评级系统开发一套可视化界面,通过图表、雷达图等直观的数据展示方式,呈现企业绩效评价结果,让用户能够更为直观地了解企业的绩效表现,并及时作出应对措施,从而实现企业的长远发展目标。
二.项目开发意义
深航电企业评价评级系统EERS可视化项目的开发意义在于帮助深航电企业更加全面、直观地了解企业的运营情况,提高企业管理水平,优化经营决策,提高企业的竞争力和发展潜力。具体包括以下几个方面:
1. 提高数据的可视化程度:EERS可视化项目将海量的企业数据通过图表、报表、图形等方式呈现,帮助企业决策者快速全面地把握企业的运营情况,更好地发现问题,制定合适的调整方案。
2. 实现即时监控:EERS可视化项目具有实时监控功能,可以及时汇总和反馈企业数据,让企业决策者在第一时间得到数据的变化,根据变化及时做出反应,优化企业经营管理。
3. 提高数据价值:EERS可视化项目通过对数据的深入分析和挖掘,发现企业发展的优势和劣势,制定更加科学合理的经营计划和管理策略,提高数据价值,为企业的发展提供有力支持。
4. 提高企业竞争力:EERS可视化项目的开发可以提高企业的管理水平,优化经营决策,提高企业的竞争力和发展潜力。通过及时准确的数据反馈,帮助企业管理者掌握市场动态,把握发展机遇,快速响应市场变化,提高企业的市场占有率和营销效益。
总之,EERS可视化项目的开发在企业经营管理中具有重要的意义,它可以提高企业的管理水平,提高企业的竞争力和发展潜力,是企业在数据时代中必不可少的一项重要的工具。
三.开发流程
需求分析:确定项目的业务目标和用户需求,制定项目计划与目标。 设计阶段:确定项目的数据来源,设计数据模型,创建原型,确定可视化图表等设计元素。
开发阶段:根据设计阶段的需求创建可视化图表和数据呈现方式,编写程序代码,实现业务逻辑,创建交互式视图。
测试阶段:测试项目的功能、用户体验和数据质量等方面,保证数据准确性和图表展示效果。
上线与维护阶段:将项目部署到生产环境,并对其进行长期的日常维护和更新。
四.技术架构
数据库技术:使用MySQL数据库管理数据。
前端技术:使用HTML、CSS、JavaScript等前端技术实现交互式界面。
可视化图表库:使用ECharts、D3.js等可视化图表库实现图表展示。
五.项目展示--可视化模式
六.项目源码
1.HTML
<!DOCTYPE html>
<html lang="en">
<head>
    <meta charset="UTF-8">
    <meta http-equiv="X-UA-Compatible" content="IE=edge">
    <meta name="viewport" content="width=device-width, initial-scale=1.0">
    <title>数据可视化</title>
    <link rel="icon" href="F:\图片\头像\微信图片_20210813214934.jpg">
    <link rel="stylesheet" href="./css/u-reset.css">
    <link rel="stylesheet" href="./css/index.css">
</head>
<body>
    <!-- 头部 -->
    <div class="top">
        <div class="topleft">
            <img src="../web-study-5.8(数据可视化)/img/toptext_1.png" alt="">
        </div>
        <div class="topright">
            <div class="righttop">
                <div class="righttopleft">
                    北京航为高科连接技术有限公司
                    <!-- <span>北京航为高科连接技术有限公司</span> -->
                </div>
                <div class="date_box"></div>
                <div class="shift_box_1">
                    <div class="shift"></div>
                    <div class="shift_text"><span>切换界面</span></div>
                </div>
                <div class="shift_box_1">
                    <div class="set"></div>
                    <div class="shift_text"><span>基础设置</span></div>
                </div>
                <div class="shift_box_1">
                    <div class="log"></div>
                    <div class="shift_text"><span>退出登录</span></div>
                </div>
            </div>
            <div class="rightbutton">
                <div class="rightbutton_2 active"><span>企业评价</span></div>
                <div class="rightbutton_2"><span>财务评价</span></div>
                <div class="rightbutton_2"><span>行业分析</span></div>
                <div class="rightbutton_2"><span>财务情况</span></div>
                <div class="rightbutton_2"><span>财务比率</span></div>
                <div class="rightbutton_2"><span>杜邦分析</span></div>
                <div class="rightbutton_2"><span>资产负载</span></div>
                <div class="rightbutton_2"><span>经营质量</span></div>
            </div>
        </div>
    </div>

     <!-- 内容 -->
     <div class="content">

        <!-- 左 -->
        <div class="left">
            <div class="blt"></div>
            <div class="blb">
                <div id="blb_0" class="radar_main"></div>
                <div id="blb_1" class="radar"></div>
                <div id="blb_2" class="radar"></div>
                <div id="blb_3" class="radar"></div>
                <div id="blb_4" class="radar"></div>
                <div id="blb_5" class="radar"></div>
                <div id="blb_6" class="radar"></div>
                <div id="blb_7" class="radar"></div>
                <div id="blb_8" class="radar"></div>
                <div class="wz">
                    <ul>
                        <li>当前</li>
                        <li>总分:42.29</li>
                        <li>均分:7.05</li>
                    </ul>
                </div>
            </div>
        </div>


        <!-- 中 -->
        <div class="mid">
            <div class="contenttop">
                <div class="ctt">
                    <div class="logo_1">
                        <img src="../web-study-5.8(数据可视化)/img/1.png" alt="">
                        <b>行业格局</b>
                    </div>
                    <div class="logo"></div>
                </div>
                <div class="ctb" id="ctb_2"></div>


            </div>
            <div class="contentbutton">
                <div class="ctt">
                    <div class="logo_1">
                        <img src="../web-study-5.8(数据可视化)/img/3.png" alt="">
                        <b>能力排名</b>
                    </div>
                    <div class="logo"></div>
                </div>
                <div class="cbb" id="cbb_1"></div>
            </div>
        </div>


        <!-- 右 -->
        <div class="right">
            <div class="contenttop">
                <div class="ctt">
                    <div class="logo_1">
                        <img src="../web-study-5.8(数据可视化)/img/2.png" alt="">
                        <b>行业趋势</b>
                    </div>
                    <div class="logo"></div>
                </div>
                <div class="ctb" id="ctb_1"></div>
            </div>


            <div class="contentbutton">
                <div class="ctt">
                    <div class="logo_1">
                        <img src="../web-study-5.8(数据可视化)/img/4.png" alt="">
                        <b>space矩阵</b>
                    </div>
                    <div class="logo"></div>
                </div>
                <div class="cbb" id="cbb_2">
                    <div class="_li">
                        <img src="./img/u.png" alt="" class="t">
                        <img src="./img/d.png" alt="" class="b">
                        <img src="./img/z.png" alt="" class="l">
                        <img src="./img/y.png" alt="" class="r">
                        <div class="lt"><span>保守</span></div>
                        <div class="rt"><span>进攻</span></div>
                        <div class="lb"><span>防御</span></div>
                        <div class="rb"><span>竞争</span></div>
                        <b class="sr">产业优势</b>
                        <b class="st">财务优势</b>
                        <b class="sl">竞争优势</b>
                        <b class="sb">环境稳定性</b>
                        <div class="dot"></div>
                        <div class="line"></div>
                        <img src="./img/gold.png" alt="" class="gol">
                    </div>

                </div>
            </div>
        </div>


    </div>
    <script src="./js/echarts4.min.js"></script>
    <script src="./js/echarts-gl.min.js"></script>
    <script src="./js/index.js"></script>
</body>
</html >
2.CSS
html{
    width: 100%;
    height: 100%;
    min-width: 1024px;
    overflow-y: hidden;
}
body{
    width: 100%;
    height: 100%;
    background-image: url(../img/bg.png);
    background-repeat: no-repeat;
    background-size: cover;
    padding: 32px 3% 32px 3%;
    box-sizing: border-box;
}
.top{
    width: 100%;
    height: 100px;
    background-image: url(../img/top.png);
    background-size: 100% 100%;
    display: flex;
    flex-direction:row;
}
.content{
    width: 100%;
    height: calc(100vh - 184px);
    margin-top: 20px;
}
.left{
    width: 50%;
    height: 100%;
    background-image: url(../img/left.png);
    background-size: 100% 100%;
    float: left;
    display: flex;
    flex-direction:column;
    justify-content:space-between;
}
.mid{
    width:23%;
    height: 100%;
    float: left;
    margin-left:2%;
    display: flex;
    flex-direction:column;
    justify-content:space-between;

}
.right{
    width:23%;
    height: 100%;
    float: right;
    display: flex;
    flex-direction:column;
    justify-content:space-between;
}
.contenttop{
    width: 100%;
    height: 40%;
    background-image: url(../img/connecttop.png);
    background-size: 100% 100%;

}
.contentbutton{
    width: 100%;
    height: 58%;
    background-image: url(../img/connectbutton.png);
    background-size: 100% 100%;
}
.topleft{
    width: 29.5%;
    height: 100%;
    margin-left: 1%;
}
.topleft img{
    width: 100%;
    height: 30%;
    background-size: 100% 100%;
    margin-top: 8%;
    margin-left: 5%;
}
.topright{
    width: 80%;
    height: 100%;
}
.righttop{
    width: 100%;
    height: 43%;
    display: flex;
}
.rightbutton{
    width: 100%;
    height: 60%;
    margin-left: 3.5%;
}
.righttopleft{
    width: 22%;
    height: 50%;
    background-size: 100% 100%;
    background-repeat: no-repeat;
    background-image: url(../img/rectangle.png);
    margin-top: 1%;
    margin-left: 6%;
    color: #fff;
    font-size: 15%;
    text-align: center;
    line-height: 200%;
}
.righttopleft span{
    margin-left: 8%;
    color: #fff;
    font-size: 12px;
}
.date_box{
    width: 230px;
    height: 30px;
    color: #fff;
    font-size: 20px;
    margin-left: 15%;
    margin-top: 1%;
}
.shift_box_1{
    width: 15%;
    height: 100%;
    display: flex;
    align-items:center;
    justify-content:flex-end;
}
.shift{
    width: 30px;
    height: 70%;
    background-image: url(../img/shift.png);
    background-repeat: no-repeat;
    background-size: 100% 100%;
}
.shift_text span{
    width: 100%;
    height: 100%;
    color: #fff;
    font-size: 20px;
    margin-left: 2px;
}
.set{
    width: 30px;
    height: 70%;
    background-image: url(../img/set.png);
    background-repeat: no-repeat;
    background-size: 100% 100%;
}
.log{
    width: 30px;
    height: 70%;
    background-image: url(../img/log.png);
    background-repeat: no-repeat;
    background-size: 100% 100%;
}
/* .rightbutton_1{
    width: 10.1%;
    height: 75%;
    float: left;
    background-image: url(../img/leftbutton_1.png);
    background-repeat: no-repeat;
    margin-left: 1.5%;
    margin-top: 1%;
    background-size:100% 100%;
    display: flex;
    flex-direction:column;
    justify-content:center;
} */
.rightbutton_2{
    width: 10.1%;
    height: 75%;
    float: left;
    background-image: url(../img/leftbutton_2.png);
    background-repeat: no-repeat;
    margin-left: 0.6%;
    margin-top: 1%;
    background-size:100% 100%;
    display: flex;
    flex-direction:column;
    justify-content:center;
}
.rightbutton_1 span{
    color: #fff;
    margin-left: 22%;
    cursor: pointer;
}
.rightbutton_2 span{
    color: #fff;
    margin-left: 22%;
    cursor: pointer;
}
.blt{
    width: 22%;
    height: 3%;
    margin-left: 35%;
    margin-top: 2.6%;
    background-image: url(../img/blt.png);
    background-repeat: no-repeat;
    background-size: 100% 100%;
}
.rightbutton_1:hover{
    background-image: url(../img/leftbutton_1.png);
}
.rightbutton_2:hover{
    background-image: url(../img/leftbutton_1.png);
}
.blb{
    width: 100%;
    height: 90%;
    margin-left: 7px;
    margin-bottom: 0.6%;
    position: relative;
}
.ctt{
    width: 100%;
    height: 50px;
    padding: 0 20px;
    box-sizing: border-box;
}
.logo{
    width: 100%;
    height: 10px;
    background-image: url(../img/link.png);
    background-repeat: no-repeat;
    background-size: 100% 100%;
}
.logo_1{
    width: 100%;
    height: 40px;
    display: flex;
}
.logo_1 img{
    margin-top: 18px;
}
.logo_1 b{
    color:#b6eefe;
    font-size: 20px;
    margin-top: 14px;
    margin-left: 10px;
}
.ctb{
    width: 100%;
    height:90%;
    margin-top: 5px;
}
.cbb{
    width: 100%;
    height: 88%;
    margin-top: 1px;
    display: flex;
    justify-content: center;
    align-items: center;
    position: relative;
}
.active{
    background-image: url(../img/leftbutton_1.png);
}
#cbb_1{
    margin-top: -25px;
}
#cbb_2{
    background-image:url(../img/space.png) ;
    background-position: center;
    transform: translateX(-10px);
}
._li{
    width: 200px;
    height: 200px;
    transform: translate(5px,-40px);
    position: relative;
}
.lt{
    width: 100px;
    height: 100px;
    border-bottom:2px solid #cfcecd;
    border-right:2px solid #cfcecd;
    box-sizing: border-box;
    float: left;
    display: flex;
    align-items: center;
    justify-content: center;
}
.rt{
    width: 100px;
    height: 100px;
    border-bottom:2px solid #cfcecd;
    box-sizing: border-box;
    float: left;
    display: flex;
    align-items: center;
    justify-content: center;
}
.lb{
    width: 100px;
    height: 100px;
    border-right:2px solid #cfcecd;
    box-sizing: border-box;
    float: left;
    display: flex;
    align-items: center;
    justify-content: center;
}
.rb{
    width: 100px;
    height: 100px;
    float: left;
    display: flex;
    align-items: center;
    justify-content: center;
}
._li span{
    font-size: 18px;
    color: rgba(73, 108, 151, 0.4);
}
._li img{
    width: 11px;
    position: absolute;
}
.t{
    left: 94px;
    top: -8px;
}
.l{
    top: 93px;
    left: -8px;
}
.b{
    left: 94px;
    bottom: -8px;
}
.r{
    top: 93px;
    right: -8px;
}
.cbb b{
    position: absolute;
    font-size: 12px;
    color: #fff;
}
.sr{
    left: 207px;
    top: 67px;
}
.sl{
    right: 207px;
    top: 67px;
}
.st{
    left: 76px;
    top: -20px;
}
.sb{
    left: 70px;
    bottom: -20px;

}
.dot{
    width: 10px;
    height: 10px;
    position: absolute;
    background-color: gold;
    border-radius: 50%;
    left: 94px;
    top: 94px;
}
.line{
    width: 2px;
    height: 105px;
    background-color: gold;
    position: absolute;
    left: 99px;
    top: -6px;
    transform-origin: bottom;
    transform: rotate(106deg);
}
.gol{
    position: absolute;
    width: 10px;
    left: 195px;
    top: 123px;
}
.radar_main{
    width: 420px;
    height: 420px;
    position: absolute;
    top: 50%;
    left: 50%;
    transform: translate(-50%,-50%);
    /* border-radius: 50%; */
    background-image: url(../img/earth.png);
    background-position: center;
    background-repeat: no-repeat;
    background-size: 72% 72%;
}
.radar{
    width: 150px;
    height: 130px;
    position: absolute;
    /* border-radius: 50%; */
    background-image: url(../img/001.png);
    background-repeat: no-repeat;
    background-size: 100% 80%;
    background-position: bottom;
}
#blb_1{
    position: absolute;
    left: 1%;
    top: 40%;
}
#blb_5{
    position: absolute;
    right:1%;
    top: 40%;
}
#blb_3{
    position: absolute;
    left: 40%;
    top: -2%;
}
#blb_7{
    position: absolute;
    left: 40%;
    bottom: 0%;
}
#blb_4{
    position: absolute;
    left: 72%;
    top: 10%;
}
#blb_2{
    position: absolute;
    right: 72%;
    top: 10%;
}
#blb_6{
    position: absolute;
    left: 72%;
    bottom: 10%;
}
#blb_8{
    position: absolute;
    right: 72%;
    bottom: 10%;
}
.wz{
    width: 150px;
    height: 80px;
    position: absolute;
    bottom: 0px;
    background-image: url(../img/002.png);
    background-repeat: no-repeat;
    background-size: 100% 100%;
    background-position: left;
}
.wz li{
    color: #fff;
    font-size: 12px;
    margin-left: 45px;
    margin-top: 3px;
}
3.JS
//时间 var date_box = document.querySelector(".date_box") var time = function () { var date = new Date(); var y = date.getFullYear(); var m = date.getMonth() + 1; var d = date.getDate(); var h = date.getHours(); var mi = date.getMinutes(); var s = date.getSeconds(); m = m < 10 ? "0" + m : m; d = d < 10 ? "0" + d : d; h = h < 10 ? "0" + h : h; mi = mi < 10 ? "0" + mi : mi; s = s < 10 ? "0" + s : s; date_box.innerHTML = `${y}-${m}-${d} ${h}:${mi}:${s}` } time(); setInterval(time, 1000); //点击事件 let list = document.querySelectorAll(".rightbutton_2"); console.log(list); for (let i = 0; i < list.length; i++) { list[i].onclick = function () { for (let j = 0; j < list.length; j++) { // list[j].style.backgroundImage="url(../web-study-5.8(数据可视化)/img/leftbutton_2.png)" list[j].classList.remove("active") } // list[i].style.backgroundImage="url(../web-study-5.8(数据可视化)/img/leftbutton_1.png)" list[i].classList.add("active") } } //行业趋势图表 function get_ctb_1() { var MyChart = echarts.init(document.querySelector("#ctb_1")) var option = { color: ['rgba(255,225,143,0.7)', 'rgba(0,255,255,0.7)', 'rgba(85,111,181,0.7)'], legend: { itemWidth: 10, itemHeight: 11, itemGap: 16, textStyle: { color: "#68a8cc", fontSize: 8, } }, grid: { top: "18%", left: "12%", right: "8%", bottom: "10%" }, tooltip: {}, dataset: { source: [ ['product', '营业收入', '企业同比', '行业同比'], ['T1', 5, 7.8, 6.8], ['T2', 5, 5.8, 6.8], ['T3', 3.8, 3.2, 5], ['T4', 3.8, 6.5, 5.8] ] }, xAxis: { type: 'category', axisTick: { show: false }, axisLine: { lineStyle: { color: "rgba(104,168,204,0.5)", width: 2, } }, axisLabel: { color: "rgba(104,168,204,0.6)", fontSize: 10 } }, yAxis: { min: 0, max: 10, splitLine: { lineStyle: { color: "rgba(104,168,204,0.5)", width: 2 } } }, // Declare several bar series, each will be mapped // to a column of dataset.source by default. series: [{ type: 'bar' }, { type: 'bar' }, { type: 'bar' }] }; MyChart.setOption(option) } get_ctb_1() //行业格局图表 function get_ctb_2() { var MyChart = echarts.init(document.querySelector("#ctb_2")) /************************* pie3D 尝试 更新时间: 2020.7.21 13:30 v0.5 使用组件: grid3D、xAxis3D、yAxis3D、zAxis3D、surface ************************* 【 getParametricEquation 函数说明 】 : ************************* 根据传入的 startRatio(浮点数): 当前扇形起始比例,取值区间 [0, endRatio) endRatio(浮点数): 当前扇形结束比例,取值区间 (startRatio, 1] isSelected(布尔值):是否选中,效果参照二维饼图选中效果(单选) isHovered(布尔值): 是否放大,效果接近二维饼图高亮(放大)效果(未能实现阴影) 生成 3D 扇形曲面 ************************* 【 getPie3D 函数说明 】 : ************************* 根据传入的饼图数据,生成模拟 3D 饼图的配置项 option 饼图数据格式示意: [{ name: '数据1', value: 10 }, { // 数据项名称 name: '数据2', value : 56, itemStyle:{ // 透明度 opacity: 0.5, // 扇形颜色 color: 'green' } }] ************************* 【 鼠标事件监听说明 】 : ************************* click: 实现饼图的选中效果(单选) 大致思路是,通过监听点击事件,获取到被点击数据的系列序号 params.seriesIndex, 然后将对应扇形向外/向内移动 10% 的距离。 mouseover: 近似实现饼图的高亮(放大)效果 大致思路是,在饼图外部套一层透明的圆环,然后监听 mouseover 事件,获取 到对应数据的系列序号 params.seriesIndex 或系列名称 params.seriesName, 如果鼠标移到了扇形上,则先取消高亮之前的扇形(如果有),再高亮当前扇形; 如果鼠标移到了透明圆环上,则只取消高亮之前的扇形(如果有),不做任何高亮。 globalout: 当鼠标移动过快,直接划出图表区域时,有可能监听不到透明圆环的 mouseover, 导致此前高亮没能取消,所以补充了对 globalout 的监听。 *************************/ // 生成扇形的曲面参数方程,用于 series-surface.parametricEquation function getParametricEquation(startRatio, endRatio, isSelected, isHovered, k, height) { // 计算 let midRatio = (startRatio + endRatio) / 2; let startRadian = startRatio * Math.PI * 2; let endRadian = endRatio * Math.PI * 2; let midRadian = midRatio * Math.PI * 2; // 如果只有一个扇形,则不实现选中效果。 if (startRatio === 0 && endRatio === 1) { isSelected = false; } // 通过扇形内径/外径的值,换算出辅助参数 k(默认值 1/3) k = typeof k !== 'undefined' ? k : 1 / 3; // 计算选中效果分别在 x 轴、y 轴方向上的位移(未选中,则位移均为 0) let offsetX = isSelected ? Math.cos(midRadian) * 0.1 : 0; let offsetY = isSelected ? Math.sin(midRadian) * 0.1 : 0; // 计算高亮效果的放大比例(未高亮,则比例为 1) let hoverRate = isHovered ? 1.05 : 1; // 返回曲面参数方程 return { u: { min: -Math.PI, max: Math.PI * 3, step: Math.PI / 32 }, v: { min: 0, max: Math.PI * 2, step: Math.PI / 20 }, x: function (u, v) { if (u < startRadian) { return offsetX + Math.cos(startRadian) * (1 + Math.cos(v) * k) * hoverRate; } if (u > endRadian) { return offsetX + Math.cos(endRadian) * (1 + Math.cos(v) * k) * hoverRate; } return offsetX + Math.cos(u) * (1 + Math.cos(v) * k) * hoverRate; }, y: function (u, v) { if (u < startRadian) { return offsetY + Math.sin(startRadian) * (1 + Math.cos(v) * k) * hoverRate; } if (u > endRadian) { return offsetY + Math.sin(endRadian) * (1 + Math.cos(v) * k) * hoverRate; } return offsetY + Math.sin(u) * (1 + Math.cos(v) * k) * hoverRate; }, z: function (u, v) { if (u < - Math.PI * 0.5) { return Math.sin(u); } if (u > Math.PI * 2.5) { return Math.sin(u); } return Math.sin(v) > 0 ? 1 * height : -1; } }; }; // 生成模拟 3D 饼图的配置项 function getPie3D(pieData, internalDiameterRatio) { let series = []; let sumValue = 0; let startValue = 0; let endValue = 0; let legendData = []; let k = typeof internalDiameterRatio !== 'undefined' ? (1 - internalDiameterRatio) / (1 + internalDiameterRatio) : 1 / 3; // 为每一个饼图数据,生成一个 series-surface 配置 for (let i = 0; i < pieData.length; i++) { sumValue += pieData[i].value; let seriesItem = { name: typeof pieData[i].name === 'undefined' ? `series${i}` : pieData[i].name, type: 'surface', parametric: true, wireframe: { show: false }, pieData: pieData[i], pieStatus: { selected: false, hovered: false, k: k } }; if (typeof pieData[i].itemStyle != 'undefined') { let itemStyle = {}; typeof pieData[i].itemStyle.color != 'undefined' ? itemStyle.color = pieData[i].itemStyle.color : null; typeof pieData[i].itemStyle.opacity != 'undefined' ? itemStyle.opacity = pieData[i].itemStyle.opacity : null; seriesItem.itemStyle = itemStyle; } series.push(seriesItem); } // 使用上一次遍历时,计算出的数据和 sumValue,调用 getParametricEquation 函数, // 向每个 series-surface 传入不同的参数方程 series-surface.parametricEquation,也就是实现每一个扇形。 for (let i = 0; i < series.length; i++) { endValue = startValue + series[i].pieData.value; console.log(series[i]); series[i].pieData.startRatio = startValue / sumValue; series[i].pieData.endRatio = endValue / sumValue; series[i].parametricEquation = getParametricEquation(series[i].pieData.startRatio, series[i].pieData.endRatio, false, false, k, series[i].pieData.value); startValue = endValue; legendData.push(series[i].name); } // // 补充一个透明的圆环,用于支撑高亮功能的近似实现。 series.push({ name: 'mouseoutSeries', type: 'surface', parametric: true, wireframe: { show: false, }, itemStyle: { opacity: 0.1, color: '#E1E8EC', }, parametricEquation: { u: { min: 0, max: Math.PI * 2, step: Math.PI / 20, }, v: { min: 0, max: Math.PI, step: Math.PI / 20, }, x: function (u, v) { return ((Math.sin(v) * Math.sin(u) + Math.sin(u)) / Math.PI) * 2; }, y: function (u, v) { return ((Math.sin(v) * Math.cos(u) + Math.cos(u)) / Math.PI) * 2; }, z: function (u, v) { return Math.cos(v) > 0 ? -0.5 : -5; }, }, }); // // 补充一个透明的圆环,用于支撑高亮功能的近似实现。 series.push({ name: 'mouseoutSeries', type: 'surface', parametric: true, wireframe: { show: false, }, itemStyle: { opacity: 0.1, color: '#000d36', }, parametricEquation: { u: { min: 0, max: Math.PI * 2, step: Math.PI / 20, }, v: { min: 0, max: Math.PI, step: Math.PI / 20, }, x: function (u, v) { return ((Math.sin(v) * Math.sin(u) + Math.sin(u)) / Math.PI) * 2; }, y: function (u, v) { return ((Math.sin(v) * Math.cos(u) + Math.cos(u)) / Math.PI) * 2; }, z: function (u, v) { return Math.cos(v) > 0 ? -5 : -7; }, }, }); series.push({ name: 'mouseoutSeries', type: 'surface', parametric: true, wireframe: { show: false, }, itemStyle: { opacity: 0.1, color: '#0030b8', }, parametricEquation: { u: { min: 0, max: Math.PI * 2, step: Math.PI / 20, }, v: { min: 0, max: Math.PI, step: Math.PI / 20, }, x: function (u, v) { return ((Math.sin(v) * Math.sin(u) + Math.sin(u)) / Math.PI) * 2.2; }, y: function (u, v) { return ((Math.sin(v) * Math.cos(u) + Math.cos(u)) / Math.PI) * 2.2; }, z: function (u, v) { return Math.cos(v) > 0 ? -7 : -7; }, }, }); return series; } // 传入数据生成 option const optionsData = [ { name: '主板', value: 100, itemStyle: { // opacity: 0.5, color: 'rgba(0,180,255,0.7)', }, }, { name: '科创版', value: 30, itemStyle: { // opacity: 0.5, color: 'rgba(255,174,0,0.7)', }, }, ]; const series = getPie3D(optionsData, 0.8, 240, 28, 26, 0.5); series.push({ name: 'pie2d', type: 'pie', label: { opacity: 1, fontSize: 13, lineHeight: 20, textStyle: { fontSize: 12, }, }, labelLine: { length: 10, length2: 20, }, startAngle: -30, //起始角度,支持范围[0, 360]。 clockwise: false, //饼图的扇区是否是顺时针排布。上述这两项配置主要是为了对齐3d的样式 radius: ['25%', '60%'], center: ['50%', '50%'], data: optionsData, itemStyle: { opacity: 0, }, }); // 准备待返回的配置项,把准备好的 legendData、series 传入。 option = { animation: true, tooltip: { formatter: params => { if (params.seriesName !== 'mouseoutSeries' && params.seriesName !== 'pie2d') { return `${params.seriesName}<br/><span style="display:inline-block;margin-right:5px;border-radius:10px;width:10px;height:10px;background-color:${params.color};"></span>${option.series[params.seriesIndex].pieData.value + '辆'}`; } }, textStyle: { fontSize: 16 }, }, title: { x: 'center', top: '20', textStyle: { color: '#fff', fontSize: 22, }, }, // backgroundColor: '#333', labelLine: { show: true, lineStyle: { color: '#7BC0CB', }, }, label: { show: true, position: 'outside', formatter: '{b} \n{c} {d}%', }, xAxis3D: { min: -1, max: 1, }, yAxis3D: { min: -1, max: 1, }, zAxis3D: { min: -1, max: 1, }, grid3D: { show: false, boxHeight: 0.5, //top: '30%', bottom: '50%', // environment: '#021041', viewControl: { distance: 150, alpha: 25, beta: 20, autoRotate: false, // 自动旋转 }, }, series: series, }; MyChart.setOption(option) } get_ctb_2() //雷达图 function get_radar_main() { var MyChart = echarts.init(document.querySelector(".radar_main")) var option = { // backgroundColor: '#0A2E5D', "normal": { "top": 200, "left": 300, "width": 500, "height": 400, "zIndex": 6, "backgroundColor": "" }, "color": ["rgba(245, 166, 35, 1)", "rgba(19, 173, 255, 1)"], "title": { "show": true, // "text": "学生行为习惯分析", "left": "40%", "top": "1%", "textStyle": { "fontSize": 18, "color": "#fff", "fontStyle": "normal", "fontWeight": "normal" } }, "tooltip": { "show": true, "trigger": "item" }, "legend": { "show": true, "icon": "circle", "left": "35%", "top": "90%", "orient": "horizontal", "textStyle": { "fontSize": 14, "color": "#fff" }, // "data": ["高一(1)班", "高一(2)班"] }, "radar": { "center": ["50%", "50%"], "radius": "70%", "startAngle": 90, "splitNumber": 5, "shape": "circle", "splitArea": { "areaStyle": { "color": ["transparent"] } }, "axisLabel": { "show": false, "fontSize": 18, "color": "#fff", "fontStyle": "normal", "fontWeight": "normal" }, "axisLine": { "show": true, "lineStyle": { "color": "#045c95 "// } }, "splitLine": { "show": true, "lineStyle": { "color": "#045c95"// } }, "indicator": [{ "color": "#fff", "name": "战略能力", "max": 10 }, { "color": "#fff", "name": "组织能力", "max": 10 }, { "color": "#fff", "name": "财务能力", "max": 10 }, { "color": "#fff", "name": "制造能力", "max": 10 }, { "color": "#fff", "name": "资源能力", "max": 10 }, { "color": "#fff", "name": "营销能力", "max": 10 }, { "color": "#fff", "name": "研发能力", "max": 10 }, { "color": "#fff", "name": "执行能力", "max": 10 }] }, "series": { "name": "企业经济能力评价", "type": "radar", "symbol": "circle", "symbolSize": 0, // "itemStyle": { // "normal": { // color:'rgba(19, 173, 255, 1)', // "borderColor": "rgba(19, 173, 255, 0.4)", // "borderWidth": 10 // } // }, "areaStyle": { "normal": { "color": "rgba(1, 232, 223, 1)" } }, "lineStyle": { "normal": { "color": "rgba(1, 232, 223, 0)", "width": 2, "type": "dashed" } }, "data": [ [5.8, 9.8, 8, 2.3, 8, 7.9, 0, 10] ] } }; MyChart.setOption(option) } get_radar_main() //能力排名 function get_bbb_1() { var MyChart = echarts.init(document.querySelector("#cbb_1")) let category = [ { name: "研发能力", value: 0 + ".00", }, { name: "制造能力", value: 2.3 + "0", }, // { // name: "营销能力", // value: 7.9+"0", // }, // { // name: "组织能力", // value: 9.8+"0", // }, // { // name: "执行能力", // value: 10+".00", // }, // { // name: "财务能力", // value: 8+".00", // }, { name: "战略能力", value: 5.8 + "0", }, { name: "营销能力", value: 7.9 + "0", }, { name: "资源能力", value: 8 + ".00", }, { name: "财务能力", value: 8 + ".00", }, { name: "组织能力", value: 9.8 + "0", }, { name: "执行能力", value: 10 + ".00", }, ]; let yName = []; // y轴名称 let bgData = []; // 最大值用作背景显示的数据 let maxValue = category[category.length - 1].value; //最大值 category.forEach((element) => { yName.push(element.name); bgData.push({ name: element.name, value: maxValue, type: element.type, }); }); var option = { // backgroundColor: '#000', xAxis: { max: maxValue, splitLine: { show: false, }, axisLine: { show: false, }, axisLabel: { show: false, }, axisTick: { show: false, }, }, grid: { left: 60, top: 20, right: 80, bottom: 0, }, yAxis: [ { // 每条图形上面的文字 inverse: false, data: yName, axisLabel: { padding: [-10, 0, 20, 0], inside: true, textStyle: { fontSize: 10, fontWeight: 400, color: "#feffff", align: "left", }, formatter: "{value}", rich: { a: { color: "transparent", lineHeight: 20, fontSize: 14, shadowColor: "rgba(0, 0, 0, 1)", shadowBlur: 10, }, }, }, splitLine: { show: false, }, axisTick: { show: false, }, axisLine: { show: false, }, }, { // y轴最左侧的文字 axisTick: "none", axisLine: "none", position: "left", axisLabel: { padding: [-3, 13, 13, 10], // 调整文字位置 textStyle: { color: "#feffff", fontSize: "18", fontWeight: "400", }, }, data: ["[8]", "[7]", "[6]", "[5]", "[4]", "[3]", "[2]", "[1]"], }, { // y轴最右侧的文字 axisTick: "none", axisLine: "none", type: "category", axisLabel: { margin: 10, textStyle: { color: "#34ecff", fontSize: "18", }, }, data: category, }, ], series: [ { // 背景样式 name: "背景", type: "bar", barWidth: 18, stack: "总量", barGap: "-100%", symbol: "fixed", symbolRepeat: "repeat", legendHoverLink: false, itemStyle: { normal: { color: "rgba(75, 93, 132, 0.5)", }, }, data: bgData, animation: false, //关闭动画 z: 0, }, { name: "info", // 内(显示的内容) type: "bar", barGap: "-100%", barWidth: 18, legendHoverLink: false, silent: true, itemStyle: { normal: { color: function (params) { console.log(params.dataIndex); var color; if (params.dataIndex % 2 != 0) { color = { type: "linear", x: 0, y: 0, x2: 1, y2: 0, colorStops: [ { offset: 0, color: "#34ecff", // 0% 处的颜色 }, { offset: 1, color: "rgba(248,222,28,1)", // 100% 处的颜色 }, ], }; } else { color = { type: "linear", x: 0, y: 0, x2: 1, y2: 0, colorStops: [ { offset: 0, color: "#34ecff", // 0% 处的颜色 }, { offset: 1, color: "rgba(248,222,28,1)", // 100% 处的颜色 }, ], }; } return color; }, }, }, data: category, z: 1, animationEasing: "elasticOut", }, { // 分隔 type: "pictorialBar", itemStyle: { normal: { color: "rgba(0,0,0,1)", }, }, symbolRepeat: "fixed", symbolMargin: 4, symbol: "rect", symbolClip: true, symbolSize: [2, 18], symbolPosition: "start", symbolOffset: [0, 0], symbolBoundingData: maxValue, data: bgData, animation: false, //关闭动画 z: 2, }, ], }; MyChart.setOption(option) } get_bbb_1() //小雷达图 function get_radar_3() { var MyChart = echarts.init(document.querySelector("#blb_3")); var option = { // backgroundColor: '#0A2E5D', "normal": { "top": 200, "left": 300, "width": 500, "height": 400, "zIndex": 6, "backgroundColor": "" }, "color": ["rgba(245, 166, 35, 1)", "rgba(19, 173, 255, 1)"], "title": { "show": true, // "text": "学生行为习惯分析", "left": "40%", "top": "1%", "textStyle": { "fontSize": 18, "color": "#fff", "fontStyle": "normal", "fontWeight": "normal" } }, "tooltip": { "show": true, "trigger": "item" }, "legend": { "show": true, "icon": "circle", "left": "35%", "top": "90%", "orient": "horizontal", "textStyle": { "fontSize": 14, "color": "#fff" }, // "data": ["高一(1)班", "高一(2)班"] }, "radar": { name: { // (圆外的标签)雷达图每个指示器名称的配置项。 formatter: '{value}', textStyle: { fontSize: 6, color: '#000' } }, nameGap: 5, "center": ["50%", "50%"], "radius": "70%", "startAngle": 90, "splitNumber": 5, "shape": "circle", "splitArea": { "areaStyle": { "color": ["transparent"] } }, "axisLabel": { "show": false, "fontSize": 18, "color": "#fff", "fontStyle": "normal", "fontWeight": "normal" }, "axisLine": { "show": true, "lineStyle": { "color": "#045c95 "// } }, "splitLine": { "show": true, "lineStyle": { "color": "#045c95"// } }, "indicator": [{ "color":"#fff", "name": "企业战略", "max": 10 }, { "color":"#fff", "name": "市场状况", "max": 10 }, { "color":"#fff", "name": "竞争态势", "max": 10 }, { "color":"#fff", "name": "行业状况", "max": 10 }, { "color":"#fff", "name": "风控管理", "max": 10 }, ] }, "series": { "name":"企业经济能力评价", "type": "radar", "symbol": "circle", "symbolSize": 0, // "itemStyle": { // "normal": { // color:'rgba(19, 173, 255, 1)', // "borderColor": "rgba(19, 173, 255, 0.4)", // "borderWidth": 10 // } // }, "areaStyle": { "normal": { "color": "rgba(163, 161, 91, 1)" } }, "lineStyle": { "normal": { "color": "rgba(1, 232, 223, 1)", "width": 2, // "type": "dashed" } }, "data": [ [10,0,6,6,10] ] } }; MyChart.setOption(option) } get_radar_3() function get_radar_2() { var MyChart = echarts.init(document.querySelector("#blb_2")); var option = { // backgroundColor: '#0A2E5D', "normal": { "top": 200, "left": 300, "width": 500, "height": 400, "zIndex": 6, "backgroundColor": "" }, "color": ["rgba(245, 166, 35, 1)", "rgba(19, 173, 255, 1)"], "title": { "show": true, // "text": "学生行为习惯分析", "left": "40%", "top": "1%", "textStyle": { "fontSize": 18, "color": "#fff", "fontStyle": "normal", "fontWeight": "normal" } }, "tooltip": { "show": true, "trigger": "item" }, "legend": { "show": true, "icon": "circle", "left": "35%", "top": "90%", "orient": "horizontal", "textStyle": { "fontSize": 14, "color": "#fff" }, // "data": ["高一(1)班", "高一(2)班"] }, "radar": { name: { // (圆外的标签)雷达图每个指示器名称的配置项。 formatter: '{value}', textStyle: { fontSize: 6, color: '#000' } }, nameGap: 5, "center": ["50%", "50%"], "radius": "70%", "startAngle": 90, "splitNumber": 5, "shape": "circle", "splitArea": { "areaStyle": { "color": ["transparent"] } }, "axisLabel": { "show": false, "fontSize": 18, "color": "#fff", "fontStyle": "normal", "fontWeight": "normal" }, "axisLine": { "show": true, "lineStyle": { "color": "#045c95 "// } }, "splitLine": { "show": true, "lineStyle": { "color": "#045c95"// } }, "indicator": [{ "color":"#fff", "name": "领导力", "max": 10 }, { "color":"#fff", "name": "员工效率", "max": 10 }, { "color":"#fff", "name": "员工激励", "max": 10 }, { "color":"#fff", "name": "员工素质", "max": 10 },{ "color":"#fff", "name": "授权体系", "max": 10 },{ "color":"#fff", "name": "组织结构", "max": 10 }, ] }, "series": { "name":"企业经济能力评价", "type": "radar", "symbol": "circle", "symbolSize": 0, // "itemStyle": { // "normal": { // color:'rgba(19, 173, 255, 1)', // "borderColor": "rgba(19, 173, 255, 0.4)", // "borderWidth": 10 // } // }, "areaStyle": { "normal": { "color": "rgba(163, 161, 91, 1)" } }, "lineStyle": { "normal": { "color": "rgba(1, 232, 223, 1)", "width": 2, // "type": "dashed" } }, "data": [ [10,10,8,3.5,10,10] ] } }; MyChart.setOption(option) } get_radar_2() function get_radar_1() { var MyChart = echarts.init(document.querySelector("#blb_1")); var option = { // backgroundColor: '#0A2E5D', "normal": { "top": 200, "left": 300, "width": 500, "height": 400, "zIndex": 6, "backgroundColor": "" }, "color": ["rgba(245, 166, 35, 1)", "rgba(19, 173, 255, 1)"], "title": { "show": true, // "text": "学生行为习惯分析", "left": "40%", "top": "1%", "textStyle": { "fontSize": 18, "color": "#fff", "fontStyle": "normal", "fontWeight": "normal" } }, "tooltip": { "show": true, "trigger": "item" }, "legend": { "show": true, "icon": "circle", "left": "35%", "top": "90%", "orient": "horizontal", "textStyle": { "fontSize": 14, "color": "#fff" }, // "data": ["高一(1)班", "高一(2)班"] }, "radar": { name: { // (圆外的标签)雷达图每个指示器名称的配置项。 formatter: '{value}', textStyle: { fontSize: 6, color: '#000' } }, nameGap: 5, "center": ["50%", "50%"], "radius": "70%", "startAngle": 90, "splitNumber": 5, "shape": "circle", "splitArea": { "areaStyle": { "color": ["transparent"] } }, "axisLabel": { "show": false, "fontSize": 18, "color": "#fff", "fontStyle": "normal", "fontWeight": "normal" }, "axisLine": { "show": true, "lineStyle": { "color": "#045c95 "// } }, "splitLine": { "show": true, "lineStyle": { "color": "#045c95"// } }, "indicator": [{ "color":"#fff", "name": "发展能力", "max": 10 }, { "color":"#fff", "name": "盈利能力", "max": 10 }, { "color":"#fff", "name": "盈利质量", "max": 10 }, { "color":"#fff", "name": "运营能力", "max": 10 }, ] }, "series": { "name":"企业经济能力评价", "type": "radar", "symbol": "circle", "symbolSize": 0, // "itemStyle": { // "normal": { // color:'rgba(19, 173, 255, 1)', // "borderColor": "rgba(19, 173, 255, 0.4)", // "borderWidth": 10 // } // }, "areaStyle": { "normal": { "color": "rgba(163, 161, 91, 1)" } }, "lineStyle": { "normal": { "color": "rgba(1, 232, 223, 1)", "width": 2, // "type": "dashed" } }, "data": [ [0,6,8,8] ] } }; MyChart.setOption(option) } get_radar_1() function get_radar_4() { var MyChart = echarts.init(document.querySelector("#blb_4")); var option = { // backgroundColor: '#0A2E5D', "normal": { "top": 200, "left": 300, "width": 500, "height": 400, "zIndex": 6, "backgroundColor": "" }, "color": ["rgba(245, 166, 35, 1)", "rgba(19, 173, 255, 1)"], "title": { "show": true, // "text": "学生行为习惯分析", "left": "40%", "top": "1%", "textStyle": { "fontSize": 18, "color": "#fff", "fontStyle": "normal", "fontWeight": "normal" } }, "tooltip": { "show": true, "trigger": "item" }, "legend": { "show": true, "icon": "circle", "left": "35%", "top": "90%", "orient": "horizontal", "textStyle": { "fontSize": 14, "color": "#fff" }, // "data": ["高一(1)班", "高一(2)班"] }, "radar": { name: { // (圆外的标签)雷达图每个指示器名称的配置项。 formatter: '{value}', textStyle: { fontSize: 6, color: '#000' } }, nameGap: 5, "center": ["50%", "50%"], "radius": "70%", "startAngle": 90, "splitNumber": 5, "shape": "circle", "splitArea": { "areaStyle": { "color": ["transparent"] } }, "axisLabel": { "show": false, "fontSize": 18, "color": "#fff", "fontStyle": "normal", "fontWeight": "normal" }, "axisLine": { "show": true, "lineStyle": { "color": "#045c95 "// } }, "splitLine": { "show": true, "lineStyle": { "color": "#045c95"// } }, "indicator": [{ "color":"#fff", "name": "处理", "max": 10 }, { "color":"#fff", "name": "检查", "max": 10 }, { "color":"#fff", "name": "行动", "max": 10 }, { "color":"#fff", "name": "计划", "max": 10 },{ "color":"#fff", "name": "制度流程", "max": 10 }, ] }, "series": { "name":"企业经济能力评价", "type": "radar", "symbol": "circle", "symbolSize": 0, // "itemStyle": { // "normal": { // color:'rgba(19, 173, 255, 1)', // "borderColor": "rgba(19, 173, 255, 0.4)", // "borderWidth": 10 // } // }, "areaStyle": { "normal": { "color": "rgba(163, 161, 91, 1)" } }, "lineStyle": { "normal": { "color": "rgba(1, 232, 223, 1)", "width": 2, // "type": "dashed" } }, "data": [ [10,10,10,10,10] ] } }; MyChart.setOption(option) } get_radar_4() function get_radar_5() { var MyChart = echarts.init(document.querySelector("#blb_5")); var option = { // backgroundColor: '#0A2E5D', "normal": { "top": 200, "left": 300, "width": 500, "height": 400, "zIndex": 6, "backgroundColor": "" }, "color": ["rgba(245, 166, 35, 1)", "rgba(19, 173, 255, 1)"], "title": { "show": true, // "text": "学生行为习惯分析", "left": "40%", "top": "1%", "textStyle": { "fontSize": 18, "color": "#fff", "fontStyle": "normal", "fontWeight": "normal" } }, "tooltip": { "show": true, "trigger": "item" }, "legend": { "show": true, "icon": "circle", "left": "35%", "top": "90%", "orient": "horizontal", "textStyle": { "fontSize": 14, "color": "#fff" }, // "data": ["高一(1)班", "高一(2)班"] }, "radar": { name: { // (圆外的标签)雷达图每个指示器名称的配置项。 formatter: '{value}', textStyle: { fontSize: 6, color: '#000' } }, nameGap: 5, "center": ["50%", "50%"], "radius": "70%", "startAngle": 90, "splitNumber": 5, "shape": "circle", "splitArea": { "areaStyle": { "color": ["transparent"] } }, "axisLabel": { "show": false, "fontSize": 18, "color": "#fff", "fontStyle": "normal", "fontWeight": "normal" }, "axisLine": { "show": true, "lineStyle": { "color": "#045c95 "// } }, "splitLine": { "show": true, "lineStyle": { "color": "#045c95"// } }, "indicator": [{ "color":"#fff", "name": "安全生产", "max": 10 }, { "color":"#fff", "name": "工艺管理", "max": 10 }, { "color":"#fff", "name": "库存管理", "max": 10 }, { "color":"#fff", "name": "生产效率", "max": 10 },{ "color":"#fff", "name": "生产能力", "max": 10 },{ "color":"#fff", "name": "质量管理", "max": 10 }, ] }, "series": { "name":"企业经济能力评价", "type": "radar", "symbol": "circle", "symbolSize": 0, // "itemStyle": { // "normal": { // color:'rgba(19, 173, 255, 1)', // "borderColor": "rgba(19, 173, 255, 0.4)", // "borderWidth": 10 // } // }, "areaStyle": { "normal": { "color": "rgba(163, 161, 91, 1)" } }, "lineStyle": { "normal": { "color": "rgba(1, 232, 223, 1)", "width": 2, // "type": "dashed" } }, "data": [ [10,6,8,8,9,7] ] } }; MyChart.setOption(option) } get_radar_5() function get_radar_6() { var MyChart = echarts.init(document.querySelector("#blb_6")); var option = { // backgroundColor: '#0A2E5D', "normal": { "top": 200, "left": 300, "width": 500, "height": 400, "zIndex": 6, "backgroundColor": "" }, "color": ["rgba(245, 166, 35, 1)", "rgba(19, 173, 255, 1)"], "title": { "show": true, // "text": "学生行为习惯分析", "left": "40%", "top": "1%", "textStyle": { "fontSize": 18, "color": "#fff", "fontStyle": "normal", "fontWeight": "normal" } }, "tooltip": { "show": true, "trigger": "item" }, "legend": { "show": true, "icon": "circle", "left": "35%", "top": "90%", "orient": "horizontal", "textStyle": { "fontSize": 14, "color": "#fff" }, // "data": ["高一(1)班", "高一(2)班"] }, "radar": { name: { // (圆外的标签)雷达图每个指示器名称的配置项。 formatter: '{value}', textStyle: { fontSize: 6, color: '#000' } }, nameGap: 5, "center": ["50%", "50%"], "radius": "70%", "startAngle": 90, "splitNumber": 5, "shape": "circle", "splitArea": { "areaStyle": { "color": ["transparent"] } }, "axisLabel": { "show": false, "fontSize": 18, "color": "#fff", "fontStyle": "normal", "fontWeight": "normal" }, "axisLine": { "show": true, "lineStyle": { "color": "#045c95 "// } }, "splitLine": { "show": true, "lineStyle": { "color": "#045c95"// } }, "indicator": [{ "color":"#fff", "name": "产品组合", "max": 10 }, { "color":"#fff", "name": "客户关系", "max": 10 }, { "color":"#fff", "name": "市场地位", "max": 10 }, { "color":"#fff", "name": "营销策略", "max": 10 },{ "color":"#fff", "name": "销售能力", "max": 10 }, ] }, "series": { "name":"企业经济能力评价", "type": "radar", "symbol": "circle", "symbolSize": 0, // "itemStyle": { // "normal": { // color:'rgba(19, 173, 255, 1)', // "borderColor": "rgba(19, 173, 255, 0.4)", // "borderWidth": 10 // } // }, "areaStyle": { "normal": { "color": "rgba(163, 161, 91, 1)" } }, "lineStyle": { "normal": { "color": "rgba(1, 232, 223, 1)", "width": 2, // "type": "dashed" } }, "data": [ [8,10,10,8,6] ] } }; MyChart.setOption(option) } get_radar_6() function get_radar_7() { var MyChart = echarts.init(document.querySelector("#blb_7")); var option = { // backgroundColor: '#0A2E5D', "normal": { "top": 200, "left": 300, "width": 500, "height": 400, "zIndex": 6, "backgroundColor": "" }, "color": ["rgba(245, 166, 35, 1)", "rgba(19, 173, 255, 1)"], "title": { "show": true, // "text": "学生行为习惯分析", "left": "40%", "top": "1%", "textStyle": { "fontSize": 18, "color": "#fff", "fontStyle": "normal", "fontWeight": "normal" } }, "tooltip": { "show": true, "trigger": "item" }, "legend": { "show": true, "icon": "circle", "left": "35%", "top": "90%", "orient": "horizontal", "textStyle": { "fontSize": 14, "color": "#fff" }, // "data": ["高一(1)班", "高一(2)班"] }, "radar": { name: { // (圆外的标签)雷达图每个指示器名称的配置项。 formatter: '{value}', textStyle: { fontSize: 6, color: '#000' } }, nameGap: 5, "center": ["50%", "50%"], "radius": "70%", "startAngle": 90, "splitNumber": 5, "shape": "circle", "splitArea": { "areaStyle": { "color": ["transparent"] } }, "axisLabel": { "show": false, "fontSize": 18, "color": "#fff", "fontStyle": "normal", "fontWeight": "normal" }, "axisLine": { "show": true, "lineStyle": { "color": "#045c95 "// } }, "splitLine": { "show": true, "lineStyle": { "color": "#045c95"// } }, "indicator": [{ "color":"#fff", "name": "IT资源", "max": 10 }, { "color":"#fff", "name": "外部资源", "max": 10 }, { "color":"#fff", "name": "无形资源", "max": 10 }, { "color":"#fff", "name": "有形资源", "max": 10 } ] }, "series": { "name":"企业经济能力评价", "type": "radar", "symbol": "circle", "symbolSize": 0, // "itemStyle": { // "normal": { // color:'rgba(19, 173, 255, 1)', // "borderColor": "rgba(19, 173, 255, 0.4)", // "borderWidth": 10 // } // }, "areaStyle": { "normal": { "color": "rgba(163, 161, 91, 1)" } }, "lineStyle": { "normal": { "color": "rgba(1, 232, 223, 1)", "width": 2, // "type": "dashed" } }, "data": [ [6,6,6,10] ] } }; MyChart.setOption(option) } get_radar_7() function get_radar_8() { var MyChart = echarts.init(document.querySelector("#blb_8")); var option = { // backgroundColor: '#0A2E5D', "normal": { "top": 200, "left": 300, "width": 500, "height": 400, "zIndex": 6, "backgroundColor": "" }, "color": ["rgba(245, 166, 35, 1)", "rgba(19, 173, 255, 1)"], "title": { "show": true, // "text": "学生行为习惯分析", "left": "40%", "top": "1%", "textStyle": { "fontSize": 18, "color": "#fff", "fontStyle": "normal", "fontWeight": "normal" } }, "tooltip": { "show": true, "trigger": "item" }, "legend": { "show": true, "icon": "circle", "left": "35%", "top": "90%", "orient": "horizontal", "textStyle": { "fontSize": 14, "color": "#fff" }, // "data": ["高一(1)班", "高一(2)班"] }, "radar": { name: { // (圆外的标签)雷达图每个指示器名称的配置项。 formatter: '{value}', textStyle: { fontSize: 6, color: '#000' } }, nameGap: 5, "center": ["50%", "50%"], "radius": "70%", "startAngle": 90, "splitNumber": 5, "shape": "circle", "splitArea": { "areaStyle": { "color": ["transparent"] } }, "axisLabel": { "show": false, "fontSize": 18, "color": "#fff", "fontStyle": "normal", "fontWeight": "normal" }, "axisLine": { "show": true, "lineStyle": { "color": "#045c95 "// } }, "splitLine": { "show": true, "lineStyle": { "color": "#045c95"// } }, "indicator": [{ "color":"#fff", "name": "安全生产", "max": 10 }, { "color":"#fff", "name": "工艺管理", "max": 10 }, { "color":"#fff", "name": "库存管理", "max": 10 }, { "color":"#fff", "name": "生产效率", "max": 10 } , { "color":"#fff", "name": "生产能力", "max": 10 }, { "color":"#fff", "name": "质量管理", "max": 10 }] }, "series": { "name":"企业经济能力评价", "type": "radar", "symbol": "circle", "symbolSize": 0, // "itemStyle": { // "normal": { // color:'rgba(19, 173, 255, 1)', // "borderColor": "rgba(19, 173, 255, 0.4)", // "borderWidth": 10 // } // }, "areaStyle": { "normal": { "color": "rgba(163, 161, 91, 1)" } }, "lineStyle": { "normal": { "color": "rgba(1, 232, 223, 1)", "width": 2, // "type": "dashed" } }, "data": [ [6,6,6,10,8,7] ] } }; MyChart.setOption(option) } get_radar_8() // grt_radar(document.querySelector("#blb_1")) // grt_radar(document.querySelector("#blb_2")) // grt_radar(document.querySelector("#blb_3")) // grt_radar(document.querySelector("#blb_4")) // grt_radar(document.querySelector("#blb_5")) // grt_radar(document.querySelector("#blb_6")) // grt_radar(document.querySelector("#blb_7")) // grt_radar(document.querySelector("#blb_8"))