条形图
import pandas as pd

reviews = pd.read_csv('fandango_scores.csv') # 电影评分的数据集,包含了电影名称和不同对象的评分

cols = ['FILM','RT_user_norm','Metacritic_user_nom','IMDB_norm','Fandango_Ratingvalue','Fandango_Stars']

norm_reviews = reviews[cols]
print(norm_reviews[:1])
                             FILM  RT_user_norm  Metacritic_user_nom  \
0  Avengers: Age of Ultron (2015)           4.3                 3.55

   IMDB_norm  Fandango_Ratingvalue  Fandango_Stars
0        3.9                   4.5             5.0
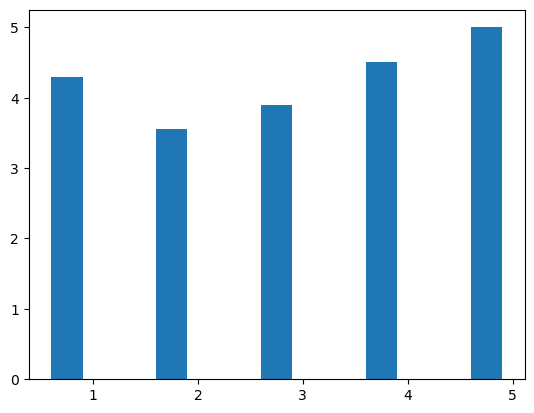
import matplotlib.pyplot as plt
from numpy import arange

num_cols = ['RT_user_norm','Metacritic_user_nom','IMDB_norm','Fandango_Ratingvalue','Fandango_Stars']

bar_height =  reviews[cols].loc[0,num_cols].values # 拿到值,y轴高度
print(bar_height)

bar_positions = arange(5)+0.75 # x轴位置
print(bar_positions)

fig, ax = plt.subplots()
ax.bar(bar_positions,bar_height,0.3)
plt.show()
[4.3 3.55 3.9 4.5 5.0]
[0.75 1.75 2.75 3.75 4.75]
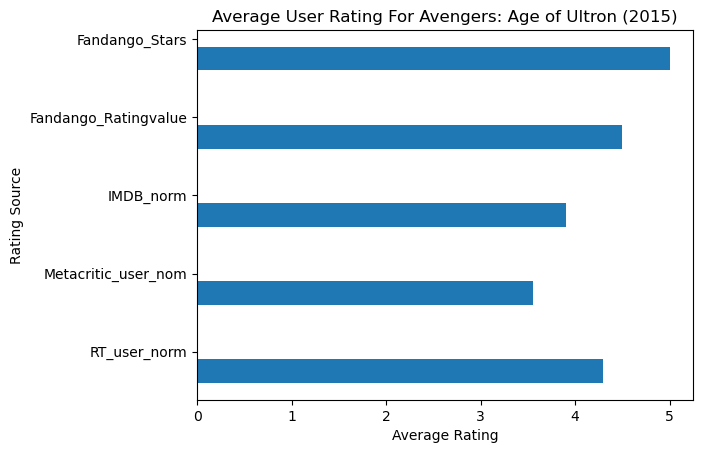
# 从数据集中选取两组对象的评分数据

import matplotlib.pyplot as plt
from numpy import arange

num_cols = ['RT_user_norm','Metacritic_user_nom','IMDB_norm','Fandango_Ratingvalue','Fandango_Stars']

bar_height =  reviews[cols].loc[0,num_cols].values # 拿到值,y轴高度
print(bar_height)

bar_positions = arange(5)+0.75 # x轴位置
print(bar_positions)

tick_positions = range(1,6)

fig, ax = plt.subplots()
ax.barh(bar_positions,bar_height,0.3) # 柱子距离,柱子高度,柱子宽度

ax.set_yticks(tick_positions) # 显示刻度值
ax.set_yticklabels(num_cols)

ax.set_ylabel('Rating Source') # 显示标签
ax.set_xlabel('Average Rating')

ax.set_title('Average User Rating For Avengers: Age of Ultron (2015)')

plt.show()
[4.3 3.55 3.9 4.5 5.0]
[0.75 1.75 2.75 3.75 4.75]
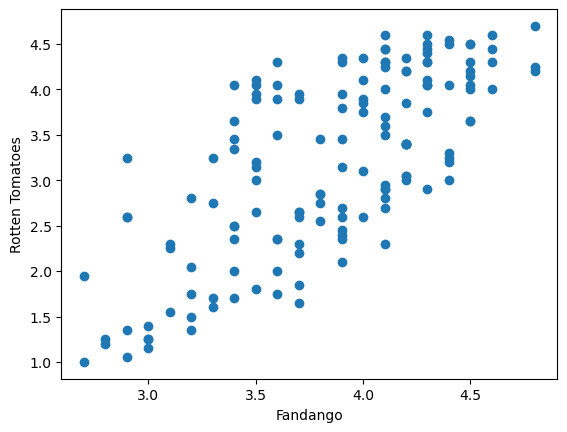
散点图
fig, ax = plt.subplots()

ax.scatter(reviews['Fandango_Ratingvalue'] ,reviews['RT_user_norm'] )
ax.set_xlabel('Fandango')
ax.set_ylabel('Rotten Tomatoes')

plt.show()
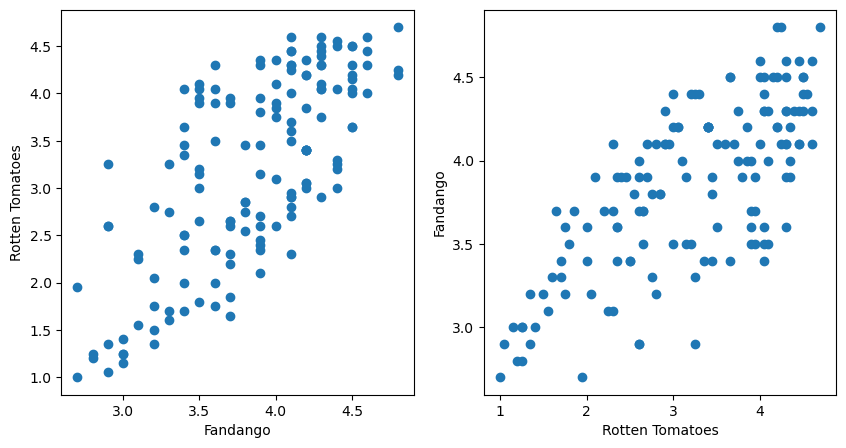
flg2 = plt.figure(figsize=(10,5)) # 创建画图区间,设置长高度

ax1 = flg2.add_subplot(1,2,1)
ax2 = flg2.add_subplot(1,2,2)

ax1.scatter(reviews['Fandango_Ratingvalue'] ,reviews['RT_user_norm'] )
ax1.set_xlabel('Fandango')
ax1.set_ylabel('Rotten Tomatoes')

ax2.scatter(reviews['RT_user_norm'] ,reviews['Fandango_Ratingvalue'] )
ax2.set_xlabel('Rotten Tomatoes')
ax2.set_ylabel('Fandango')

plt.show()